Hydrograph Computation CE 365 K Hydraulic Engineering Design


")
 at time t and")


- Slides: 19
Hydrograph Computation CE 365 K Hydraulic Engineering Design Spring 2015
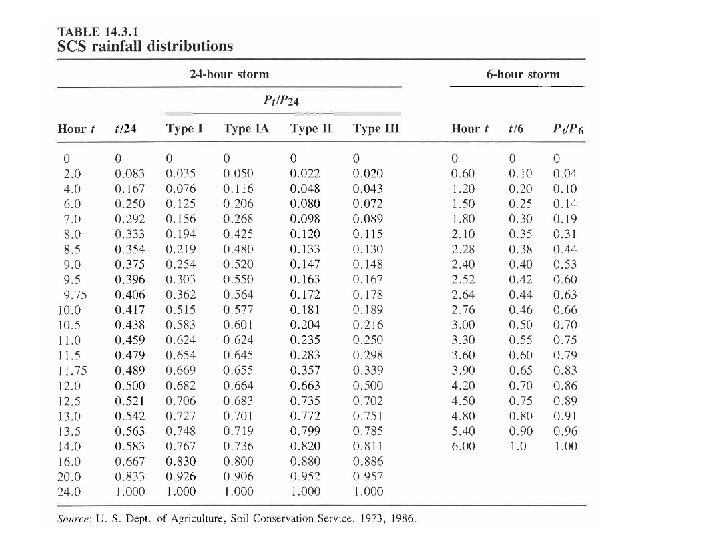
Depth-Duration-Frequency Table
Source: SCS TR-55 Manual, 1986
Source: SCS TR-55 Manual, 1986
Hydrologic Analysis Change in storage w. r. t. time = inflow - outflow In the case of a linear reservoir, S = k. Q Transfer function for a linear system (S = k. Q).
Proportionality and superposition • Linear system (k is constant in S = k. Q) – Proportionality • If I 1 Q 1 then C*I 2 C*Q 2 – Superposition • If I 1 Q 1 and I 2 Q 2, then I 1 +I 2 Q 1 + Q 2
Impulse response function Impulse input: an input applied instantaneously (spike) at time t and zero everywhere else An unit impulse at t produces as unit impulse response function u(t-t) Principle of proportionality and superposition
Unit Hydrograph Theory • Direct runoff hydrograph resulting from a unit depth of excess rainfall occurring uniformly on a watershed at a constant rate for a specified duration. • Unit pulse response function of a linear hydrologic system • Can be used to derive runoff from any excess rainfall on the watershed.
Unit hydrograph assumptions • Assumptions – Excess rainfall has constant intensity during duration – Excess rainfall is uniformly distributed on watershed – Base time of runoff is constant – Ordinates of unit hydrograph are proportional to total runoff (linearity) – Unit hydrograph represents all characteristics of watershed (lumped parameter) and is time invariant (stationarity)
Application of convolution to the output from a linear system
Need for synthetic UH • UH is applicable only for gauged watershed and for the point on the stream where data are measured • For other locations on the stream in the same watershed or for nearby (ungauged) watersheds, synthetic procedures are used.
SCS dimensionless hydrograph • Synthetic UH in which the discharge is expressed by the ratio of q to qp and time by the ratio of t to Tp • If peak discharge and lag time are known, UH can be estimated. Tc: time of concentration C = 2. 08 (483. 4 in English system) A: drainage area in km 2 (mi 2) tp = lag time in HEC-HMS
Example • Construct a 10 -min SCS UH. A = 3. 0 km 2 and Tc = 1. 25 h 0. 833 h q Multiply y-axis of SCS hydrograph by qp and x-axis by Tp to get the required UH, or construct a triangular UH 7. 49 m 3/s. cm 2. 22 h t
Watersheds upstream of Dam 6
Subbasin BUT_060
Flow along the longest path Channel Flow Shallow Flow Sheet Flow Sum travel times over each segment
Modeling Runoff from BUT_060 How to characterize this subbasin? How quickly does it move? How much runoff?
Results for Run “ 10” 24 hour design storm of 10” total precipitation in 10 min increments