Higher Education Data Vernon College Midwestern State University


- Slides: 15

Higher Education Data Vernon College & Midwestern State University

Participation Data from THECB Vernon College, 2011 Midwestern State University, 2011 • Enrollment by Year; 2011 by Ethnicity Percentage Institution 2010 2011 Vernon College 3167 3247 Midwestern State University 6133 5811 Institution White Hispanic African American Multi. Racial Asian/ Pacific Inter’l Other/ Unk Vernon 69. 3 16. 1 8. 3 . 5 1. 8 0 4 Midwestern 63. 8 12. 3 11. 8 . 4 3. 5 5. 1 3. 2 http: //www. txhighereddata. org/Interactive/Resumes/

Online Institutional Resumes: THECB Vernon College, 2011 Midwestern State University, 2011 • Graduation/Completion Numbers Degrees and Certificates Awarded 2011 Vernon College Associate’s 238 Certificate 1 289 Certificate 2 19 Midwestern State University Bachelor’s 1027 Master’s 204 Doctorate 0 http: //www. txhighereddata. org/Interactive/Resumes/

P-16 Data from THECB Vernon College, 2011 Midwestern State University, 2011 • Dual Credit Enrollment 2011 Vernon College 572 Midwestern State University 19 http: //www. txhighereddata. org/Interactive/HSColl. Link 2. CFM

Participation Data from THECB Vernon College, 2011 Developmental Education, Fall 2008 Cohort Tracked for 2 years FTIC Students Not Needing Dev. Ed. N Vernon College 525 % Attempting College Courses and Completing Math 30 54 Reading 72. 4 69. 1 Writing 72. 4 68. 4 FTIC Students Requiring Dev. Ed. N % Attempting College Courses % Attempting and Completing Math 114 7. 9 66. 7 Reading 58 55. 2 75 Writing 27 55. 6 60 http: //www. txhighereddata. org/reports/performance/deved/

Student Migration Data from THECB Vernon College, 2011 Fall 2010 to Fall 2011 Graduates by program N % at Same % at Other 2 -yr % at 4 -yr % not found Academic 11 13. 8 35 47. 5 Technical 51 12. 8 1. 8 4. 8 80. 8 Tech-Prep 2 40 0 0 60 Non-graduates N % at Same % at Other % at 4 -yr 2 -yr % not found Academic 966 48 3. 4 14 34. 6 Technical 284 46. 8 1. 3 4. 4 47. 4 Tech-prep 1 16. 7 0 0 83. 3 http: //www. txhighereddata. org/reports/performance/ctcsmigr/

Academic Performance of Transfer Students from Vernon College, 2011 Developmental Education vs. No Developmental Education, Fall 2010 Developmental Education prior to Transfer Total N <2. 02. 49 2. 52. 99 3. 03. 49 >3. 5 Unk Enroll Fall ’ 11 Midwestern State 91 58 12 11 17 10 7 1 42 Tarleton State 8 3 2 0 0 0 1 0 2 Other public 4 -yr 20 10 5 1 1 1 4 N <2. 0 No Developmental Education 2. 0 - 2. 5 - 3. 0 - >3. 5 Unk 2. 49 2. 99 3. 49 Enroll Fall ‘ 11 Midwestern State 91 33 11 7 2 10 1 2 20 Tarleton State 8 5 0 1 2 2 0 0 5 Other public 4 -yr 20 10 2 1 0 1 5 1 4 http: //www. txhighereddata. org/reports/performance/ctctransfer/

Academic Performance of Transfer Students from Vernon College, 2011 Academic or Technical Associate Degrees, Fall 2010 Associate of Arts Degree Total N <2. 0 - 2. 52. 49 2. 99 Midwestern State 91 15 3 3 1 5 3 0 11 Tarleton State 8 3 0 1 1 1 0 0 3 Other public 4 -yr 20 1 0 1 N <2. 0 3. 0 - >3. 5 Unk 3. 49 2. 0 - 2. 5 - 3. 02. 49 2. 99 3. 49 >3. 5 Unk Enroll Fall ‘ 11 Technical Associate Degree Total Midwestern State 91 8 2 2 1 3 0 0 3 Tarleton State 8 0 0 0 0 Other public 4 -yr 20 0 0 0 0 http: //www. txhighereddata. org/reports/performance/ctctransfer/ Enroll Fall ‘ 11

Academic Performance of Transfer Students from Midwestern State University, 2011 Developmental Education vs. No Developmental Education, Fall 2010 Developmental Education prior to Transfer Total N <2. 02. 49 2. 52. 99 3. 03. 49 >3. 5 Unk Enroll Fall ‘ 11 Vernon College 91 58 12 11 17 10 7 1 42 North Central Texas College 18 1 0 0 1 0 1 Collin Co. Comm. 12 Developmental College. No District Education DCCD Richland College 12 9 N 2 <2. 0 8 2 Tarrant Co. Southeast 12 Texas Tech 11 Campus West Texas A&M 35 Weatherford College 11 Other Houston CC public 4 -yr 10 13 9 2 0 2 1 2 2 0 7 2. 0 - 2. 5 - 3. 0 - >3. 5 Unk Enroll 2. 49 2. 99 3. 49 Fall 0 5 1 0 0 5 ‘ 10 2 2 3 0 0 7 0 0 1 32 1 0 00 1 0 10 1 1 11 All Other 2 -yr Public 28 8 4 5 91 1 1 5 0 0 2 0 0 5 2 0 0 0 4 0 2 4 http: //www. txhighereddata. org/reports/performance/ctctransfer/ 1 3 17

Academic Performance of Transfer Students from Midwestern State University, 2011 Developmental Education vs. No Developmental Education, Fall 2010 No Developmental Education Total N <2. 02. 49 2. 52. 99 3. 03. 49 >3. 5 Unk Enroll Fall ‘ 11 Vernon College 91 33 11 7 2 10 1 2 20 North Central Texas College 18 17 2 2 4 5 4 0 11 3 0 0 1 1 1 0 3 <2. 0 0 Collin Co. Comm. 12 College District No Developmental DCCD Richland College 12 Education Tarrant Co. Southeast 12 Campus. Texas Tech 11 Weatherford College 11 West Texas A&M 35 Houston CC 10 Other public 4 -yr 13 All Other 2 -yr Public 91 3 0 2. 0 - 2. 5 - 3. 0 - >3. 5 Unk Enroll 2 1 0 3 2. 49 2. 99 3. 49 Fall 1 1 1 0 0 ‘ 10 2 1 10 5 7 2 63 0 1 1 0 0 11 0 2 1 1 1 8 4 N 0 0 1 3 1 14 1 0 0 4 0 15 0 2 0 3 2 12 0 0 1 3 http: //www. txhighereddata. org/reports/performance/ctctransfer/ 1 4 2 10 6 43

Academic Performance of Transfer Students from Midwestern State University, 2011 Core Curriculum Completed Prior to Transfer, Fall 2010 Core Complete Total N <2. 02. 49 2. 52. 99 3. 03. 49 >3. 5 Unk Enroll Fall ‘ 11 Vernon College 91 15 2 4 3 3 3 0 10 North Central Texas College 18 7 0 1 2 2 2 0 6 3 0 1 1 0 3 N 5 <2. 0 2 0 0 2. 0 - 2. 5 - 3. 0 - >3. 5 Unk Enroll 0 2 1 0 0 4 2. 49 2. 99 3. 49 Fall 0 0 0 ‘ 10 0 1 1 0 1 3 Collin Co. Comm. 12 College District No Developmental DCCD Richland College 12 Education Tarrant Co. Southeast 12 Campus. Texas Tech 11 Weatherford College 11 West Texas A&M 35 Houston CC 10 Other public 4 -yr 13 All Other 2 -yr Public 91 2 2 1 5 2 15 0 1 1 0 1 5 1 0 0 0 2 2 0 0 0 3 0 0 0 1 http: //www. txhighereddata. org/reports/performance/ctctransfer/ 1 4 2 2 2 12

Academic Performance of Transfer Students from Midwestern State University, 2011 Earned Associate of Arts Degree Prior to Transfer, Fall 2010 Core Complete Total N <2. 02. 49 2. 52. 99 3. 03. 49 >3. 5 Unk Enroll Fall ‘ 11 Vernon College 91 15 3 3 1 5 3 0 11 North Central Texas College 18 3 0 0 2 0 1 0 3 3 0 1 1 0 3 N 5 <2. 0 2 2 1 2. 0 - 2. 5 - 3. 0 - >3. 5 Unk Enroll 0 3 0 0 0 4 2. 49 2. 99 3. 49 Fall 1 0 0 ‘ 10 1 0 0 1 1 0 1 3 Collin Co. Comm. 12 College District No Developmental DCCD Richland College 12 Education Tarrant Co. Southeast 12 Campus. Texas Tech 11 Weatherford College 11 West Texas A&M 35 Houston CC 10 Other public 4 -yr 13 All Other 2 -yr Public 91 2 2 1 5 2 16 0 1 1 0 1 4 1 0 0 0 2 4 0 2 0 0 0 0 0 2 http: //www. txhighereddata. org/reports/performance/ctctransfer/ 1 4 2 2 2 11

Success Data from THECB Midwestern State, 2011 Developmental Education, Fall 2008 Cohort Tracked for 2 years FTIC Students Not Needing Dev. Ed. N Midwestern State 680 % Attempting College Courses and Completing Math 54. 8 72. 1 Reading 96. 7 91. 3 Writing 75. 6 87. 1 % Attempting College Courses % Attempting and Completing FTIC Students Requiring Dev. Ed. N Math 78 62. 8 55. 1 Reading 59 98. 3 87. 9 Writing 23 82. 6 84. 2 http: //www. txhighereddata. org/reports/performance/deved/

Success Data from THECB Vernon College, 2011 Percent of Students Transferred or Employed with Peer Comparison • Student Transfer and Completer Percentages Transferred with < 30 with > 30 SCH Employed Still Enrolled & Employed Vernon FY 2010 24. 6 8. 5 78. 5 6. 3 6. 5 FY 2011 30. 7 11. 1 n/a n/a Peers (2010) 20. 9 12. 9 64. 7 9. 9 http: //www. txhighereddata. org/Interactive/Resumes/

Success Data from THECB Midwestern State, 2011 Graduation Rate of First-time, Full-Time Degreeseeking Students • Student Baccalaureate Success Rate 4 -year rate, fall 2006 5 -year rate, fall 2005 6 -year rate, fall 2004 Same institution 16. 3 27. 9 30. 1 Other institution 1. 5 7. 1 11. 1 Total 17. 8 35. 1 41. 2 Midwestern State http: //www. txhighereddata. org/Interactive/Resumes/
 Midwestern university college of dental medicine
 Midwestern state university financial aid
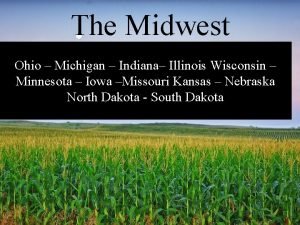
 What is considered midwest
 Havering college of further and higher education
 Chu hai college of higher education
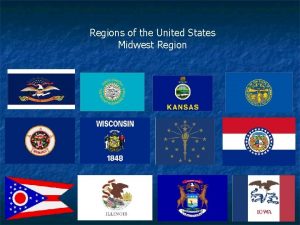
 Midwestern region of the united states
 沈榮麟
沈榮麟 Salahaddin university college of science
 Cal state la charter college of education
 Moscow state university of psychology and education
 Ospta locations
 Vernon scannell interesting facts
 Peter vernon evans
 Vernon bradley
 Mount vernon formula
 A case of murder


