H 1 arm cavity g factor changes resulting
- Slides: 9
H 1 arm cavity g factor changes resulting from 1064 nm heating Rick S, Malik R, Keita K, and Joe B LIGO-G 050085 -00 -W Detector Commissioning Meeting – March 7, 2005 1
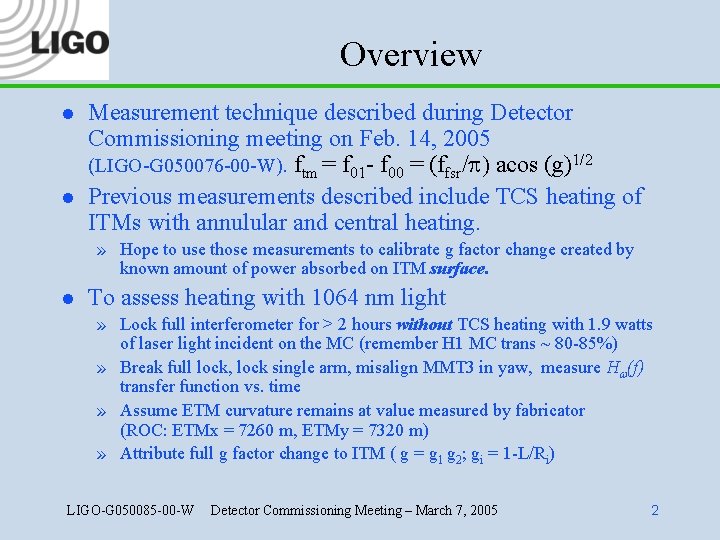
Overview l l Measurement technique described during Detector Commissioning meeting on Feb. 14, 2005 (LIGO-G 050076 -00 -W). ftm = f 01 - f 00 = (ffsr/p) acos (g)1/2 Previous measurements described include TCS heating of ITMs with annulular and central heating. » Hope to use those measurements to calibrate g factor change created by known amount of power absorbed on ITM surface. l To assess heating with 1064 nm light » Lock full interferometer for > 2 hours without TCS heating with 1. 9 watts of laser light incident on the MC (remember H 1 MC trans ~ 80 -85%) » Break full lock, lock single arm, misalign MMT 3 in yaw, measure Hw(f) transfer function vs. time » Assume ETM curvature remains at value measured by fabricator (ROC: ETMx = 7260 m, ETMy = 7320 m) » Attribute full g factor change to ITM ( g = g 1 g 2; gi = 1 -L/Ri) LIGO-G 050085 -00 -W Detector Commissioning Meeting – March 7, 2005 2
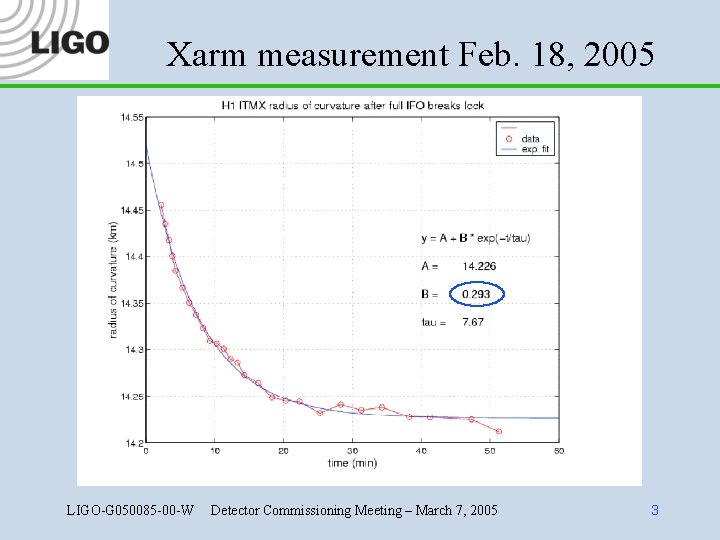
Xarm measurement Feb. 18, 2005 LIGO-G 050085 -00 -W Detector Commissioning Meeting – March 7, 2005 3
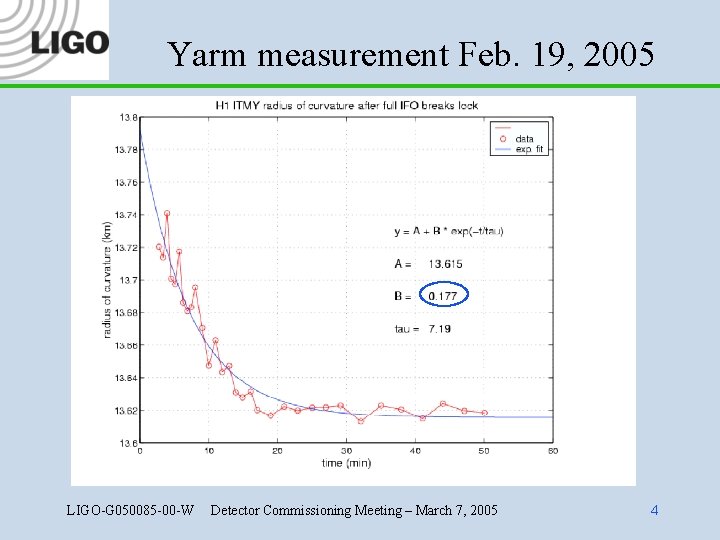
Yarm measurement Feb. 19, 2005 LIGO-G 050085 -00 -W Detector Commissioning Meeting – March 7, 2005 4
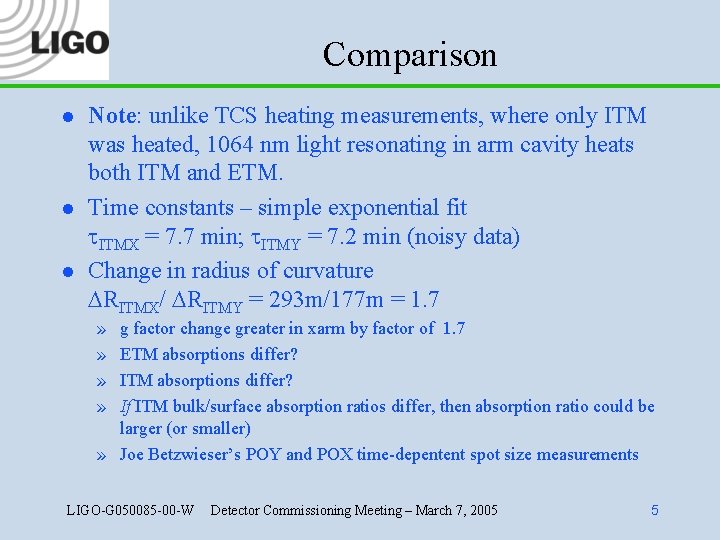
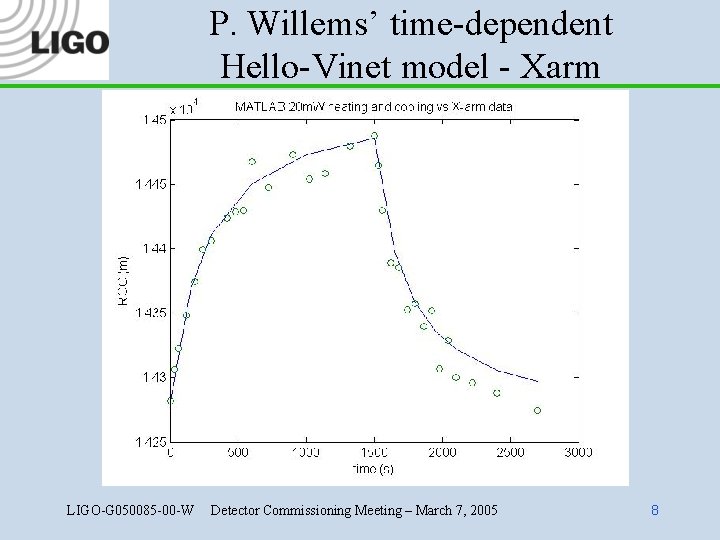
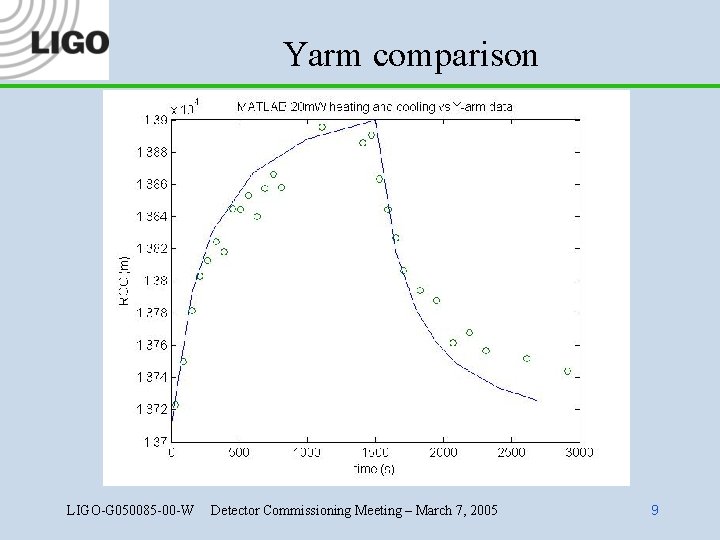
Comparison l l l Note: unlike TCS heating measurements, where only ITM was heated, 1064 nm light resonating in arm cavity heats both ITM and ETM. Time constants – simple exponential fit t. ITMX = 7. 7 min; t. ITMY = 7. 2 min (noisy data) Change in radius of curvature DRITMX/ DRITMY = 293 m/177 m = 1. 7 » » g factor change greater in xarm by factor of 1. 7 ETM absorptions differ? If ITM bulk/surface absorption ratios differ, then absorption ratio could be larger (or smaller) » Joe Betzwieser’s POY and POX time-depentent spot size measurements LIGO-G 050085 -00 -W Detector Commissioning Meeting – March 7, 2005 5
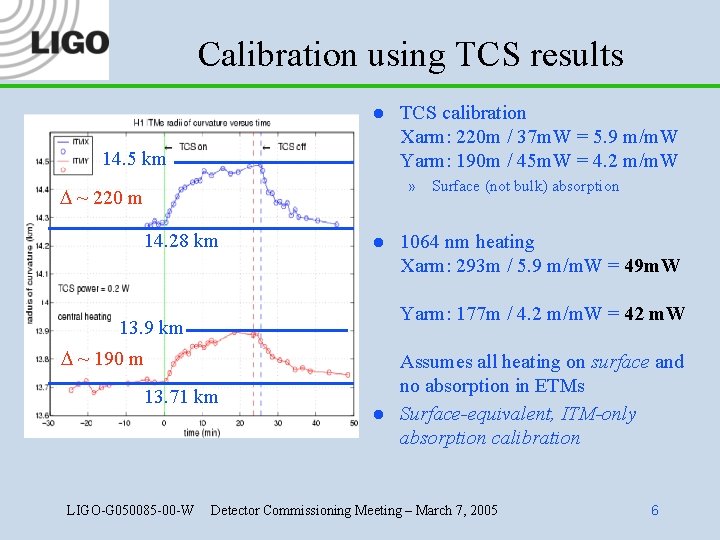
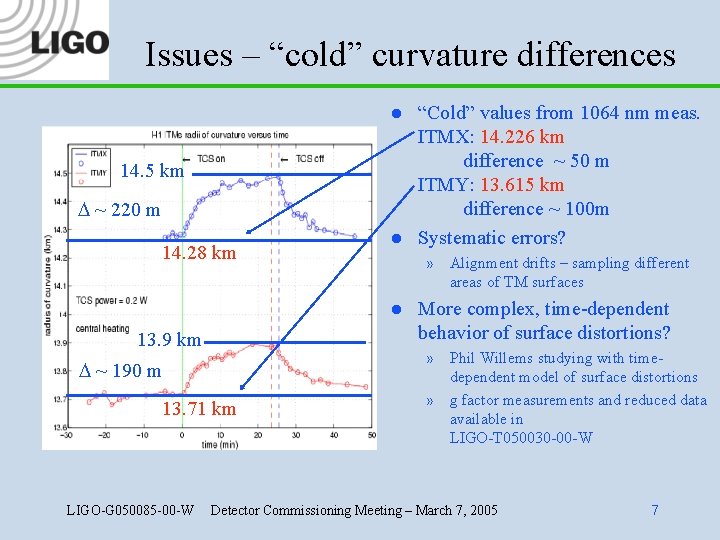
Calibration using TCS results l 14. 5 km TCS calibration Xarm: 220 m / 37 m. W = 5. 9 m/m. W Yarm: 190 m / 45 m. W = 4. 2 m/m. W » Surface (not bulk) absorption D ~ 220 m 14. 28 km l Yarm: 177 m / 4. 2 m/m. W = 42 m. W 13. 9 km D ~ 190 m 13. 71 km LIGO-G 050085 -00 -W 1064 nm heating Xarm: 293 m / 5. 9 m/m. W = 49 m. W l Assumes all heating on surface and no absorption in ETMs Surface-equivalent, ITM-only absorption calibration Detector Commissioning Meeting – March 7, 2005 6
Issues – “cold” curvature differences l 14. 5 km D ~ 220 m 14. 28 km l » Alignment drifts – sampling different areas of TM surfaces l 13. 9 km D ~ 190 m 13. 71 km LIGO-G 050085 -00 -W “Cold” values from 1064 nm meas. ITMX: 14. 226 km difference ~ 50 m ITMY: 13. 615 km difference ~ 100 m Systematic errors? More complex, time-dependent behavior of surface distortions? » Phil Willems studying with timedependent model of surface distortions » g factor measurements and reduced data available in LIGO-T 050030 -00 -W Detector Commissioning Meeting – March 7, 2005 7
P. Willems’ time-dependent Hello-Vinet model - Xarm LIGO-G 050085 -00 -W Detector Commissioning Meeting – March 7, 2005 8
Yarm comparison LIGO-G 050085 -00 -W Detector Commissioning Meeting – March 7, 2005 9