Greenland Isotope Project Diet in Norse Greenland AD


, with the distance from the")

- Slides: 17
Greenland Isotope Project Diet in Norse Greenland AD 1000 – AD 1450 Jette Arneborg
Initial study The 13 C values measured in Norse Greenland human bones suggested a change in Norse Greenland diet from predominantly terrestrial food to predominantly marine food. Questions left open: Was the changes due to: • Altered subsistence strategies ? • Altered farming practices (e. g. feeding with seaweed and/or fish and seal refuse)? Other questions : • Differences between the two settlement areas? • Differences between indvidual farms? • Differences between sexes? • What kind of marine food was digested?
The dataset 183 samples of human bone 118 Norse 65 Inuit 254 samples of animal bones Domesticates: Cattle, sheep, goat, pig, horse & dog Wild animals: seal, walrus, narwhale, caribou, muskoxen & hare 43 human bones have been AMS dated 38 animal bones have been AMS dated
The research group • Jan Heinemeier. AMS Dateringslaboratoriet, Aarhus Universitet • Niels Lynnerup, Section of Forensic Pathology, Copenhagen University • Jeppe Møhl, Zoological Museum, Copenhagen University • Erle Nelson, Simon Fraser University, Vancouver • Jette Arneborg, National Museum, Copenhagen
AMS dated Human samples AU III c. 980 1160 c. 1160 - 1300 c. 1300 +
Locals eller immigrants ?
Eastern Settlement vs Western Settlement Period I: ca. 980 - 1160 Period II: ca. 1060 - 1300 Period III: ca. 1300 -
Eastern Settlement
Ø 29 a#17 Ø 71#110 Ø 71#111 Ø 71#117 Ø 167#108 Ø 167#109 Ø 167#113 Ø 167#114 Ø 167#119 Ø 167#120 GUS#54. 2 GUS#58 GUS#60 GUS#104 V 48#32 V 48#37 V 48#56 V 48#155 V 48#157 V 48#159 V 54#151 V 54#163 V 51#156 V 51#390 V 51#396 V 51#399 V 51#402 V 51#404 V 51#408 V 51#409 V 51#415 13 C Cattle 0 -5 Period I Ø Period I V -10 -15 -20 Period I: ca. 980 – 1160 Period II: ca. 1160 – 1300 Period III: ca. 1300 -25 Period II Ø Period II V Period III Ø Period III V
V 54#163 V 54#151 V 48#159 V 48#157 GUS#60 GUS#58 GUS#54. 2 Period II: ca. 1160 - 1300 Ø 167#114 V 51#402 V 51#390 V 51#156 V 48#155 Ø 167#119 Ø 167#113 Ø 71#111 Period I ca. 980 - 1160 Ø 71#110 V 51#415 V 51#409 V 51#408 V 51#404 V 51#399 V 51#396 V 48#56 V 48#37 V 48#32 GUS#104 Ø 167#120 Ø 167#109 14 13, 5 13 12, 5 12 11, 5 11 10, 5 10 9, 5 9 8, 5 8 7, 5 7 6, 5 6 5, 5 5 4, 5 4 3, 5 3 2, 5 2 Ø 167#108 Ø 71#117 Ø 29 a#17 15 N Cattle Period III: ca: 1300 - Period I Ø Period I V Period II Ø Period II V Period III Ø Period III V
Greenland vs Iceland Ø 23 c Ø 111#14 Ø 111#15 Ø 1 a Ø 111#13 V 51#2 Ø 149#7 V 7 K-4120 Ø 149#10 V 7#174 Ø 66#23 V 51#4 Ø 149#8 Ø 149#213 Ø 149#9 Ø 111#207 Ø 111#206 Ø 23 b Ø 1 b V 51#6 Ø 149#215 V 51#3 Ø 23 a V 7 K-4117 V 51#256 Ø 66#24 V 51#1 V 51#253 Ø 47#21 Ø 111#210 Ø 111#208 V 51#258 Ø 149#216 Ø 149#214 Ø 111#205 Ø 167 Ø 47#22 IS #62 Ø 47#20 IS #61 V 7#175 Ø 35 a Tj#19 IS #31 IS #33 Tj#26 Tj#27 Tj#16 Tj#25 Ø 48 b Tj#12 V 51#240 V 51#197 Ø 48 a IS #32 Ø 35 b IS #22 Ø 35 c Tj#11 IS #63 IS #25 IS #28 Ø 35 a IS#4 IS #20 Tj#28 IS #19 IS #35 Tj#18 IS #36 IS # 8 -13, 5 -14, 5 -15, 5 -16, 5 -17, 5 -18, 5 -19, 5 -20, 5 -21 Greenland
13 C Iceland
Icelandic localities The encircled locations (8, 15, 19, 21), with the distance from the sea indicated in km, represent localities where more than one individual is 14 C dated
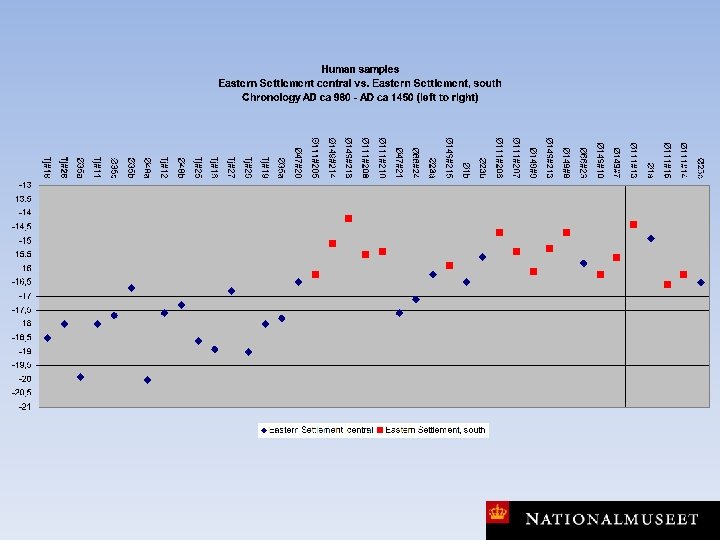
Some conclusions • Norse Greenland dietary economy changes from a predominantly terrrestrial diet to a predominantly marine diet. • We see no changes in farming practices – the differences in 15 N between the Eastern and the Western Settlement could be different farming practices (manuering? ) or it was caused by for instance geographical, enviromental differences. • Our dataset indicates differences in the dietary economy between the central part of the Eastern Settlement and the southern part. The southern part of the Eastern Settlement and the Western Settlement are more or less similar. • We can not see differences between individual farms (due to the dataset – we do not know where the sampled humans came from – we know of the church where they were buried). • We can not se any differences between the sexes. • Seals must have been the most important meat supplier s – we can however not say anything about the impact of fish. • In Iceland the dietary economy reflects geography – in Greenland it does not.