Fundamentals of Corporate Finance Chapter 12 Capital Asset

 • NPV, IRR, Payback, ARR")
 Diversify (review correlation) Use the CAPM")


")
 Current Investments Expected Return = (0. 6 x 10%) + (0. 4 x")
 4.")
 New Investment Expected Return = (0. 3 x 3%) + (0. 7 x")
 5.")


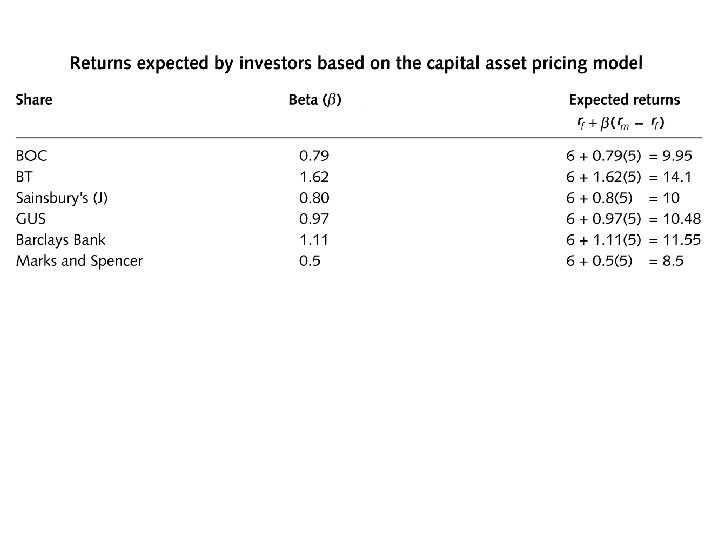
 or rj = rf + b (rm – rf)")
 measures the")


 Black Swans, Beta, Risk, and Return Interest in these")


- Slides: 29
Fundamentals of Corporate Finance Chapter 12 Capital Asset Pricing Model
Review • Compounding and discounting (APR, multiple compounding periods) • NPV, IRR, Payback, ARR (Capital budgeting, incremental IRR, sensitivity, EAA) • Cash flow (pattern, taxation, WDA, inflation, real and money rates) • Cost of debt (yield, term structure, cost of debt after tax, strips) • Next: Cost of equity
Aims • • • Define risk (review STDEV) Diversify (review correlation) Use the CAPM to estimate cost of equity Use Yahoo Finance WACC example Chapter 11 and 13
WHAT DOES THIS MEAN?
Unsystematic risk
Systematic risk
Correlation
Risk and Return A company has estimated the following returns from its current investment activities: Probability 0. 6 0. 4 Return 10% 4% A new investment opportunity has been identified in respect of which the following returns have been estimated: Probability 0. 3 0. 7 Return 3% 15% Your are required to calculate the Risk and expected return in respect of the Company’s (a) Current investment (b) New opportunity
Expected return = Return R x Probability p = (Probability A x Return A) + (Probability B x Return B) Risk or Standard Deviation 2 = sum of P = probability R = Given return = Expected return
(a) Current Investments Expected Return = (0. 6 x 10%) + (0. 4 x 4%) = 6 % + 1. 6% = 7. 6% Risk = p(R-ER)2 Return A = 0. 6(10% - 7. 6%)2 + Return B = 0. 4(4%-7. 6%)2 = (3. 4546 + 5. 184) = 8. 640 = 2. 939
A 68. 2% Chance of a return between (7. 6 - 2. 9) 4. 7 and (7. 6 + 2. 9) 10. 5 Or, to look at the curve in a different way. A 0. 1% chance of a return of [7. 6 – (3 x 2. 9)] -1. 1% And A 15. 8% chance of a return of greater than [7. 6 + (1 x 2. 9)] 10. 5%
(b) New Investment Expected Return = (0. 3 x 3%) + (0. 7 x 15%) = 0. 9 % + 10. 5% = 11. 4% Risk = p(R-ER)2 Return A = 0. 3(3% - 11. 4%)2 + Return B = 0. 7(15%-11. 4%)2 = (21. 168 + 9. 072) = 30. 240 = 5. 499
A 68. 2% Chance of a return between (11. 4 - 5. 5) 5. 9 and (11. 4 + 5. 5) 16. 9 Or, to look at the curve in a different way. A 0. 1% chance of a return of [11. 4 – (3 x 5. 5)] -5. 1% And A 15. 8% chance of a return of greater than [11. 4 + (1 x 5. 5)] 16. 9%
Summary • Current investment does not have as high expected return (7. 6% as opposed to 11. 4%) BUT • The new investment has a higher dispersion of outcomes, or standard deviation (5. 5 as opposed to 2. 9) • The new investment has higher risk.
Application of Capital Market Line and Portfolio Theory for Portfolio Selection
The capital asset pricing model Return and risk on financial securities, 1900 -2000 Source: Dimson, E. , Marsh, P. and Staunton, M. (2002) Triumph of the Optimists: 101 Years of Global Investment Returns. Princeton, NJ, and Oxford: Princeton University Press.
Cost of Equity Capital Ordinary shareholders are not explicitly offered payments. Rate of return on shares = Risk-free rate + Risk premium k. E = rf + RP Risk-free rate gives a return sufficient to compensate for both impatience to consume and inflation
Estimating the Risk Premium • 2 steps in estimating risk premium: • Step one is to estimate the average extra return demanded by investors above the riskfree return to induce them to buy a portfolio of average-risk level shares (rm – rf ) • Second stage is to adjust the risk premium for a typical (average-risk- level) share to suit the risk level for the particular company’s shares under consideration, (rm – rf) is multiplied by a systematic risk factor (Beta)
The Security Market Line (SML) or rj = rf + b (rm – rf)
Beta • The CAPM defined systematic risk as beta. • Beta (b) measures the covariance between the returns on a particular share with the returns on the market as a whole • In the CAPM model, because all investors are assumed to hold the market portfolio, an individual asset (e. g. a share) owned by an investor will have a risk that is defined as the amount of risk that it adds to the market portfolio Covariance of asset j with the market portfolio Beta of asset, j = ––––––––––––––––––– Variance of the market portfolio Cov (R , R ) j M bj = –––––– s 2 M
Betas as measured in 2003 b=1 A 1 per cent change in the market index return generally leads to a 1 per cent change in the return on a specific share. 0< b<1 A 1 per cent change in the market index return generally leads to a less than 1 per cent change in the returns on a specific share. 1> b A 1 per cent change in market index return generally leads to a greater return than 1 per cent on a specific company’s share. Source: Thomson Financial Datastream.
The Capital Market Line and the Security Market Line The SML shows the expected return for each security as a function of its beta with the market. According to the CAPM, the market portfolio is efficient, so all stocks and portfolios should lie on the SML.
Evidence: Estrada and Vargas (2010) Black Swans, Beta, Risk, and Return Interest in these large and unexpected swings in asset values has been revived after the publication of Taleb’s (2007) book, The Black Swan. Debate on the usefulness of beta as a measure of risk, and on the CAPM as an appropriate model to estimate required returns, has been raging on for decades. “No single paper can be expected to settle this controversy and ours is no exception. ” Evidence spans over 47 countries, 57 industries, and four decades and supports the usefulness of beta both as a measure of risk and as a tool for portfolio selection. “evidence supports beta both as a measure of risk and as a tool for portfolio selection. From a portfolio management perspective, then, we think it may be too early to discard this very controversial magnitude. In fact, from where we stand, beta does look alive and well. ”
Applications of the CAPM • Investment in the financial markets – Portfolio selection – Mispriced shares – Measuring portfolio performance • Calculating the required rate of return on a firm’s investment projects
Accepted theory and controversial theory • Shareholders demand a higher return for riskier assets – uncontroversial • Risk-averters are wise to diversify – uncontroversial • The risk of securities (for example shares) has two elements: (a) unsystematic risk factors specific to firms which can be diversified away; and (b) systematic risk caused by risk factors common to all firms – uncontroversial • Investors will not be rewarded for bearing unsystematic risk – uncontroversial • Different shares have different degrees of sensitivity to the systematic risk elements – uncontroversial • Systematic risk is measured by beta which, in practice, is calculated as the degree of co-movement of a security’s return with a market index return – highly controversial • Beta, as calculated by examining past returns, is valid for decision making concerned about the future – controversial
Implementation Issues: How large is the Equity Risk Premium • The equity risk premium is a subjective estimate. • In using historic data we are making at least two implicit assumptions: – There has been no systematic change in the risk aversion of investors over time. – The index being used as a benchmark has had an average riskiness that has not altered in a systematic way over time. • Differing views – Some City analysts plump for 2 per cent – Barclays Capital around 4 per cent, Competition Commission 3. 5 and 5 per cent, Ofgem 2. 5 per cent to 4. 5 per cent.
Technical problems with the CAPM • Measuring beta • Ex ante theory with ex post testing • The market portfolio is unobtainable • One-period model • Unrealistic assumptions
WACC • Burgundy is financed through bonds and ordinary shares. The bonds were issued five years ago at a par value of £ 100 (total funds raised £ 5 m). They carry an annual coupon of 10 per cent, are due to be redeemed in four years and are currently trading at £ 105. • The company’s shares have a market value of £ 4 m, the return on risk free government securities is 8 per cent and the risk premium is 5 per cent. Burgundy’s shares have a lower than average risk and its historic beta as measured by the co-movement of its shares to the market index correctly reflects the risk adjustment necessary to the average risk premium – that is 0. 85. • Calculate the cost of debt capital • Calculate the cost of equity capital • Calculate the average cost of capital