From Real World Problems to Esoteric Research Examples

From Real World Problems to Esoteric Research: Examples and Personal Experience C. F. Jeff Wu Georgia Institute of Technology • Three examples: – Integration of simulations with different mesh densities a nonstationary emulator. – Nano material synthesis sequential minimum energy design (smed). – Evolution of ideas in sensitivity testing design. • A path to innovation and other general remarks. 1

Casting Process Simulation • Shrinkage defects appear frequently in casting operation. Casting strength is low in the region where shrinkage defects occur. • From computer simulations, we can infer the possible shrinkage defects in the casting product through the Niyama criterion (Niyama et al. , 1982). – In the region where the Niyama value is low, serious shrinkage defect is likely to occur. 2
 • Niyama Value Example – In this figure, the purple")
Casting Process Simulation (cont’d) • Niyama Value Example – In this figure, the purple color shows the region with low Niyama value in a casting. – Simulations done at Chinese Acad Sciences. Factory in Shanxi Province. Figure: Niyama values in a casting 3

Finite Element Mesh • Finite Element method – Approximate an arbitrary function using piecewise linear function over a finite mesh. • As the mesh density increases, the degrees of freedom of the model go up as well: – Higher approximation efficiency. – Computationally more costly. Figure: a 2 D mesh (finer) (coarser) 4

Initial Question and Attempt • To develop a statistical emulator by integrating computer simulations with different real valued tuning parameters? • Main steps: – understanding the relationship between numerical error and tuning parameter; – finding what method is available; – constructing appropriate statistical models. 5

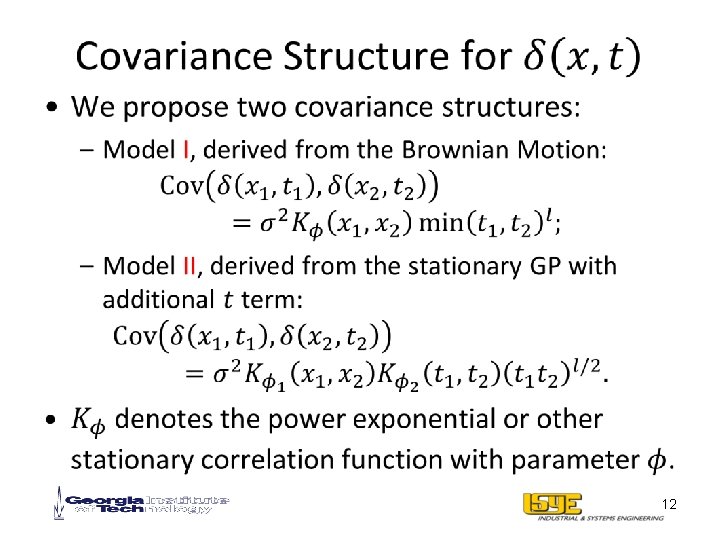
Kennedy-O’Hagan Model for Multi-fidelity Experiments • 6

Examples of Tuning Parameters • Numerical methods and their tuning parameters Numerical Methods Tuning Parameters Finite Element Analysis Mesh Density Finite Different Methods Step Length Iterative Algorithms Number of Iterations … … 7

Model Formulation • 8

A Class of Nonstationary Models • 9

Choice of Model Parameters • 10

Finite Element Methods • 11

Numerical Study Results • Mean square error MSE NSM ARM • NSM gives reasonable credible limits. – Credible interval shrinks around high accuracy data. Figure: Credible limits given by NSM 13

Nonstationary Emulator or KO’s Autoregressive Scheme? • Former’s framework is a special case of KO’s general framework; but the TWY model is different from the KO model and can be more useful if fidelity is defined by a single tuning parameter. • A generic scenario: to simulate a product reliably (e. g. , aerospace engr), only the best physical model (pde’s) is used but numerical details like “mesh density” or “time to equilibrium” can vary. Thus the fidelity is defined by a tuning parameter and a single nonstationary model (TWY) is more suitable than KO’s autoregressive scheme. 15
. Saws: Y 1")
Nanostructure Synthesis 180 individual nanostructures counted using Scanning Electron Microscopy (SEM). Saws: Y 1 Wires: Y 2 Belts: Y 3 None: Y 4 Y 1 + Y 2 + Y 3 + Y 4 = 180. • Thermal evaporation process in a single-zone horizontal tube furnace. • Several substrates can be placed simultaneously. • Three most important variables: – Source temperature (T) – Pressure (P) – Distance (D) of the substrate from the source 15

Experimental Design • Joint work with material scientist Z. L. Wang and his lab at GT (JASA, PNAS, Nano): NSF stat-materials 16

Nanostructure Yield Many experiments did not produce any nanostructures. 17

Research Questions on Yield Optimization • How to place the design points in the good yield regions? • How to avoid the no-yield regions? • Our final product is a method called “smed”, but the process is a roller-coaster . Final version of the work smed (Joseph, Dasgupta, Tuo, Wu, Technometrics, 2015) 18
 • Physical connection: treat design points as positively charged")
Sequential Minimum Energy Designs (SMED) • Physical connection: treat design points as positively charged particles. Pressure Charge inversely proportional to yield, e. g. , q = 1 -yield Y=0 q 2 = 1. 0 E = Kq 1 q 2 / d Y = 40% q 1 = 0. 6 19

What Position Will a Newly Introduced Particle Occupy? Pressure d! e iz al i t n l ta o T rgy e n ! q 2 = 1. 0 nim i M E te o P q 1 = 0. 6 20

SMED Algorithm for Optimization • 21

Bad News! • In the simulation studies, smed is often beaten by a well known method called the EI (expected improvement) Algorithm (Jones, Schonlau, Welch, 1998). EI is popular in global optimization and computer experiments. • Attempts to find better examples fail. Paper had no where to go. Several years of frustration . • Finally Roshan Joseph’s brilliant idea: change the objective from optimization to distribution mimicking. 22

MED: Two Fixed-sample Versions • 23

Special Cases: Maximin Distance Designs • 24

A Greedy Algorithm for MED 26

Asymptotic Convergence Results • 26

Application to Simulations from Complex Densities • 27

An Example 28

Quasi-Monte Carlo • 50 -point Sobol’ sequence 29

Application of SMED 30

Sensitivity testing • 31

Quantile estimation in quantal response curve • 32

Some existing procedures • 33

Logit-MLE procedure • 34

D-optimality based procedure • 35

Challenges • For this problem with a long history, is there a consensus on best procedure? No! Why? • Up-and-down for its simplicity appeal is still misused by less sophisticated users; Neyer has lately become popular among well informed users; some military in -house procedure like Langlie (1962) has been used but is ad hoc, has no good theoretical justification, etc. • There is a still room for improvement; thus our work Wu-Tian (2014, JSPI with discussions). 36

Three-phase optimal design • 37

Trapped in separation? • X X X 38

I 2: stage 2 of phase I • 39

: y=1 : y=0 40

Evolution of Ideas, Other Remarks • Data overlapping is the common thread linking all three papers. Wu (85, JASA) saw it but did not recognize its importance, Neyer (89, Tech) used it in the design, Wu-Tian (14, JSPI) further improved the binary search and added stoch approx as step 3. • No standard design techniques apply here because data need to be used to “range” (location-scale) the unknown distribution and then quickly converge to the desired quantile. • In a recent comprehensive simulation study, 3 pod and Neyer’s D-optimal beat all other procedures. D-opt is better if underlying distribution is normal or near normal; 3 -pod is better otherwise and thus is more robust to distributional assumptions. 41

A Path to Innovation: read-understand-imitate-pause-breakout • Read/understand: strong background; requires hard work • Imitate: analyze pros/cons of an existing approach; logical • Pause: sit back, let it sink in, have a cup of tea or a walk, connecting the dots; no more reading • Breakout: see the “contradictions”(矛盾) in an approach, go philosophical; be brave • Innovate: in the DNAs(? ), spurred by frustration or rejection of paper ; inspirational 42

Some General Remarks • Find a journal that is a good outlet and can appreciates your work • Escape from the Big Four Syndrome (Ann, Bmka, JASA, JRSSB) • Focus on quality; refuse to count # of papers or even impact factors • (for junior researchers) Do not take grants/projects just for money • Worry less about career or short term gains (i. e. , minor editorial appointments or awards) • General advice: more inspiration, less ambition 43

Numerical Study • 44
- Slides: 44