Fiscal Policy SSEMA 3 Explain How the Government


 $4, 500 Income")
 through 2015 $4, 500 $4, 000")


 and List of Expenses")

 received exceeds the")


- Slides: 28
Fiscal Policy
SSEMA 3: Explain How the Government uses Fiscal Policy to promote price stability, full employment, and economic Growth Goal: For you to be able to explain how Congress and the President work together to achieve the Three goal of Macro Econ. For you to be able to explain how the government responds to the different stages of the business cycle.
SSEMA 3. a Define Fiscal Policy
Fiscal Policy The federal government’s decisions it makes about taxing and spending in order to promote economic growth and stability
Any form of money the gov’t takes in or spend falls under the fiscal policy umbrella How does the Government Spend money? How does the Government take in money?
SSEMA 3. b Explain the effect on the economy of the government’s taxing and spending decisions in promoting price stability. Full employment, and economic growth
Taxing & Spending Decisions
Taxes- Revenue the government creates from individuals’ working wages.
Government Spending
Government Spending – Did You Know? Federal Government Current Expenditures ($billions, nominal annual values for years shown) $4, 000 Spending • Like households and firms, the federal government is also a consumer of goods and services $3, 487 $3, 500 $3, 000 $2, 500 $1, 839 $2, 000 Facts • The BEA reports nominal values of federal government expenditures on an annual and quarterly basis • The measure of government spending shown to the right is part of NIPA (National Income and Product Accounts) Table 3. 16, which is published by the Bureau of Economic Analysis (BEA) $1, 500 $1, 000 $532 $1, 199 $500 $0 1980 1990 2000 2010 Source: Bureau of Economic Analysis Relationship • The sheer size of federal government spending makes government expenditures a major component of U. S. gross domestic product (GDP) Note: See Power. Point file for references Data. Post Nominal government spending has grown over time. Its value in 2000 was more than triple that in 1980. www. frbsf. org/education/teacher-resources/datapost FRBSF Education & Outreach
Government Spending by Function 2005 vs. 2015 ($billions, nominal annual values) $4, 500 Income Security $4, 000 $3, 500 $1, 344 Health Together, income security and national defense account for almost 50% of all federal spending. National Defense $3, 000 $2, 500 $816 $1, 163 $2, 000 $593 Other $477 $1, 000 $423 $132 $500 $542 $152 $107 $122 $67 Nominal spending on health increased 93% between 2005 and 2015. Education $602 $1, 500 General Public Service Economic Affairs Overall, nominal federal spending increased 54% between 2005 and 2015. $91 $0 2005 2015 Source: Bureau of Economic Analysis Data. Post www. frbsf. org/education/teacher-resources/datapost FRBSF Education & Outreach
Federal Government Current Expenditures Nominal annual values ($billions) through 2015 $4, 500 $4, 000 $3, 500 $3, 000 $2, 500 $2, 000 $1, 500 $1, 000 $500 $0 1955 1960 1965 1970 1975 1980 1985 1990 1995 2000 2005 2010 2015 Source: Bureau of Economic Analysis Data. Post www. frbsf. org/education/teacher-resources/datapost FRBSF Education & Outreach
What Do You Think? 1. In general, how did spending on education in 2005 compare to 2015? (See slide 3) 2. What was total government spending in 2005? In 2015? (See slide 3) 3. What percentage of federal spending went to education in 2005? In 2015? (See slide 3) 4. What was the largest category of government spending in 2005? In 2015? (See slide 3) Data. Post www. frbsf. org/education/teacher-resources/datapost FRBSF Education & Outreach
When does the gov’t spend money?
Increasing Price Level Contractionary Fiscal Policy Curb Inflation 1. Lower government spending 2. Increase Taxes These policies take money out of the economy. Fewer Firms earning money from the Gov’t contracts Lowers Consumption & Investment spending Eventually reducing inflation
Promoting Full Employment & Economic Growth when Price Level is not a concern. The government uses tools designed to increase consumption and investment spending in an economy. Lowering taxes allows people to keep more of their income for spending on goods and service Increasing Government spending, more firms and workers can earn money from government contracts and jobs Household spend some of this additional income on goods and services, increasing economic activity.
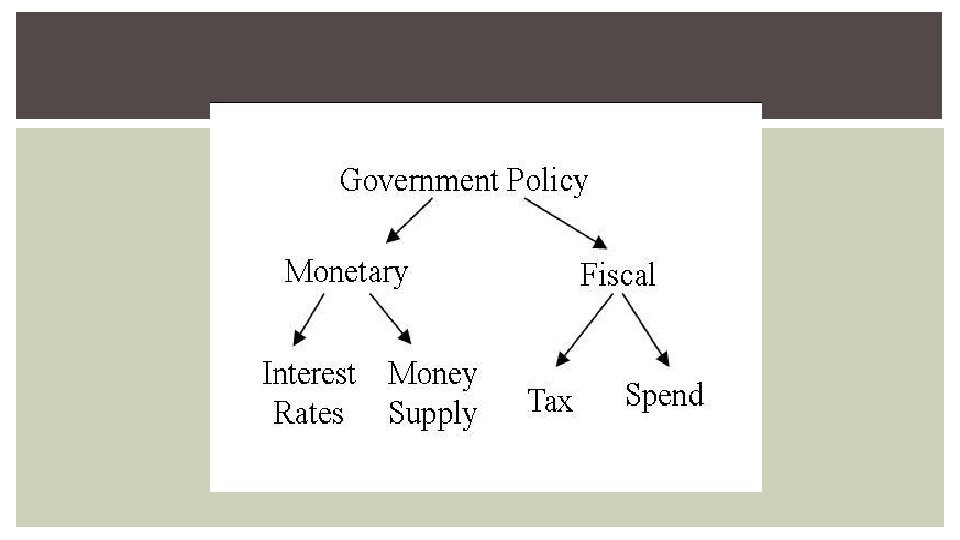
TOGETHER: MONETARY AND FISCAL POLICY TOGETHER The Federal Reserve and Congress Both want to correct the economy the best combination in achieving this goal is through increasing government spending, sell treasure bonds, but taxes, and buy treasury bonds.
SSEMA 3. C Explain how government budget Deficits or surpluses impact national Debt
Budget Includes sources of income (Taxes & Fees) and List of Expenses
Expenses Include all the public goods and services provided by the government as well as the interest payments the government pay on its debt Total amount of Income – (Minus) the total number of expenses
Government Surplus Exist when the amount of income (Taxes and Fees) received exceeds the amount of expenses paid.
Government Deficit Exist when the amount of income received falls short of the amount of expenses paid.
National Debt Each time the government borrows money it adds to the national debt, the total amount of money owed by the federal government. Is the sum of all past deficits plus interest.
Deficit Spending Occurs when the government spends more money than it collects in revenue. To finance spending, governments often borrow money by selling bonds.
Debt Clock http: //www. usdebtclock. org/
https: //www. econedlink. org/tool/199/Budget-Deficits-Public-Debt-Video-Quiz
How does Monetary and Fiscal policy work together to achieve a sound Economy?