Fama Freedom 3 Factor Model Scott Gavlick Todd
- Slides: 14
Fama & Freedom 3½ Factor Model Scott Gavlick Todd Hoskin Edward Kim
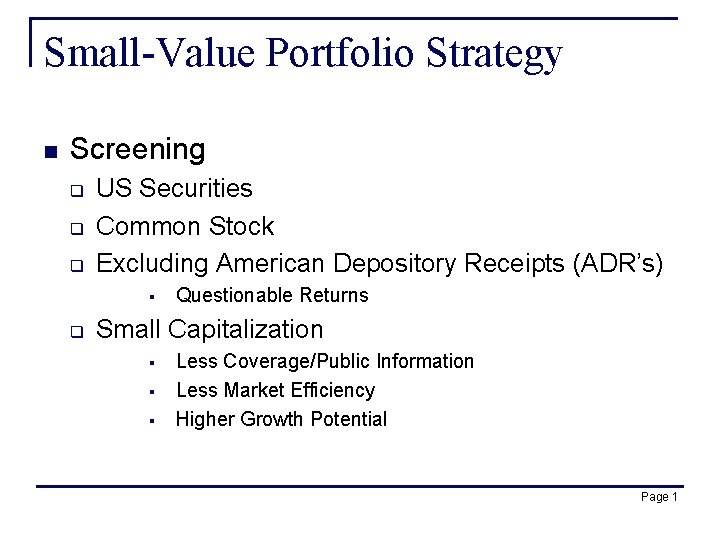
Small-Value Portfolio Strategy n Screening q q q US Securities Common Stock Excluding American Depository Receipts (ADR’s) § q Questionable Returns Small Capitalization § § § Less Coverage/Public Information Less Market Efficiency Higher Growth Potential Page 1
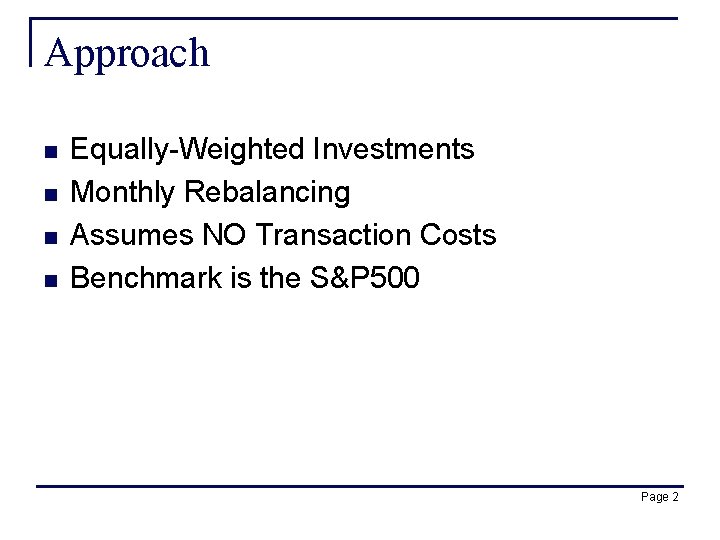
Approach n n Equally-Weighted Investments Monthly Rebalancing Assumes NO Transaction Costs Benchmark is the S&P 500 Page 2
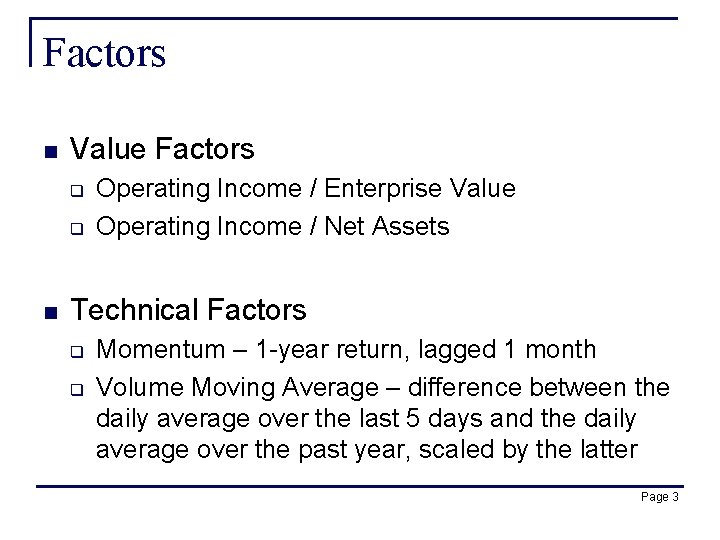
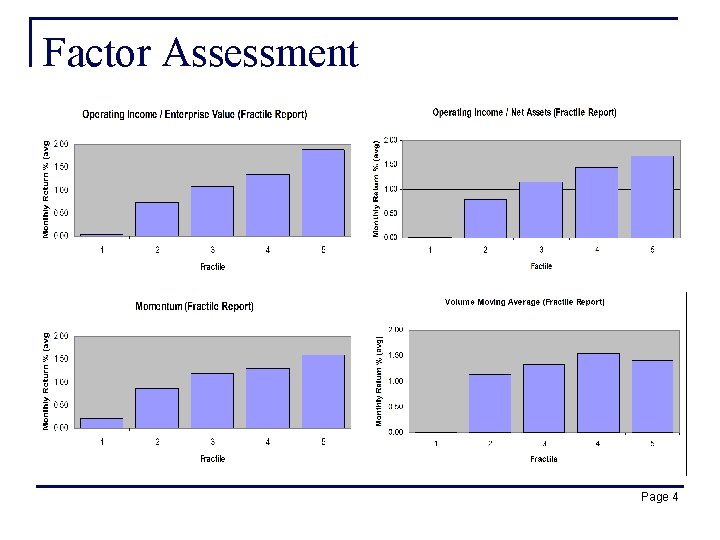
Factors n Value Factors q q n Operating Income / Enterprise Value Operating Income / Net Assets Technical Factors q q Momentum – 1 -year return, lagged 1 month Volume Moving Average – difference between the daily average over the last 5 days and the daily average over the past year, scaled by the latter Page 3
Factor Assessment Page 4
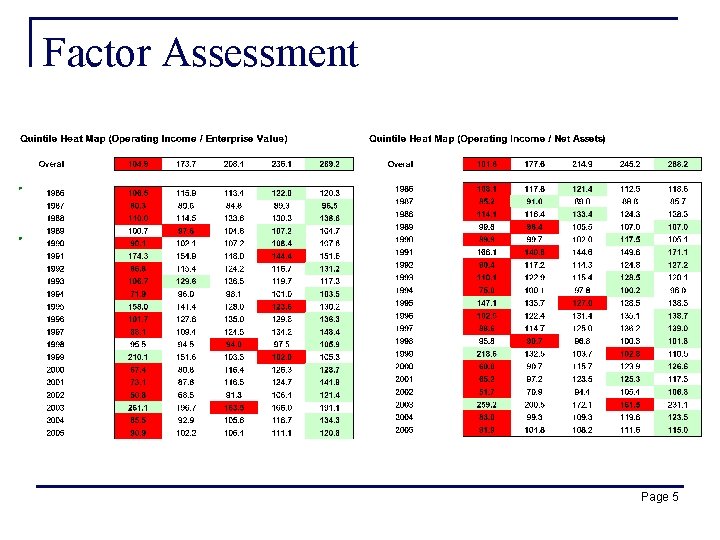
Factor Assessment Page 5
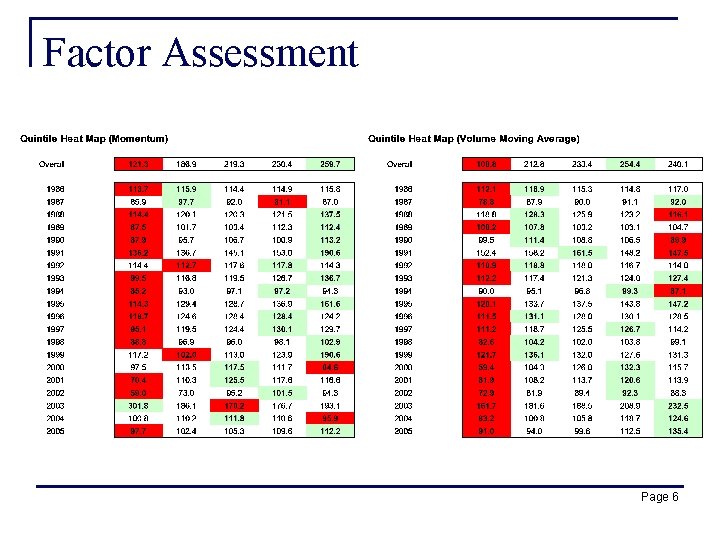
Factor Assessment Page 6
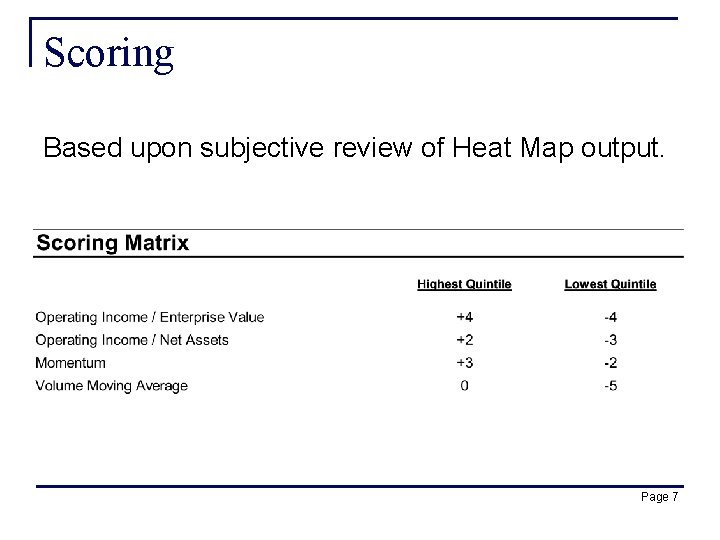
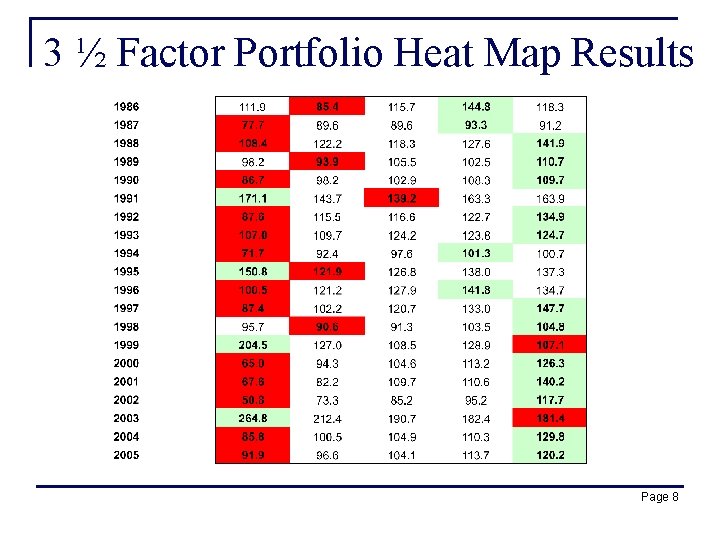
Scoring Based upon subjective review of Heat Map output. Page 7
3 ½ Factor Portfolio Heat Map Results Page 8
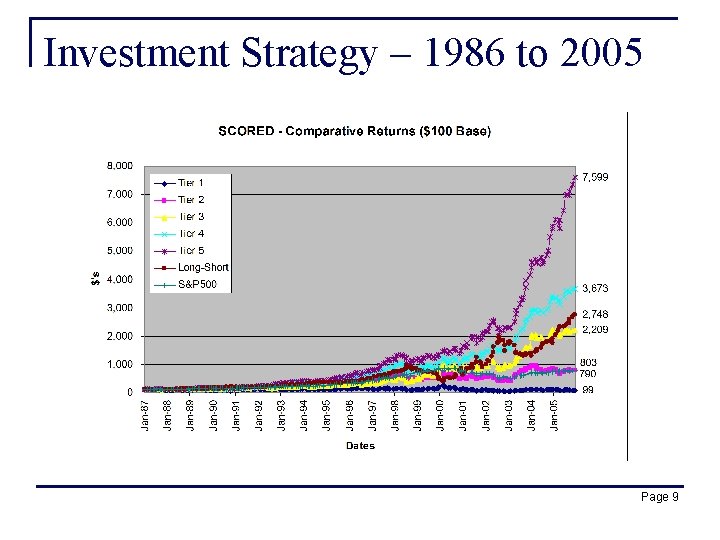
Investment Strategy – 1986 to 2005 Page 9
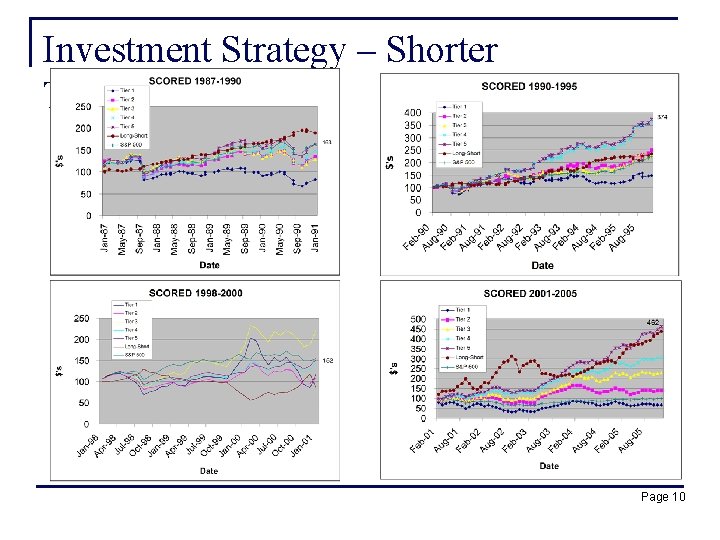
Investment Strategy – Shorter Timeframes Page 10
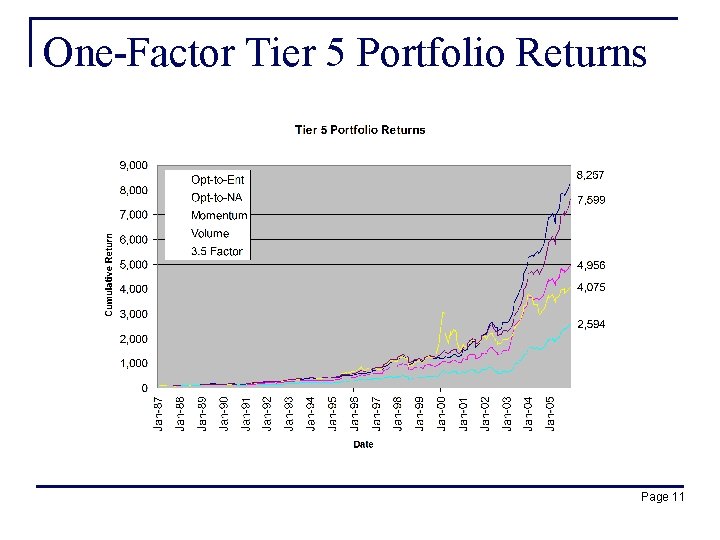
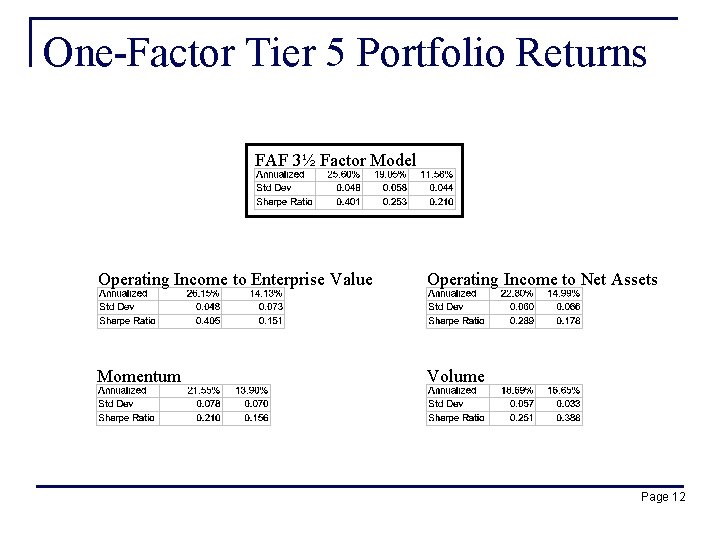
One-Factor Tier 5 Portfolio Returns Page 11
One-Factor Tier 5 Portfolio Returns FAF 3½ Factor Model Operating Income to Enterprise Value Operating Income to Net Assets Momentum Volume Page 12
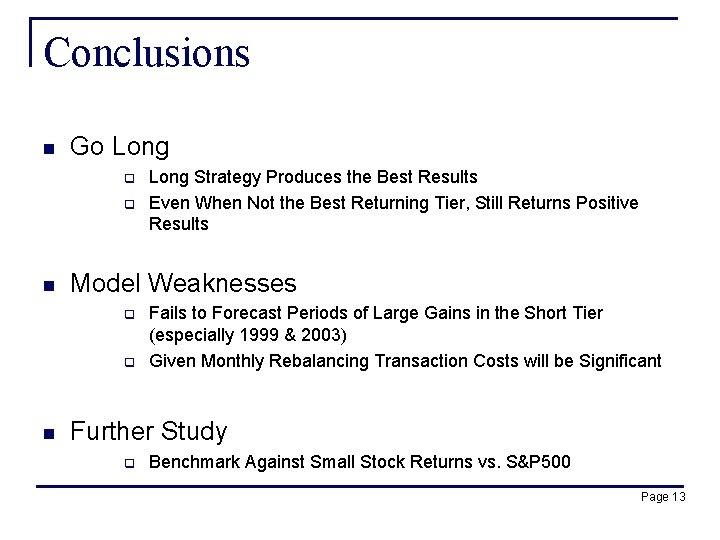
Conclusions n Go Long q q n Model Weaknesses q q n Long Strategy Produces the Best Results Even When Not the Best Returning Tier, Still Returns Positive Results Fails to Forecast Periods of Large Gains in the Short Tier (especially 1999 & 2003) Given Monthly Rebalancing Transaction Costs will be Significant Further Study q Benchmark Against Small Stock Returns vs. S&P 500 Page 13