Examples of Micropayments Data James Mc Andrews Federal


")


 Value and Volume. 2) Federal Reserve Policies")


- Slides: 22
Examples of Micropayments Data James Mc. Andrews Federal Reserve Bank of New York 2008 World Congress on National Accounts and Economic Performance Measures for Nations May 13, 2008 The views expressed in this paper are those of the authors and do not necessarily represent the views of the Federal Reserve Bank of New York or of the Federal Reserve System.
Payment Data Central banks are usually operators of the large-value payment system. Many important economic policy questions are involved, related to efficiency, risk, and equity.
Payment Data In recent years, central bank economists have begun collecting disaggregated data on payment activity. • Summary reports. • Hypothesis tests.
Payment Data In this presentation, I’ll show two examples of using micropayments data using the Federal Reserve’s large-value payment system, Fedwire.
Changes in the Timing Distribution of Fedwire Funds Transfers, Armantier, Arnold, Mc. Andrews (2008) Payment Timing A large literature has examined the economics of payment timing: Theory: Angelini (1999, 2000) Bech and Garratt (2003) Kahn, Mc. Andrews, Roberds (2003) Mills and Nesmith (2007) Bech (2007) Empirical work Mc. Andrews and Rajan (2000) Becher, Galbiati, and Tudela (2007)
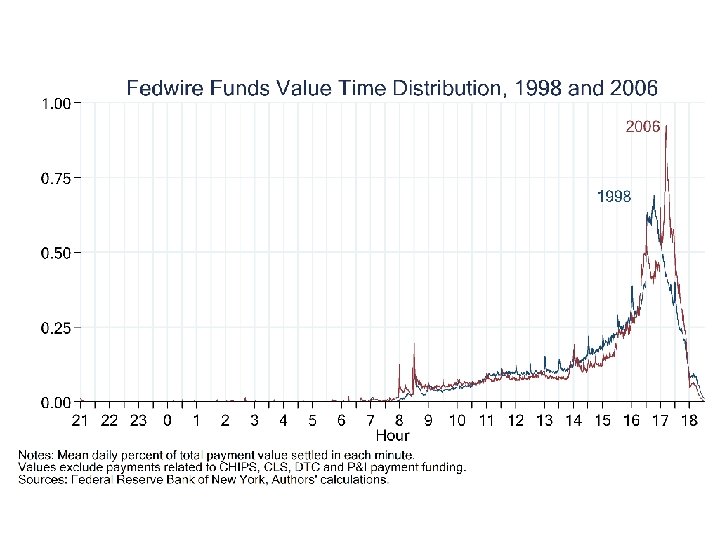
Five stylized changes in the Fedwire Funds value time distribution 1998 to 2006 1. The distribution of value settled became more concentrated and less variable. 2. The highest peak of activity is later. 3. Three distinct peaks, 16: 30, 17: 00, and the third (the sharpest) at 17: 11. 4. The 1998 distribution exhibits regular clock effects which virtually disappear in 2002. 5. The 2006 distribution shows higher activity at 08: 00 and 08: 30, and the 08: 00 peak is only present in 2006.
Evolution of the value time distribution
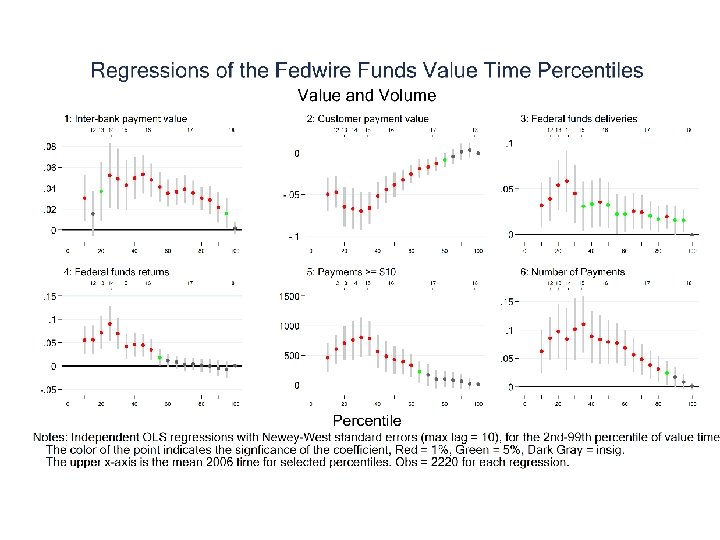
These shifts in the value time distribution are statistically significant
Estimation strategy: reduced form regressions, one OLS regression percentile • Reduced-form equation characterizing equilibria of coordination game. • 100 independent OLS regressions • 2220 observations: business days between March 1998 and December 2006. • Same set of independent variables in each regression.
Variables are grouped into 5 categories 1) Value and Volume. 2) Federal Reserve Policies and Operations. 3) Settlement System Activities. 4) Other Control Variables. 5) Calendar Effects.
The role of settlement institutions on Fedwire Funds payment timing
Discussion Why should Fedwire value move with CHIPS timing? Four hypotheses: • Liquidity cascade • Customer credit cascade • Resolution of uncertainty • Focal point
Economic significance: Factors influencing the 1998 – 2006 change in the 75 th Percentile We “subtract out” the time trend, and ask how much can different variables explain of the later settlement. • Volume and value— 40 percent • Changes in CHIPS— 30 -20=10 percent • Increase in concentration— 40 percent
Conclusions Our results tend to support that the provision of liquidity, settlement institution activity, volume and value transferred, and industry structure all influential in explaining changes in the timing of payment on Fedwire.
Segmentation in the U. S. Money Market: Fed funds and Eurodollars Mc. Andrews, in progress
Close-up of Eurodollar-Fed funds interest rate spread in recent period
Values traded in the market segments
Values traded in the market segments: close-up of recent period
Predicted spreads from an EGARCH estimation 2002 -2004 8/2007 – 4/2008
Payments data The studies examined are examples of work that seeks to test hypotheses with appropriate microdata about a previously unexamined part of the financial system. Protocols need to be established to share these data with researchers outside of central banks.