EXAMPLE 1 Making a StemandLeaf Plot Speeds of

- Slides: 12
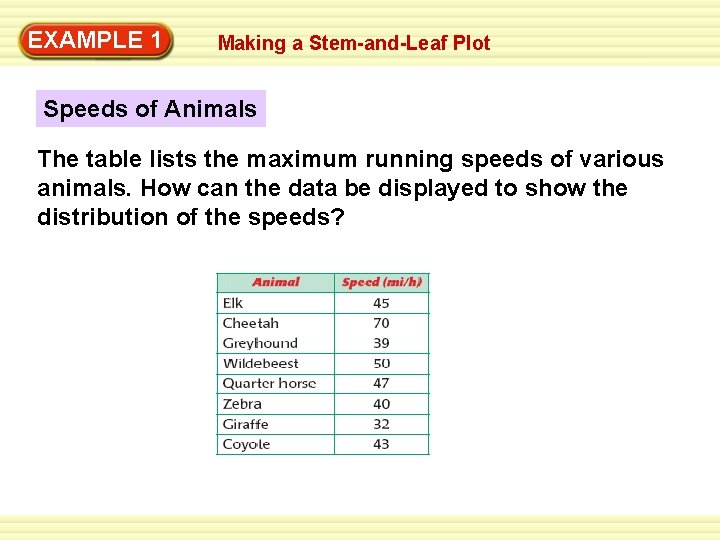
EXAMPLE 1 Making a Stem-and-Leaf Plot Speeds of Animals The table lists the maximum running speeds of various animals. How can the data be displayed to show the distribution of the speeds?
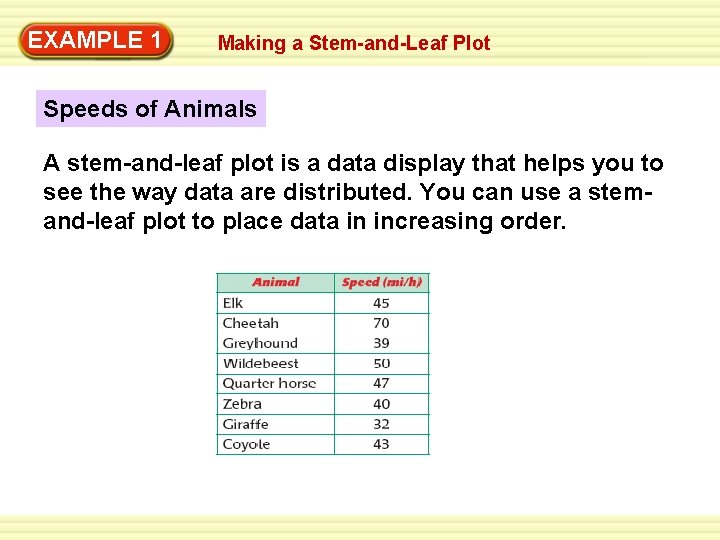
EXAMPLE 1 Making a Stem-and-Leaf Plot Speeds of Animals A stem-and-leaf plot is a data display that helps you to see the way data are distributed. You can use a stemand-leaf plot to place data in increasing order.
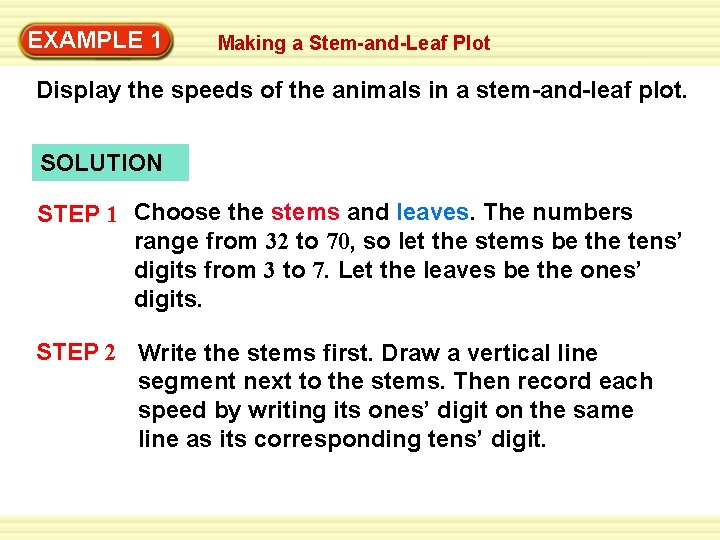
EXAMPLE 1 Making a Stem-and-Leaf Plot Display the speeds of the animals in a stem-and-leaf plot. SOLUTION STEP 1 Choose the stems and leaves. The numbers range from 32 to 70, so let the stems be the tens’ digits from 3 to 7. Let the leaves be the ones’ digits. STEP 2 Write the stems first. Draw a vertical line segment next to the stems. Then record each speed by writing its ones’ digit on the same line as its corresponding tens’ digit.
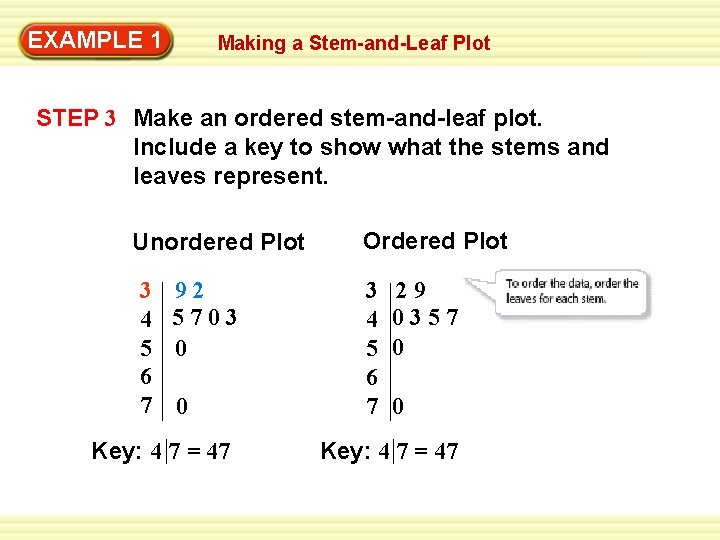
EXAMPLE 1 Making a Stem-and-Leaf Plot STEP 3 Make an ordered stem-and-leaf plot. Include a key to show what the stems and leaves represent. Unordered Plot 3 92 4 5703 5 0 6 7 0 Key: 4 7 = 47 Ordered Plot 3 4 5 6 7 29 0357 0 0 Key: 4 7 = 47
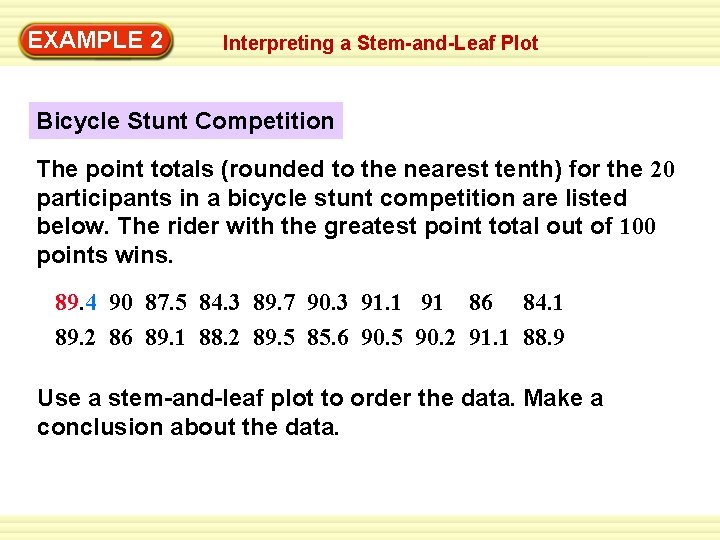
EXAMPLE 2 Interpreting a Stem-and-Leaf Plot Bicycle Stunt Competition The point totals (rounded to the nearest tenth) for the 20 participants in a bicycle stunt competition are listed below. The rider with the greatest point total out of 100 points wins. 89. 4 90 87. 5 84. 3 89. 7 90. 3 91. 1 91 86 84. 1 89. 2 86 89. 1 88. 2 89. 5 85. 6 90. 5 90. 2 91. 1 88. 9 Use a stem-and-leaf plot to order the data. Make a conclusion about the data.
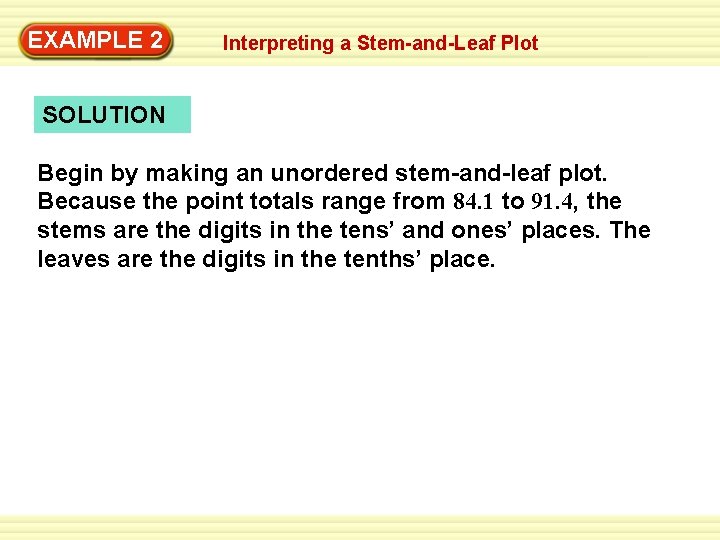
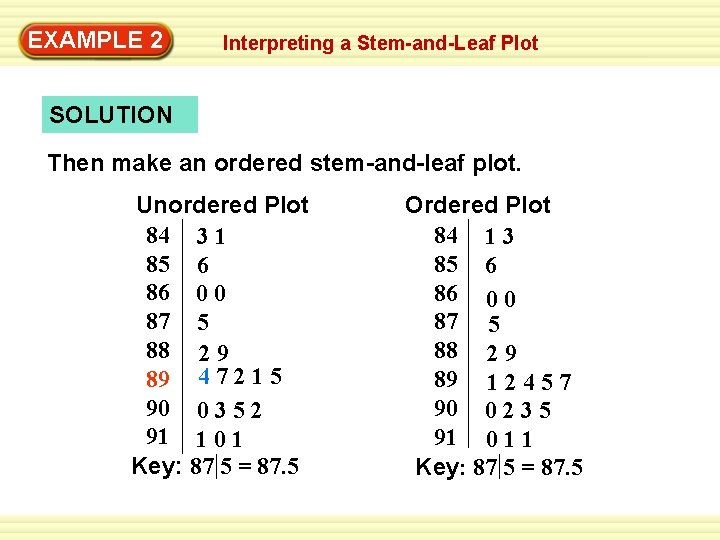
EXAMPLE 2 Interpreting a Stem-and-Leaf Plot SOLUTION Begin by making an unordered stem-and-leaf plot. Because the point totals range from 84. 1 to 91. 4, the stems are the digits in the tens’ and ones’ places. The leaves are the digits in the tenths’ place.
EXAMPLE 2 Interpreting a Stem-and-Leaf Plot SOLUTION Then make an ordered stem-and-leaf plot. Unordered Plot 84 3 1 85 6 86 0 0 87 5 88 2 9 89 4 7 2 1 5 90 0 3 5 2 91 1 0 1 Key: 87 5 = 87. 5 Ordered Plot 84 1 3 85 6 86 0 0 87 5 88 2 9 89 1 2 4 5 7 90 0 2 3 5 91 0 1 1 Key: 87 5 = 87. 5
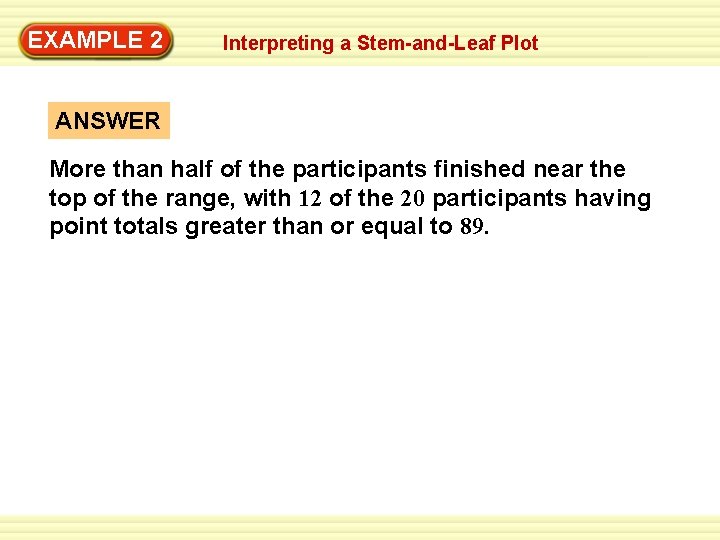
EXAMPLE 2 Interpreting a Stem-and-Leaf Plot ANSWER More than half of the participants finished near the top of the range, with 12 of the 20 participants having point totals greater than or equal to 89.
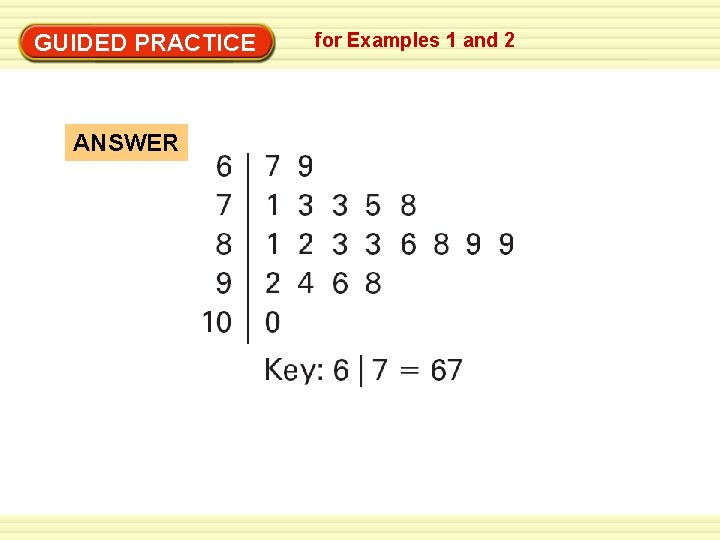
GUIDED PRACTICE for Examples 1 and 2 Test Scores 1. The test scores for the students in a social studies class are listed below. Make an ordered stem-and-leaf plot of the scores. 92 78 73 89 98 89 83 75 83 100 69 71 96 67 81 73 88 86 82 94
GUIDED PRACTICE ANSWER for Examples 1 and 2
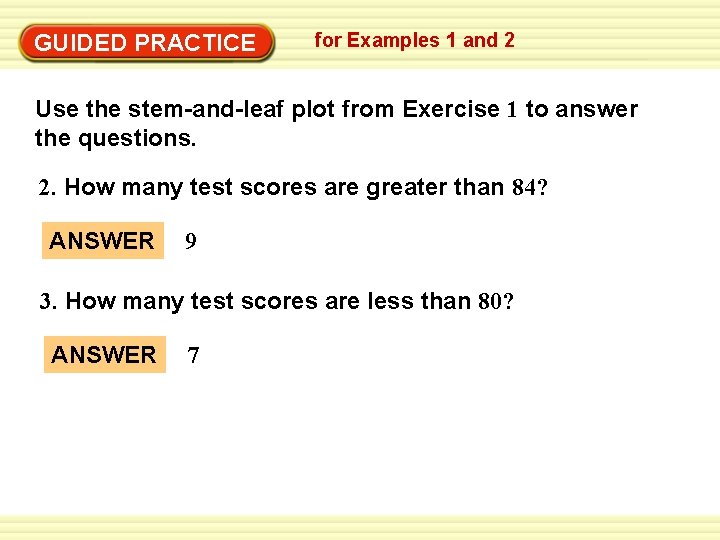
GUIDED PRACTICE for Examples 1 and 2 Use the stem-and-leaf plot from Exercise 1 to answer the questions. 2. How many test scores are greater than 84? ANSWER 9 3. How many test scores are less than 80? ANSWER 7
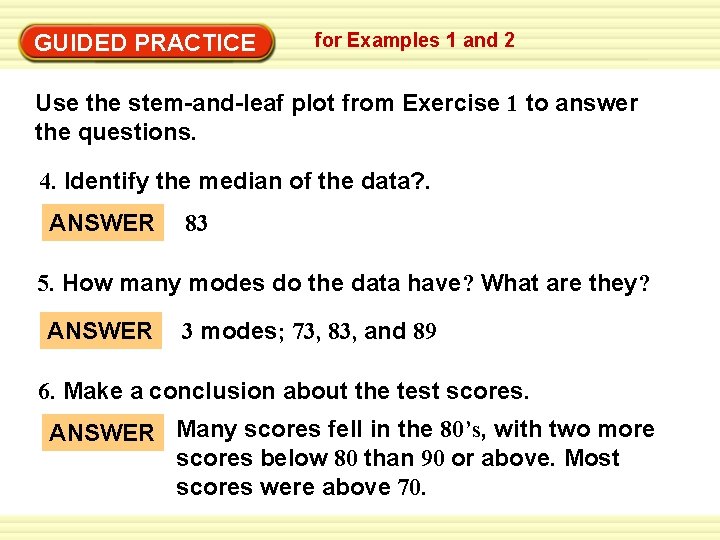
GUIDED PRACTICE for Examples 1 and 2 Use the stem-and-leaf plot from Exercise 1 to answer the questions. 4. Identify the median of the data? . ANSWER 83 5. How many modes do the data have? What are they? ANSWER 3 modes; 73, 83, and 89 6. Make a conclusion about the test scores. ANSWER Many scores fell in the 80’s, with two more scores below 80 than 90 or above. Most scores were above 70.