Evaluating Financial Health of Real Estate Construction Industry


- Slides: 17
Evaluating Financial Health of Real Estate & Construction Industry In India CHETNA BATRA 04 November 2020 1
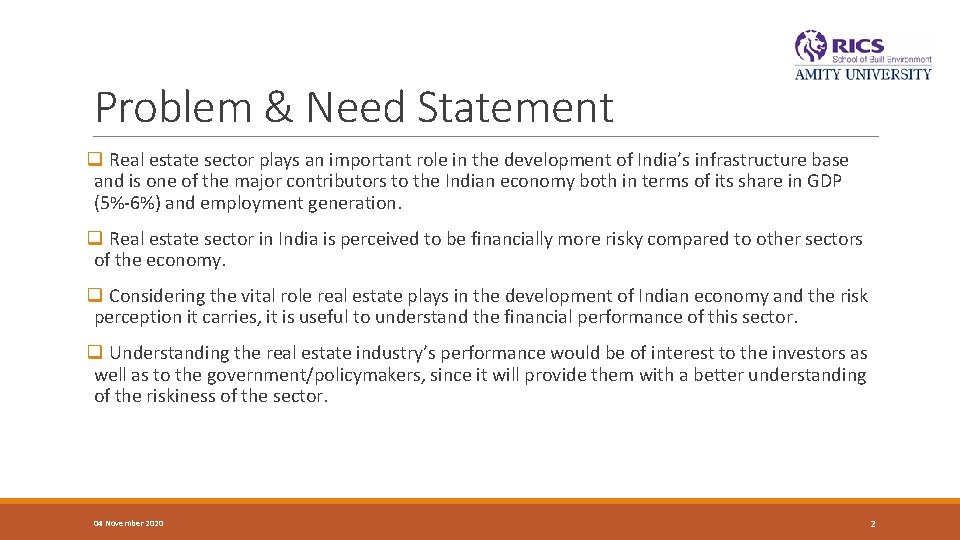
Problem & Need Statement q Real estate sector plays an important role in the development of India’s infrastructure base and is one of the major contributors to the Indian economy both in terms of its share in GDP (5%-6%) and employment generation. q Real estate sector in India is perceived to be financially more risky compared to other sectors of the economy. q Considering the vital role real estate plays in the development of Indian economy and the risk perception it carries, it is useful to understand the financial performance of this sector. q Understanding the real estate industry’s performance would be of interest to the investors as well as to the government/policymakers, since it will provide them with a better understanding of the riskiness of the sector. 04 November 2020 2
Purpose of Research The study proposes to: To examine the financial performance of the Indian real estate industry 04 November 2020 3
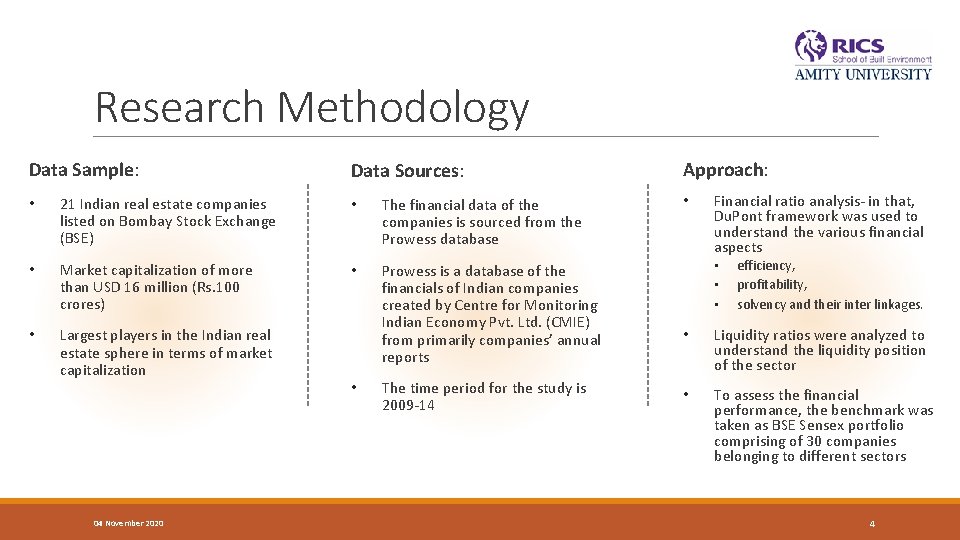
Research Methodology Data Sample: Data Sources: • 21 Indian real estate companies listed on Bombay Stock Exchange (BSE) • The financial data of the companies is sourced from the Prowess database • Market capitalization of more than USD 16 million (Rs. 100 crores) • • Largest players in the Indian real estate sphere in terms of market capitalization Prowess is a database of the financials of Indian companies created by Centre for Monitoring Indian Economy Pvt. Ltd. (CMIE) from primarily companies’ annual reports 04 November 2020 • The time period for the study is 2009 -14 Approach: • Financial ratio analysis- in that, Du. Pont framework was used to understand the various financial aspects • • • efficiency, profitability, solvency and their inter linkages. • Liquidity ratios were analyzed to understand the liquidity position of the sector • To assess the financial performance, the benchmark was taken as BSE Sensex portfolio comprising of 30 companies belonging to different sectors 4
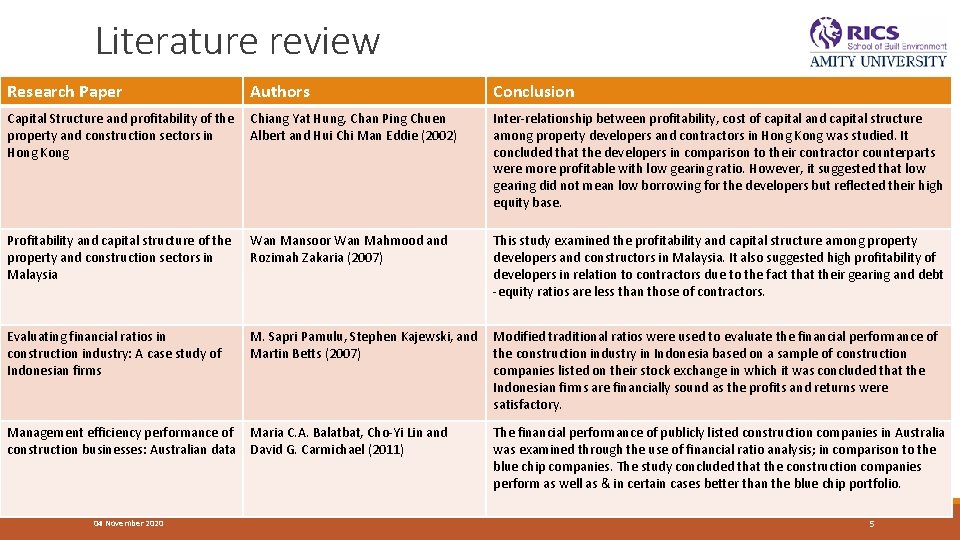
Literature review Research Paper Authors Conclusion Capital Structure and profitability of the Chiang Yat Hung, Chan Ping Chuen property and construction sectors in Albert and Hui Chi Man Eddie (2002) Hong Kong Inter-relationship between profitability, cost of capital and capital structure among property developers and contractors in Hong Kong was studied. It concluded that the developers in comparison to their contractor counterparts were more profitable with low gearing ratio. However, it suggested that low gearing did not mean low borrowing for the developers but reflected their high equity base. Profitability and capital structure of the property and construction sectors in Malaysia Wan Mansoor Wan Mahmood and Rozimah Zakaria (2007) This study examined the profitability and capital structure among property developers and constructors in Malaysia. It also suggested high profitability of developers in relation to contractors due to the fact that their gearing and debt -equity ratios are less than those of contractors. Evaluating financial ratios in construction industry: A case study of Indonesian firms M. Sapri Pamulu, Stephen Kajewski, and Modified traditional ratios were used to evaluate the financial performance of Martin Betts (2007) the construction industry in Indonesia based on a sample of construction companies listed on their stock exchange in which it was concluded that the Indonesian firms are financially sound as the profits and returns were satisfactory. Management efficiency performance of construction businesses: Australian data Maria C. A. Balatbat, Cho-Yi Lin and David G. Carmichael (2011) 04 November 2020 The financial performance of publicly listed construction companies in Australia was examined through the use of financial ratio analysis; in comparison to the blue chip companies. The study concluded that the construction companies perform as well as & in certain cases better than the blue chip portfolio. 5
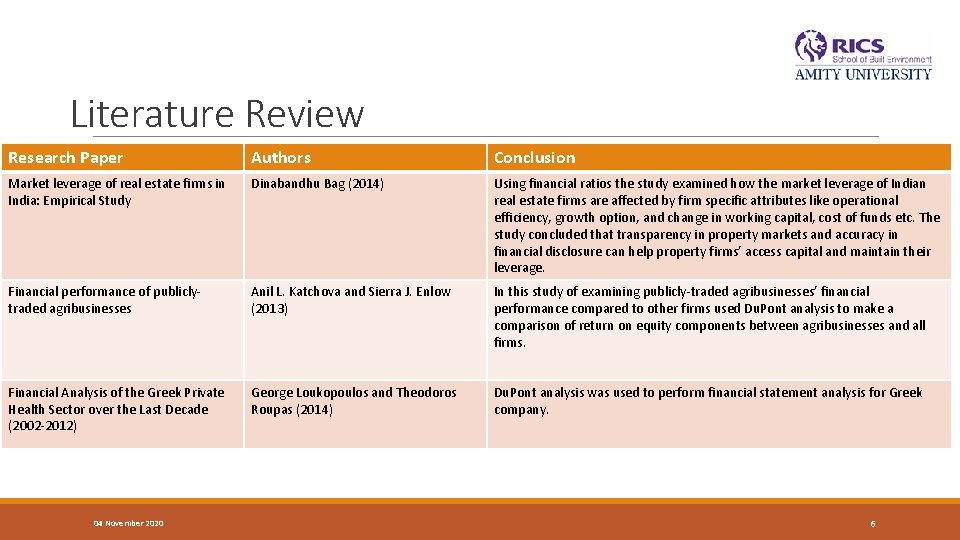
Literature Review Research Paper Authors Conclusion Market leverage of real estate firms in India: Empirical Study Dinabandhu Bag (2014) Using financial ratios the study examined how the market leverage of Indian real estate firms are affected by firm specific attributes like operational efficiency, growth option, and change in working capital, cost of funds etc. The study concluded that transparency in property markets and accuracy in financial disclosure can help property firms’ access capital and maintain their leverage. Financial performance of publiclytraded agribusinesses Anil L. Katchova and Sierra J. Enlow (2013) In this study of examining publicly-traded agribusinesses’ financial performance compared to other firms used Du. Pont analysis to make a comparison of return on equity components between agribusinesses and all firms. Financial Analysis of the Greek Private Health Sector over the Last Decade (2002 -2012) George Loukopoulos and Theodoros Roupas (2014) Du. Pont analysis was used to perform financial statement analysis for Greek company. 04 November 2020 6
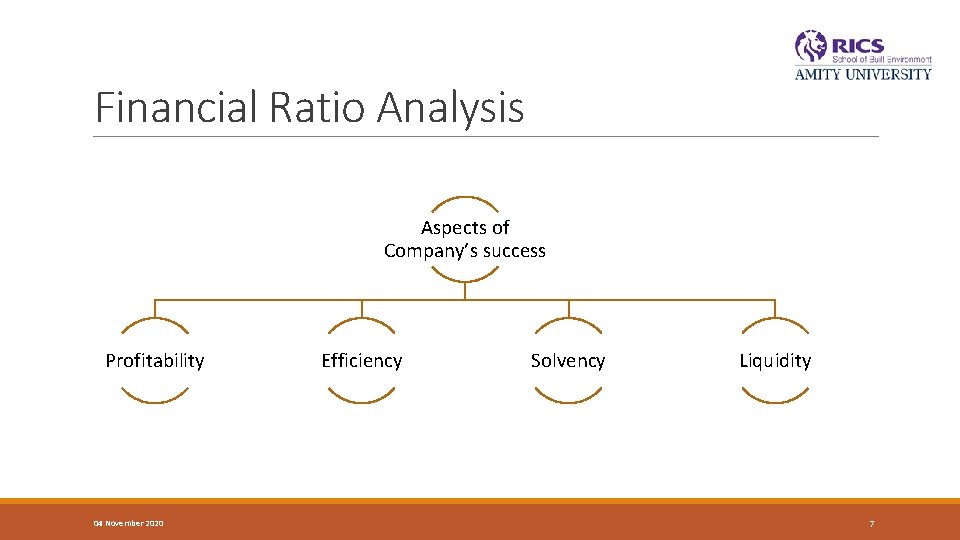
Financial Ratio Analysis Aspects of Company’s success Profitability 04 November 2020 Efficiency Solvency Liquidity 7
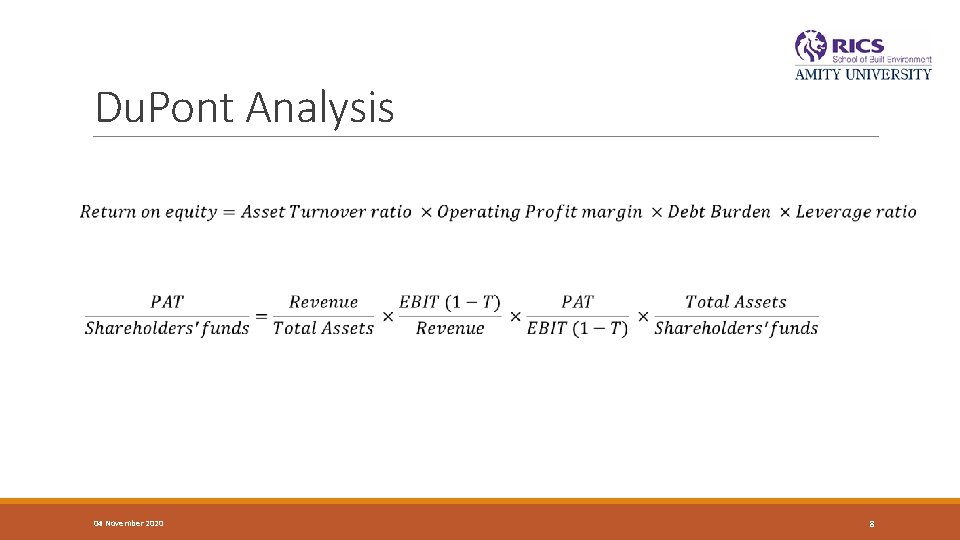
Du. Pont Analysis 04 November 2020 8
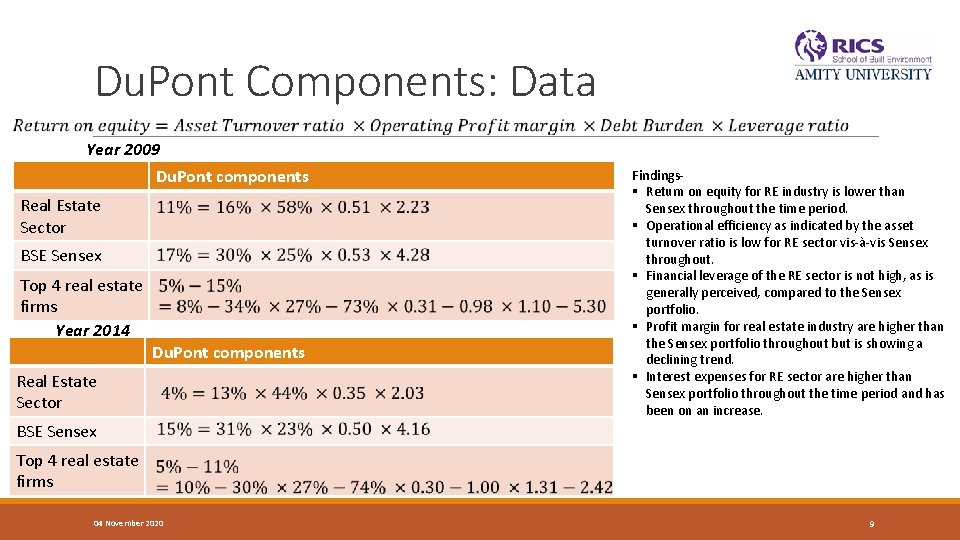
Du. Pont Components: Data Year 2009 Du. Pont components Real Estate Sector BSE Sensex Top 4 real estate firms Year 2014 Du. Pont components Real Estate Sector BSE Sensex Top 4 real estate firms 04 November 2020 Findings§ Return on equity for RE industry is lower than Sensex throughout the time period. § Operational efficiency as indicated by the asset turnover ratio is low for RE sector vis-à-vis Sensex throughout. § Financial leverage of the RE sector is not high, as is generally perceived, compared to the Sensex portfolio. § Profit margin for real estate industry are higher than the Sensex portfolio throughout but is showing a declining trend. § Interest expenses for RE sector are higher than Sensex portfolio throughout the time period and has been on an increase. 9
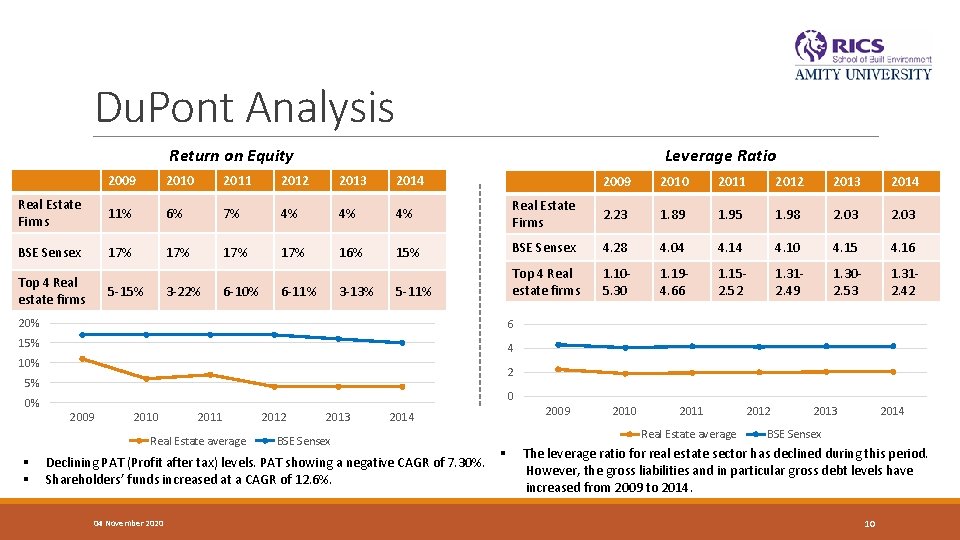
Du. Pont Analysis Leverage Ratio Return on Equity 2009 2010 2011 2012 2013 2014 Real Estate Firms 11% 6% 7% 4% 4% 4% BSE Sensex 17% 17% 16% Top 4 Real estate firms 5 -15% 3 -22% 6 -10% 6 -11% 3 -13% 2009 2010 2011 2012 2013 2014 Real Estate Firms 2. 23 1. 89 1. 95 1. 98 2. 03 15% BSE Sensex 4. 28 4. 04 4. 10 4. 15 4. 16 5 -11% Top 4 Real estate firms 1. 105. 30 1. 194. 66 1. 152. 52 1. 312. 49 1. 302. 53 1. 312. 42 20% 6 15% 4 10% 2 5% 0 0% 2009 2010 2011 Real Estate average § § 2012 2013 2014 BSE Sensex Declining PAT (Profit after tax) levels. PAT showing a negative CAGR of 7. 30%. Shareholders’ funds increased at a CAGR of 12. 6%. 04 November 2020 2009 2010 2011 Real Estate average 2012 2013 2014 BSE Sensex § The leverage ratio for real estate sector has declined during this period. However, the gross liabilities and in particular gross debt levels have increased from 2009 to 2014. 10
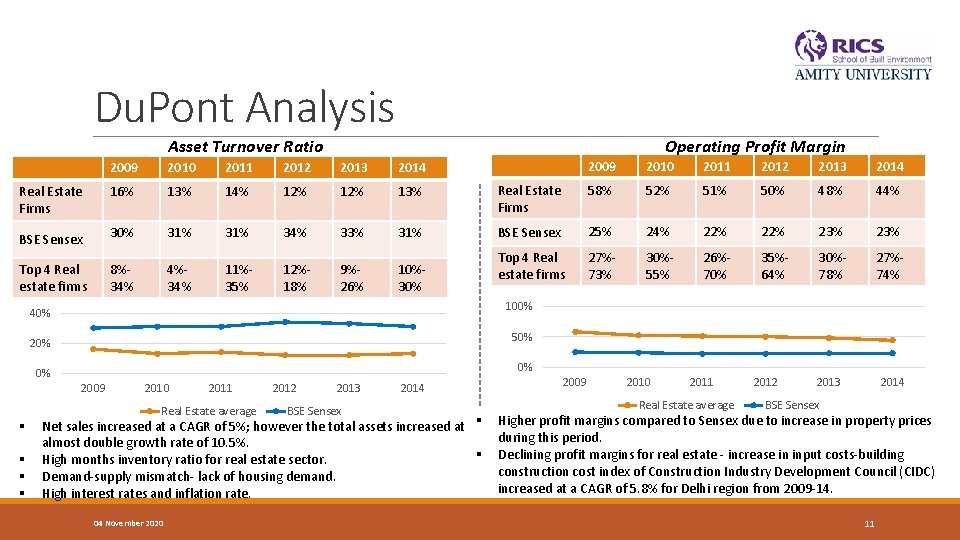
Du. Pont Analysis Asset Turnover Ratio Operating Profit Margin 2009 2010 2011 2012 2013 2014 Real Estate Firms 16% 13% 14% 12% 13% BSE Sensex 30% 31% 34% 33% 31% Top 4 Real estate firms 8%34% 4%34% 11%35% 12%18% 9%26% 10%30% 2009 2010 2011 2012 2013 2014 Real Estate Firms 58% 52% 51% 50% 48% 44% BSE Sensex 25% 24% 22% 23% Top 4 Real estate firms 27%73% 30%55% 26%70% 35%64% 30%78% 27%74% 2013 2014 100% 40% 50% 20% 0% 0% 2009 2010 2011 Real Estate average 2012 2013 BSE Sensex 2014 § Net sales increased at a CAGR of 5%; however the total assets increased at almost double growth rate of 10. 5%. § High months inventory ratio for real estate sector. § Demand-supply mismatch- lack of housing demand. § High interest rates and inflation rate. 04 November 2020 2009 2010 2011 Real Estate average 2012 BSE Sensex § Higher profit margins compared to Sensex due to increase in property prices during this period. § Declining profit margins for real estate - increase in input costs-building construction cost index of Construction Industry Development Council (CIDC) increased at a CAGR of 5. 8% for Delhi region from 2009 -14. 11
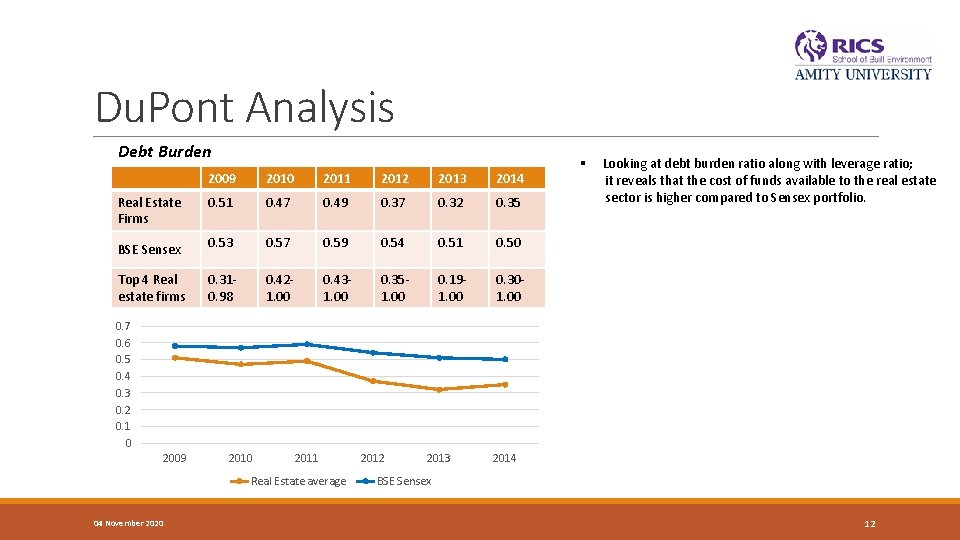
Du. Pont Analysis Debt Burden 2009 2010 2011 2012 2013 2014 Real Estate Firms 0. 51 0. 47 0. 49 0. 37 0. 32 0. 35 BSE Sensex 0. 53 0. 57 0. 59 0. 54 0. 51 0. 50 Top 4 Real estate firms 0. 310. 98 0. 421. 00 0. 431. 00 0. 351. 00 0. 191. 00 0. 301. 00 § Looking at debt burden ratio along with leverage ratio; it reveals that the cost of funds available to the real estate sector is higher compared to Sensex portfolio. 0. 7 0. 6 0. 5 0. 4 0. 3 0. 2 0. 1 0 2009 2010 2011 Real Estate average 04 November 2020 2012 2013 2014 BSE Sensex 12
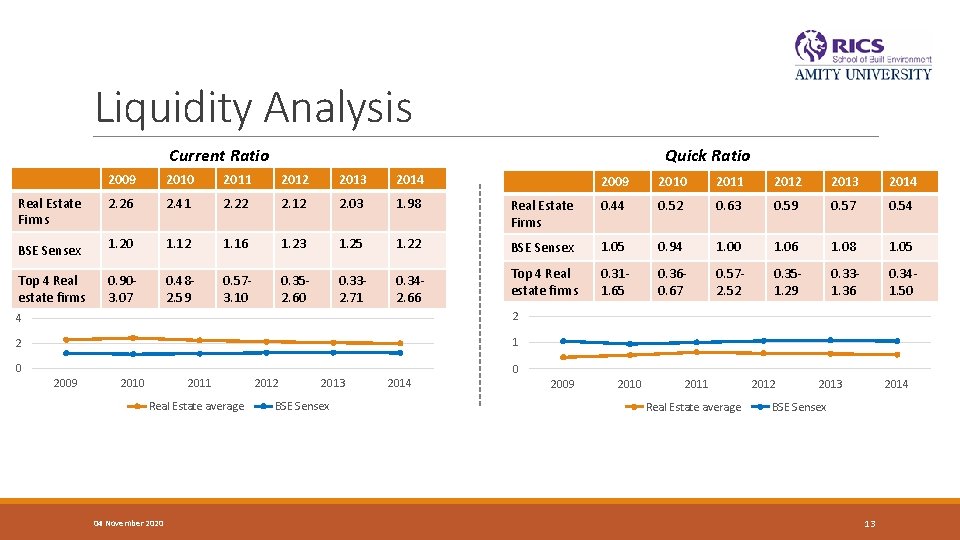
Liquidity Analysis Quick Ratio Current Ratio 2009 2010 2011 2012 2013 2014 Real Estate Firms 2. 26 2. 41 2. 22 2. 12 2. 03 1. 98 BSE Sensex 1. 20 1. 12 1. 16 1. 23 1. 25 1. 22 Top 4 Real estate firms 0. 903. 07 0. 482. 59 0. 573. 10 0. 352. 60 0. 332. 71 0. 342. 66 2009 2010 2011 2012 2013 2014 Real Estate Firms 0. 44 0. 52 0. 63 0. 59 0. 57 0. 54 BSE Sensex 1. 05 0. 94 1. 00 1. 06 1. 08 1. 05 Top 4 Real estate firms 0. 311. 65 0. 360. 67 0. 572. 52 0. 351. 29 0. 331. 36 0. 341. 50 4 2 2 1 0 2009 2010 2011 Real Estate average 04 November 2020 2012 2013 BSE Sensex 2014 0 2009 2010 2011 Real Estate average 2012 2013 2014 BSE Sensex 13
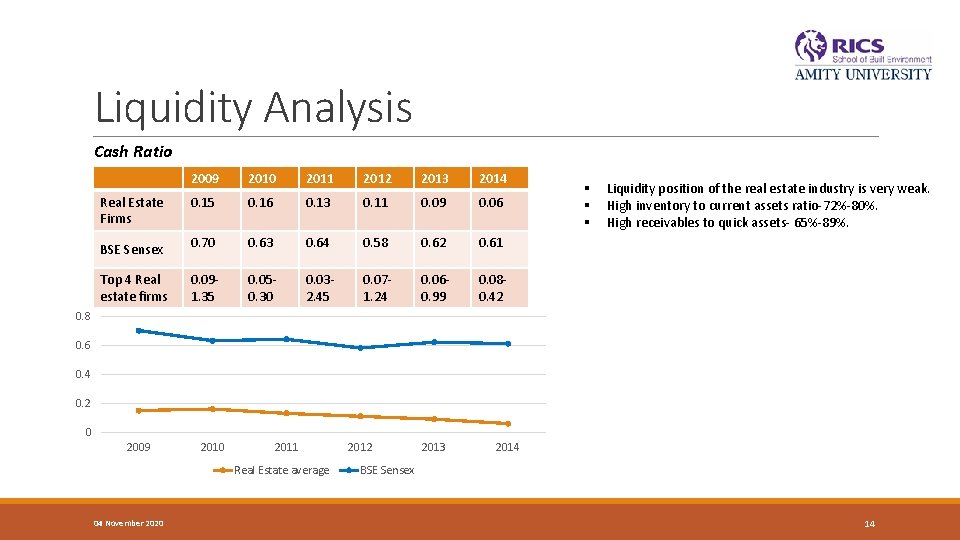
Liquidity Analysis Cash Ratio 2009 2010 2011 2012 2013 2014 Real Estate Firms 0. 15 0. 16 0. 13 0. 11 0. 09 0. 06 BSE Sensex 0. 70 0. 63 0. 64 0. 58 0. 62 0. 61 Top 4 Real estate firms 0. 091. 35 0. 050. 30 0. 032. 45 0. 071. 24 0. 060. 99 0. 080. 42 § § § Liquidity position of the real estate industry is very weak. High inventory to current assets ratio-72%-80%. High receivables to quick assets- 65%-89%. 0. 8 0. 6 0. 4 0. 2 0 2009 2010 2011 Real Estate average 04 November 2020 2012 2013 2014 BSE Sensex 14
Conclusion The study shows financially weak performance of real estate companies in India. Major challenges faced by the real estate sector in India: q High inventory levels of real estate sector due to lack of demand from the buyers. For this, Reserve Bank of India (RBI) has cut the repo rate thrice by 25 basis points each since Jan’ 2014 to reach to 7. 25% currently, encouraging the commercial banks to reduce the base interest rates as well and in turn, boosting the real estate sector growth by generating demand. q Higher cost of funds and weak liquidity position for the real estate sector as the sector risk is perceived high compared to other sectors. In this regard, REIT (Real Estate Investment Trust) encouragement in India enabling easier access to funds for cash trapped developers. q Declining profit margins due to increasing input costs. 04 November 2020 15
Future Research q Assessing the Indian real estate sector’s financial performance geographically. q Study the impact of accounting issues prevalent in the Indian real estate sector companies on the firm performance. q Study the inventory levels in the Indian real estate sector and its impact on the financials of the firms. 04 November 2020 16
Thank You! 04 November 2020 17