DENVER CRIME DATASET A STUDY OF CRIMES IN

- Slides: 12
DENVER CRIME DATASET A STUDY OF CRIMES IN DENVER, COLORADO BY MATTHEW HOGAN DSCI 101 MWF
PROJECT OVERVIEW The amount of crime in Denver, Colorado, from 2014 until present In this presentation: Overview of the Denver crime dataset Problems I had with the data Analysis technique Findings Future work Conclusion
DATA OVERVIEW From Kaggle Originally from https: //www. denvergov. org/opendata/dataset/city-and-county-of-denver-crime 517, 696 Records 9 fields Over 46, 000 KB
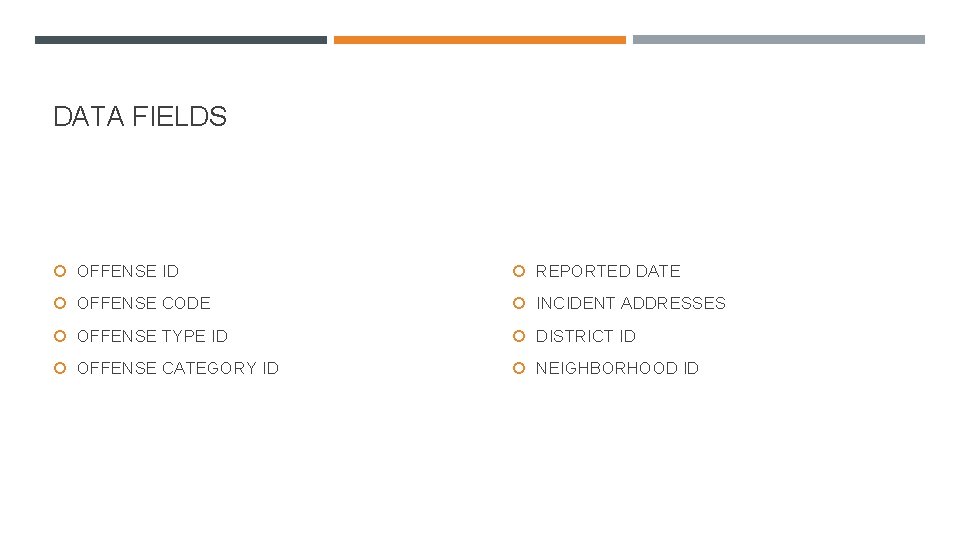
DATA FIELDS OFFENSE ID REPORTED DATE OFFENSE CODE INCIDENT ADDRESSES OFFENSE TYPE ID DISTRICT ID OFFENSE CATEGORY ID NEIGHBORHOOD ID
PROBLEMS WITH THE DATA Many pointless fields Unreadable/Massive Graphs All known bad data and blank fields replaced with NA
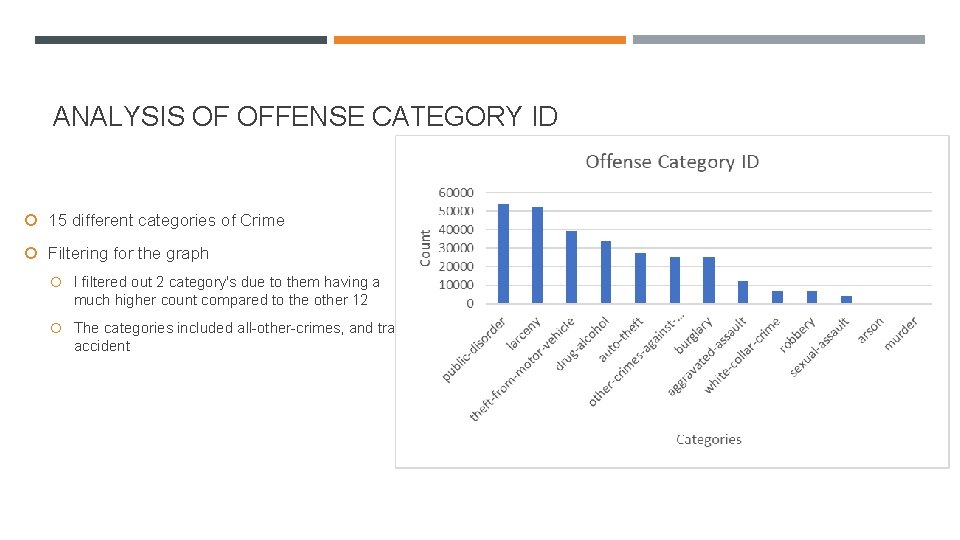
ANALYSIS OF OFFENSE CATEGORY ID 15 different categories of Crime Filtering for the graph I filtered out 2 category's due to them having a much higher count compared to the other 12 The categories included all-other-crimes, and trafficaccident
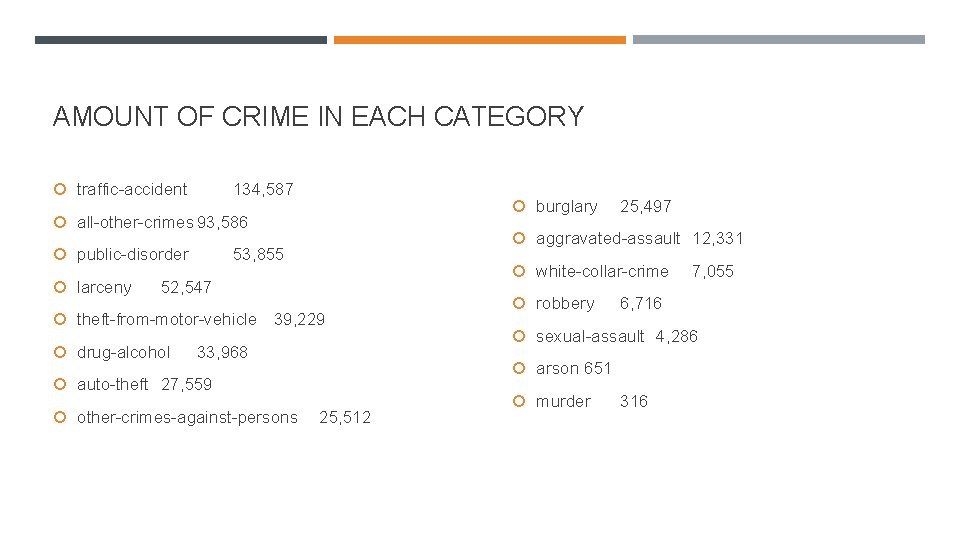
AMOUNT OF CRIME IN EACH CATEGORY traffic-accident 134, 587 burglary all-other-crimes 93, 586 public-disorder larceny aggravated-assault 12, 331 53, 855 white-collar-crime 52, 547 theft-from-motor-vehicle drug-alcohol 39, 229 33, 968 robbery 25, 512 7, 055 6, 716 sexual-assault 4, 286 arson 651 auto-theft 27, 559 other-crimes-against-persons 25, 497 murder 316
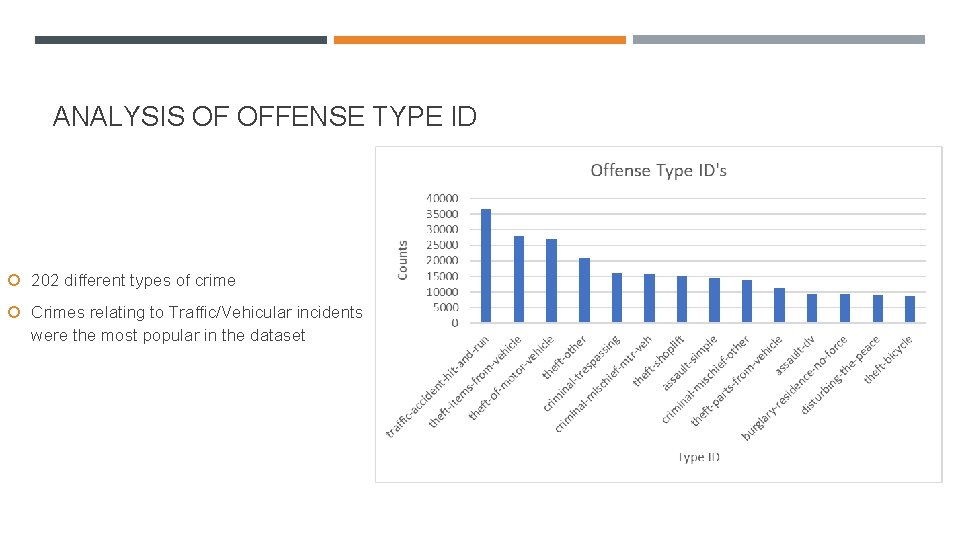
ANALYSIS OF OFFENSE TYPE ID 202 different types of crime Crimes relating to Traffic/Vehicular incidents were the most popular in the dataset
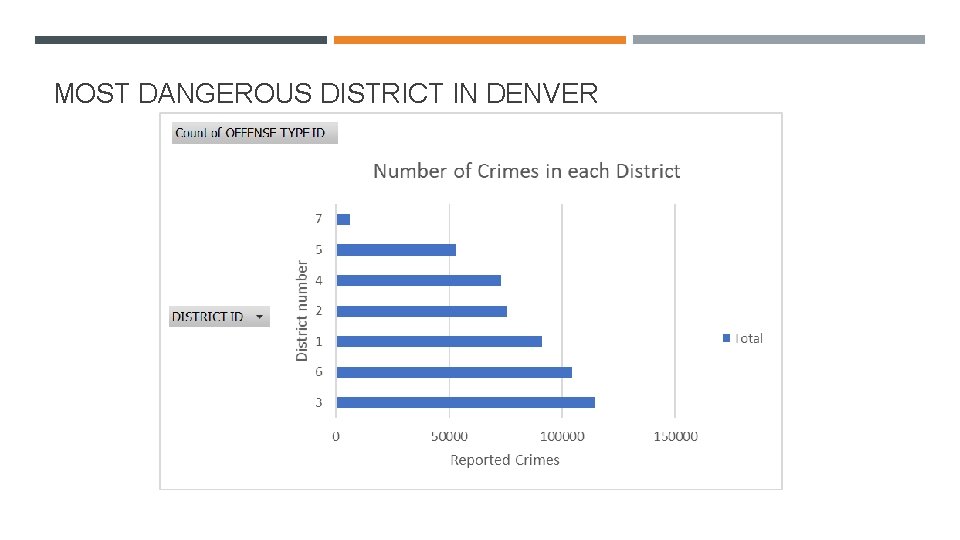
MOST DANGEROUS DISTRICT IN DENVER
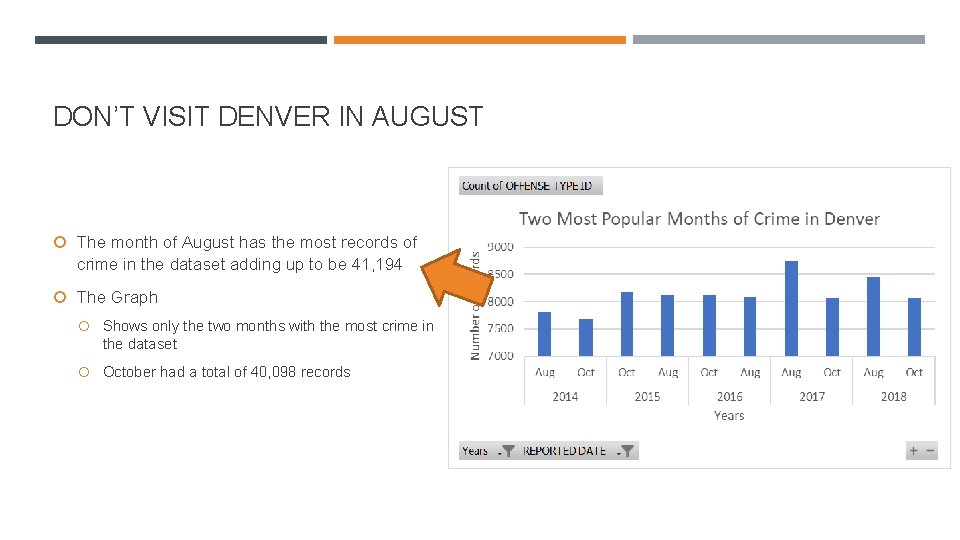
DON’T VISIT DENVER IN AUGUST The month of August has the most records of crime in the dataset adding up to be 41, 194 The Graph Shows only the two months with the most crime in the dataset October had a total of 40, 098 records
FUTURE WORK INCIDENT ADDRESS field issues When it came time to analyze the INCIDENT ADDRESS field my computer would crash/malfunction every time, in the future I would like to completely analyze this field Discover more ways to utilize Pivot Tables Gain more skill and knowledge of cleaning data Create more graphs
CONCLUSIONS Discovered that the month of August had the most crimes in the dataset Found out District 3 had the most crimes Calculated how many different types of crime there were Determined the amount of crime in each offense category