Data Scavenger Hunt Investigating Water Temperature Environmental Phenomena



- Slides: 14
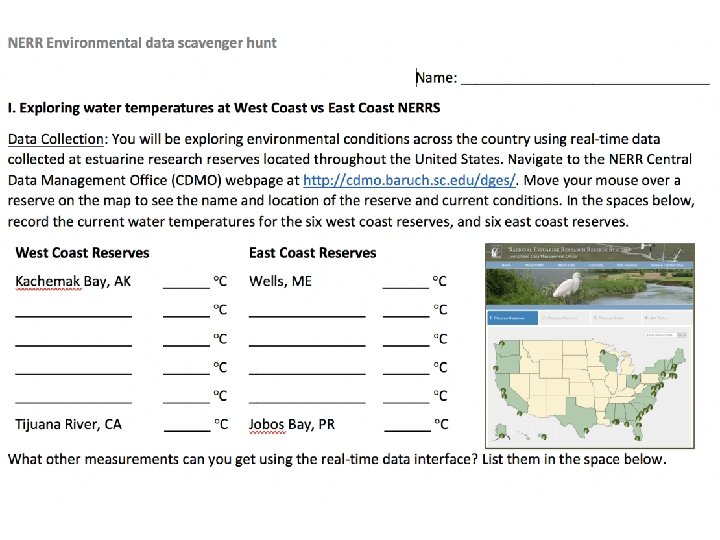
Data Scavenger Hunt Investigating Water Temperature & Environmental Phenomena at NERR Reserves
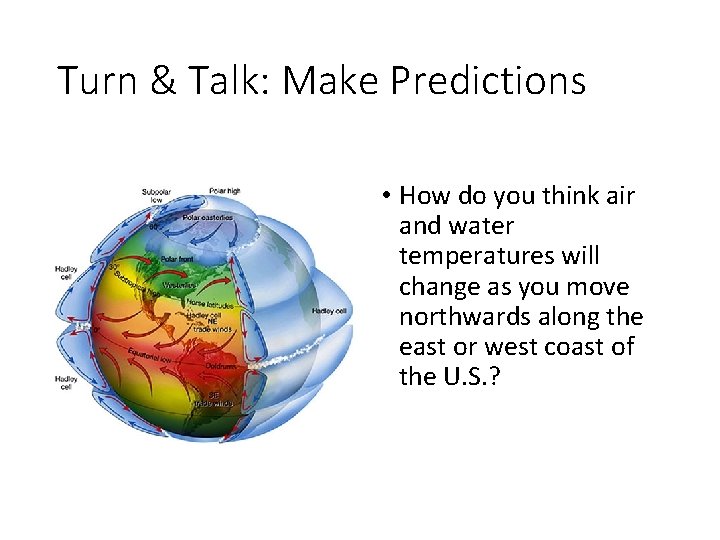
Turn & Talk: Make Predictions • How do you think air and water temperatures will change as you move northwards along the east or west coast of the U. S. ?
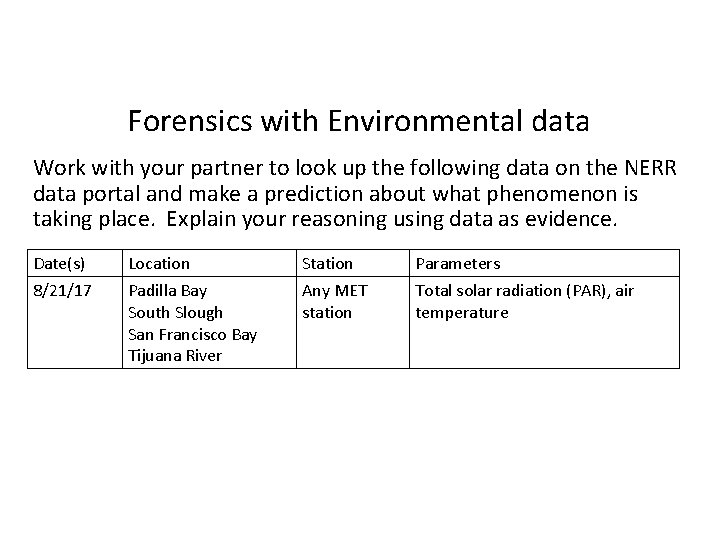
Forensics with Environmental data Work with your partner to look up the following data on the NERR data portal and make a prediction about what phenomenon is taking place. Explain your reasoning using data as evidence. Date(s) Location Station Parameters 8/21/17 Padilla Bay South Slough San Francisco Bay Tijuana River Any MET station Total solar radiation (PAR), air temperature
Analyzing surface water data From Different Coastal Reserves
Revisit Mystery Locations
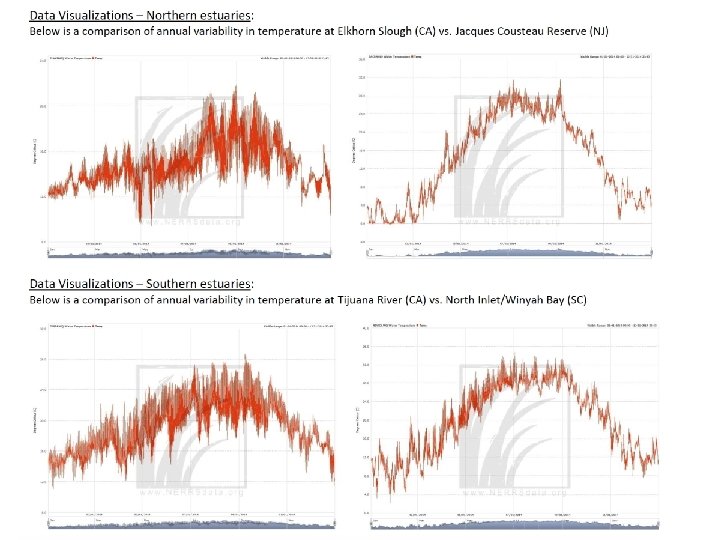
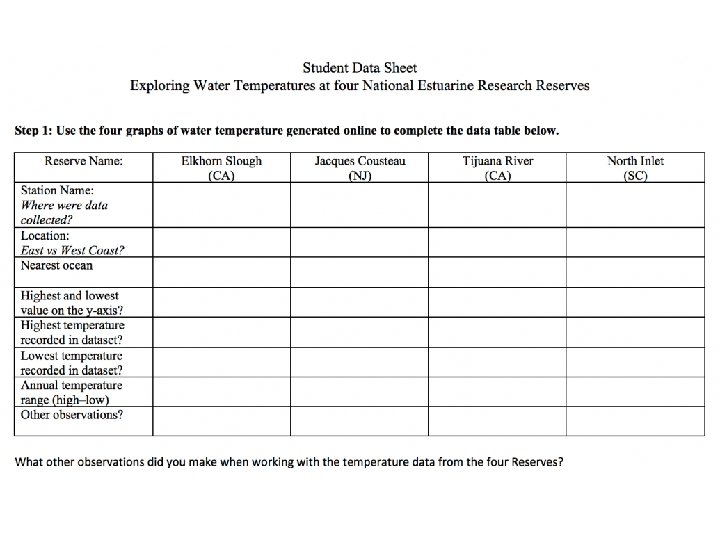
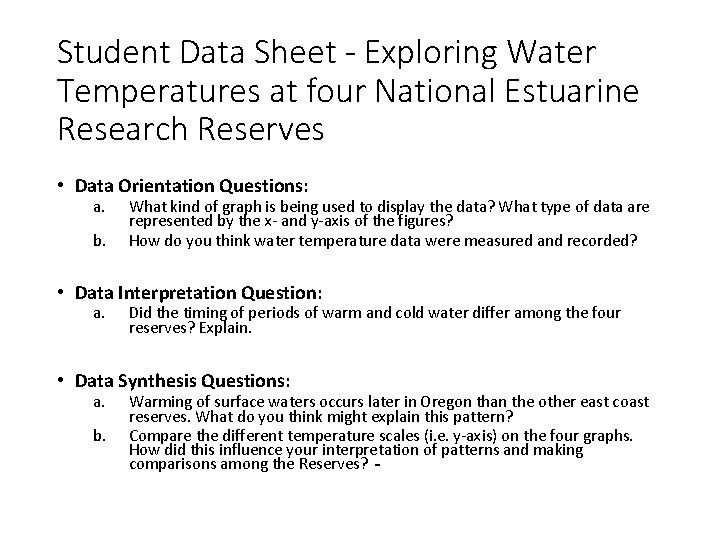
Student Data Sheet - Exploring Water Temperatures at four National Estuarine Research Reserves • Data Orientation Questions: a. b. What kind of graph is being used to display the data? What type of data are represented by the x- and y-axis of the figures? How do you think water temperature data were measured and recorded? • Data Interpretation Question: a. Did the timing of periods of warm and cold water differ among the four reserves? Explain. • Data Synthesis Questions: a. b. Warming of surface waters occurs later in Oregon than the other east coast reserves. What do you think might explain this pattern? Compare the different temperature scales (i. e. y-axis) on the four graphs. How did this influence your interpretation of patterns and making comparisons among the Reserves?
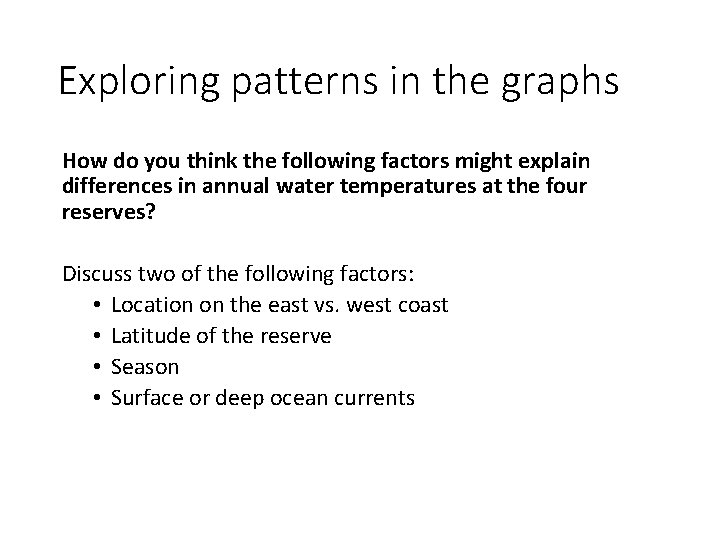
Exploring patterns in the graphs How do you think the following factors might explain differences in annual water temperatures at the four reserves? Discuss two of the following factors: • Location on the east vs. west coast • Latitude of the reserve • Season • Surface or deep ocean currents
Think back to Mystery Locations – air temperature data • Does the water temperature data from Jacques Cousteau Reserve and North Inlet Winyah Bay provide additional evidence in support of your claims regarding the location where air temperature data from Location A and Location B were collected?
Turn & Talk about data activity • What skills did you use to compare the air and water temperature data to look for relationships? • Did these comparisons provide further evidence for the importance of the ocean in regulating air temperature? Explain. • What additional information about these two reserves did you learn from looking at the air temperature data for a second time (e. g. , what did you see/understand this time that you didn’t last time)?