Credit Risk Konstantinos Drakos Department of Accounting and






















- Slides: 47
Credit Risk Konstantinos Drakos Department of Accounting and Finance Athens University of Economics and Business Ειδικά Θέματα Χρηματοοικονομικής, Κωνσταντίνος Δράκος 1
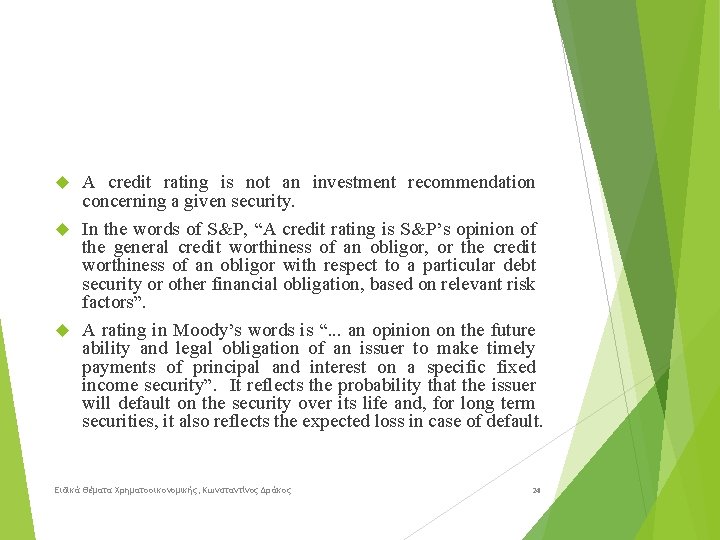
A credit rating is not an investment recommendation concerning a given security. In the words of S&P, “A credit rating is S&P’s opinion of the general credit worthiness of an obligor, or the credit worthiness of an obligor with respect to a particular debt security or other financial obligation, based on relevant risk factors”. A rating in Moody’s words is “. . . an opinion on the future ability and legal obligation of an issuer to make timely payments of principal and interest on a specific fixed income security”. It reflects the probability that the issuer will default on the security over its life and, for long term securities, it also reflects the expected loss in case of default. Ειδικά Θέματα Χρηματοοικονομικής, Κωνσταντίνος Δράκος 24
The rating process includes quantitative, qualitative and legal analyses. The qualitative analysis is mainly financial analysis, based on the firm’s financial reports. The qualitative analysis is concerned with the firm’s competitiveness within its industry and the quality of management, and includes a thorough review of the expected growth of the industry and its vulnerability to technological charge, regulatory charges and labor relationships The categories are defined in terms of default risk and the likelihood of payment for the issuer. Issues rated in the four highest categories (i. e. , AAA, A and BBB of S&P and Aaa, A and Baa of Moody’s) generally are considered as being investment-grade. Some financial institutions, for special or approved investment programs, are required to only invest in bonds or debt instruments which are investment-grade. Obligations rated BB, B, CCC, and C (Ba, B, Caa, Ca and C), are regarded as having significant speculative characteristics. BB (Ba) indicates the least degree of speculation and C the highest. While such obligations will likely have some quality and protective characteristics, these may be outweighed by large uncertainties or major exposures to adverse conditions. S&P Ratings Category Definitions next Ειδικά Θέματα Χρηματοοικονομικής, Κωνσταντίνος Δράκος 25
AAA the highest rating, the obligor’s capacity to meet its financial commitment on the obligation is extremely strong. AA differs from the highest rated obligations only in small degree, the obligor’s capacity to meet its financial commitment on the obligation is very strong. A somewhat more susceptible to the adverse effects of changes in circumstances and economic conditions than obligations in higher rated categories. BBB exhibits adequate protection parameters. However, adverse economic conditions or changing circumstances are more likely to lead to a weakened capacity to meet financial commitment BB is less vulnerable to nonpayment than other speculative issues. However, it faces major ongoing uncertainties or exposure to adverse business, financial, or economic conditions. B currently has the capacity to meet commitment but adverse business, financial, or economic conditions will likely impair the capacity or willingness to meet commitment CCC currently vulnerable to nonpayment, and is dependent upon favorable business, financial, and economic conditions to meet its commitment CC An obligation rated CC is currently highly vulnerable to nonpayment. C Ειδικά Θέματα Χρηματοοικονομικής, Κωνσταντίνος Δράκος covers a situation where a bankruptcy petition has been filed 26 but payments on this obligation are being continued.
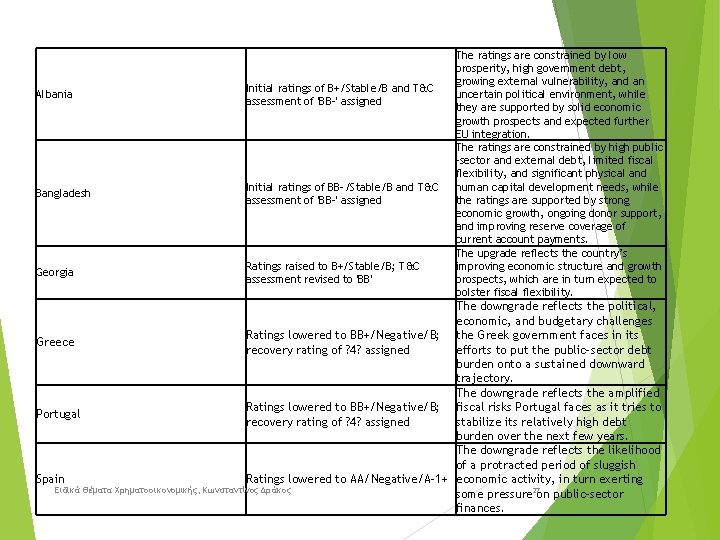
Albania Initial ratings of B+/Stable/B and T&C assessment of 'BB-' assigned Bangladesh Initial ratings of BB-/Stable/B and T&C assessment of 'BB-' assigned Georgia Ratings raised to B+/Stable/B; T&C assessment revised to 'BB' The ratings are constrained by low prosperity, high government debt, growing external vulnerability, and an uncertain political environment, while they are supported by solid economic growth prospects and expected further EU integration. The ratings are constrained by high public -sector and external debt, limited fiscal flexibility, and significant physical and human capital development needs, while the ratings are supported by strong economic growth, ongoing donor support, and improving reserve coverage of current account payments. The upgrade reflects the country’s improving economic structure and growth prospects, which are in turn expected to bolster fiscal flexibility. The downgrade reflects the political, economic, and budgetary challenges Ratings lowered to BB+/Negative/B; the Greek government faces in its Greece recovery rating of ? 4? assigned efforts to put the public-sector debt burden onto a sustained downward trajectory. The downgrade reflects the amplified Ratings lowered to BB+/Negative/B; fiscal risks Portugal faces as it tries to Portugal recovery rating of ? 4? assigned stabilize its relatively high debt burden over the next few years. The downgrade reflects the likelihood of a protracted period of sluggish Spain Ratings lowered to AA/Negative/A-1+ economic activity, in turn exerting Ειδικά Θέματα Χρηματοοικονομικής, Κωνσταντίνος Δράκος some pressure 27 on public-sector finances.
Debt Rating and Migration Bankruptcy is a legal or economic event, marking usually the end of the corporation in its current form. It is a discrete event, when the value of the firm or its cash flow hits a lower boundary. We can describe it as the end of a continuous process when it is recognized that the firm cannot meet its financial obligations. By focusing only on the event of bankruptcy, a lot of information on the status of the firm, its total value and the value of its liabilities, is lost. Credit agencies actually provide additional information, though in discrete points in time, by revising their credit rating of corporate bonds. On a periodic basis, and sometimes in reaction to economic events, the rating agency repeats its rating process and decides whether to revise the rating it gave a certain bond. It can decide to leave the rating unchanged, to downgrade or upgrade the bond. The evolution of credit quality is very important for an investor holding a portfolio of corporate bonds. Ειδικά Θέματα Χρηματοοικονομικής, Κωνσταντίνος Δράκος 28
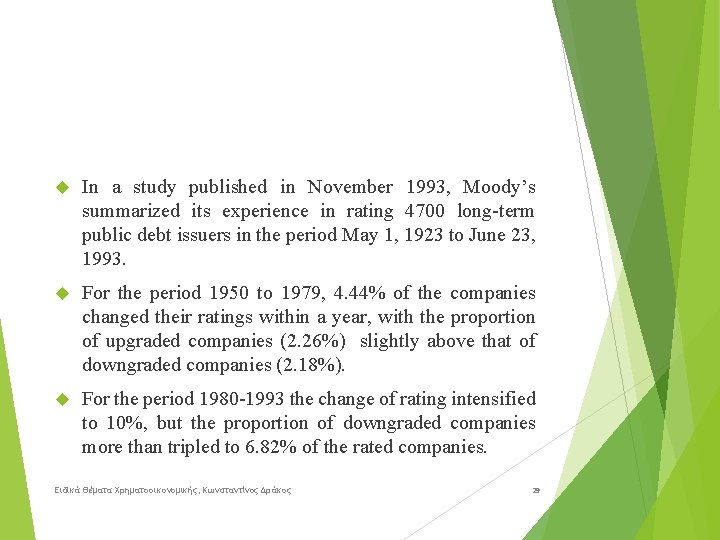
In a study published in November 1993, Moody’s summarized its experience in rating 4700 long-term public debt issuers in the period May 1, 1923 to June 23, 1993. For the period 1950 to 1979, 4. 44% of the companies changed their ratings within a year, with the proportion of upgraded companies (2. 26%) slightly above that of downgraded companies (2. 18%). For the period 1980 -1993 the change of rating intensified to 10%, but the proportion of downgraded companies more than tripled to 6. 82% of the rated companies. Ειδικά Θέματα Χρηματοοικονομικής, Κωνσταντίνος Δράκος 29
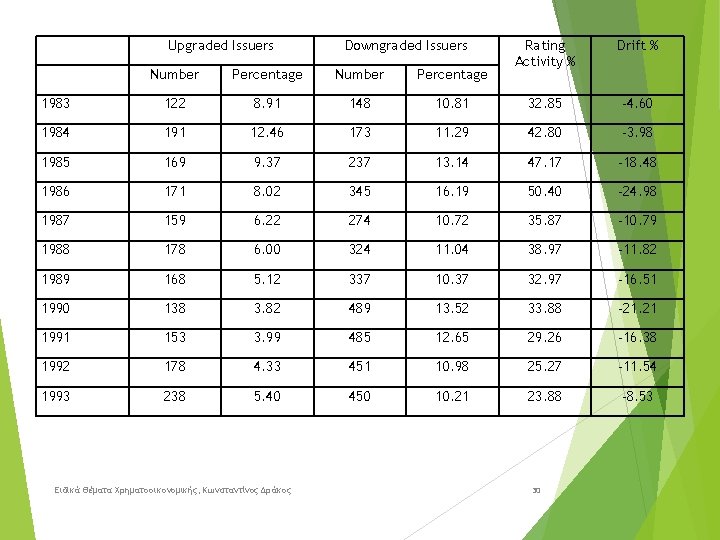
Upgraded Issuers Downgraded Issuers Rating Activity % Drift % Number Percentage 1983 122 8. 91 148 10. 81 32. 85 -4. 60 1984 191 12. 46 173 11. 29 42. 80 -3. 98 1985 169 9. 37 237 13. 14 47. 17 -18. 48 1986 171 8. 02 345 16. 19 50. 40 -24. 98 1987 159 6. 22 274 10. 72 35. 87 -10. 79 1988 178 6. 00 324 11. 04 38. 97 -11. 82 1989 168 5. 12 337 10. 37 32. 97 -16. 51 1990 138 3. 82 489 13. 52 33. 88 -21. 21 1991 153 3. 99 485 12. 65 29. 26 -16. 38 1992 178 4. 33 451 10. 98 25. 27 -11. 54 1993 238 5. 40 450 10. 21 23. 88 -8. 53 Ειδικά Θέματα Χρηματοοικονομικής, Κωνσταντίνος Δράκος 30
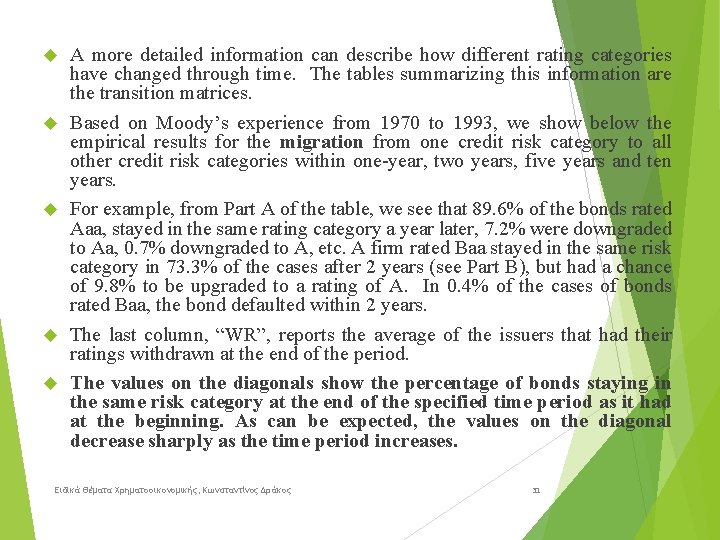
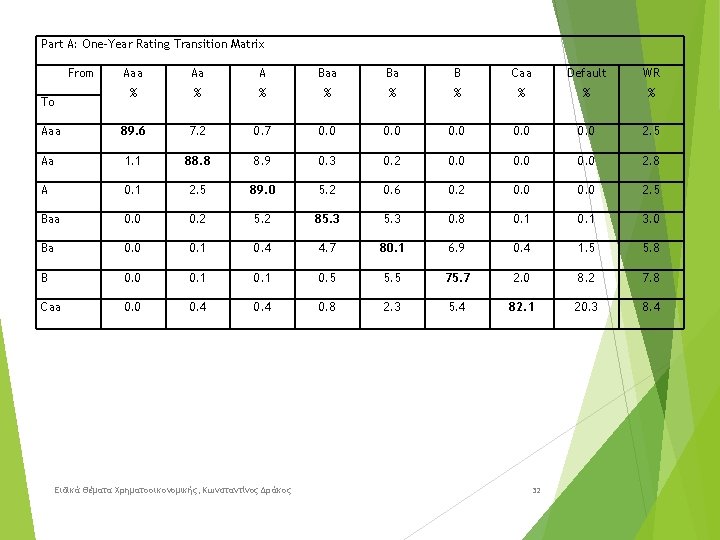
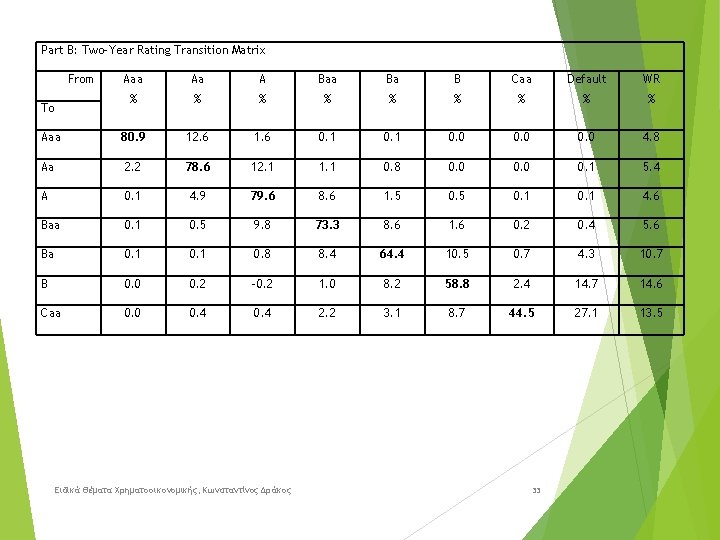
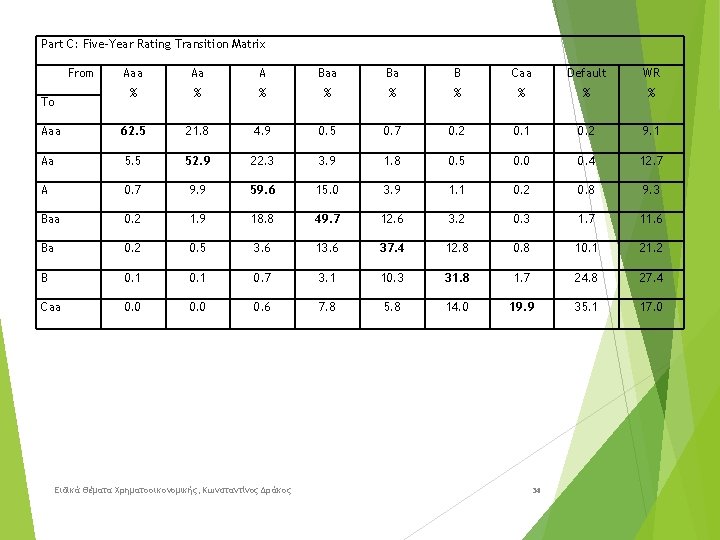
A more detailed information can describe how different rating categories have changed through time. The tables summarizing this information are the transition matrices. Based on Moody’s experience from 1970 to 1993, we show below the empirical results for the migration from one credit risk category to all other credit risk categories within one-year, two years, five years and ten years. For example, from Part A of the table, we see that 89. 6% of the bonds rated Aaa, stayed in the same rating category a year later, 7. 2% were downgraded to Aa, 0. 7% downgraded to A, etc. A firm rated Baa stayed in the same risk category in 73. 3% of the cases after 2 years (see Part B), but had a chance of 9. 8% to be upgraded to a rating of A. In 0. 4% of the cases of bonds rated Baa, the bond defaulted within 2 years. The last column, “WR”, reports the average of the issuers that had their ratings withdrawn at the end of the period. The values on the diagonals show the percentage of bonds staying in the same risk category at the end of the specified time period as it had at the beginning. As can be expected, the values on the diagonal decrease sharply as the time period increases. Ειδικά Θέματα Χρηματοοικονομικής, Κωνσταντίνος Δράκος 31
Part A: One-Year Rating Transition Matrix From Aaa Aa A Baa Ba B Caa Default WR % % % % % Aaa 89. 6 7. 2 0. 7 0. 0 0. 0 2. 5 Aa 1. 1 88. 8 8. 9 0. 3 0. 2 0. 0 2. 8 A 0. 1 2. 5 89. 0 5. 2 0. 6 0. 2 0. 0 2. 5 Baa 0. 0 0. 2 5. 2 85. 3 0. 8 0. 1 3. 0 Ba 0. 0 0. 1 0. 4 4. 7 80. 1 6. 9 0. 4 1. 5 5. 8 B 0. 0 0. 1 0. 5 5. 5 75. 7 2. 0 8. 2 7. 8 Caa 0. 0 0. 4 0. 8 2. 3 5. 4 82. 1 20. 3 8. 4 To Ειδικά Θέματα Χρηματοοικονομικής, Κωνσταντίνος Δράκος 32
Part B: Two-Year Rating Transition Matrix From Aaa Aa A Baa Ba B Caa Default WR % % % % % Aaa 80. 9 12. 6 1. 6 0. 1 0. 0 4. 8 Aa 2. 2 78. 6 12. 1 1. 1 0. 8 0. 0 0. 1 5. 4 A 0. 1 4. 9 79. 6 8. 6 1. 5 0. 1 4. 6 Baa 0. 1 0. 5 9. 8 73. 3 8. 6 1. 6 0. 2 0. 4 5. 6 Ba 0. 1 0. 8 8. 4 64. 4 10. 5 0. 7 4. 3 10. 7 B 0. 0 0. 2 -0. 2 1. 0 8. 2 58. 8 2. 4 14. 7 14. 6 Caa 0. 0 0. 4 2. 2 3. 1 8. 7 44. 5 27. 1 13. 5 To Ειδικά Θέματα Χρηματοοικονομικής, Κωνσταντίνος Δράκος 33
Part C: Five-Year Rating Transition Matrix From Aaa Aa A Baa Ba B Caa Default WR % % % % % Aaa 62. 5 21. 8 4. 9 0. 5 0. 7 0. 2 0. 1 0. 2 9. 1 Aa 5. 5 52. 9 22. 3 3. 9 1. 8 0. 5 0. 0 0. 4 12. 7 A 0. 7 9. 9 59. 6 15. 0 3. 9 1. 1 0. 2 0. 8 9. 3 Baa 0. 2 1. 9 18. 8 49. 7 12. 6 3. 2 0. 3 1. 7 11. 6 Ba 0. 2 0. 5 3. 6 13. 6 37. 4 12. 8 0. 8 10. 1 21. 2 B 0. 1 0. 7 3. 1 10. 3 31. 8 1. 7 24. 8 27. 4 Caa 0. 0 0. 6 7. 8 5. 8 14. 0 19. 9 35. 1 17. 0 To Ειδικά Θέματα Χρηματοοικονομικής, Κωνσταντίνος Δράκος 34
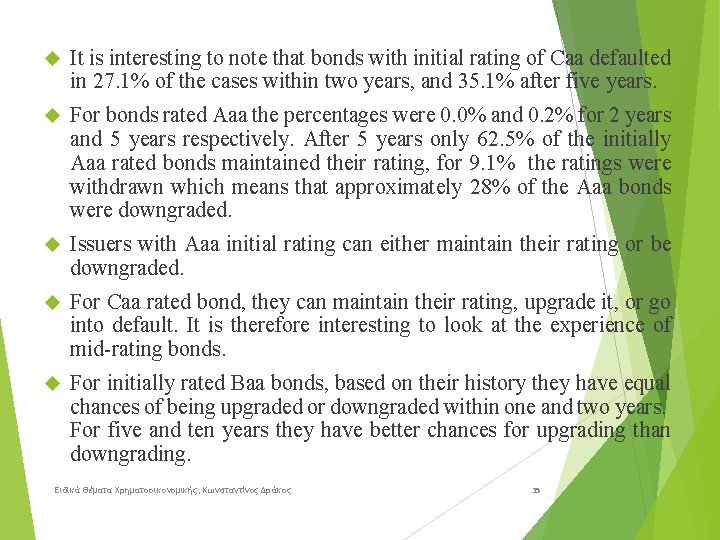
It is interesting to note that bonds with initial rating of Caa defaulted in 27. 1% of the cases within two years, and 35. 1% after five years. For bonds rated Aaa the percentages were 0. 0% and 0. 2% for 2 years and 5 years respectively. After 5 years only 62. 5% of the initially Aaa rated bonds maintained their rating, for 9. 1% the ratings were withdrawn which means that approximately 28% of the Aaa bonds were downgraded. Issuers with Aaa initial rating can either maintain their rating or be downgraded. For Caa rated bond, they can maintain their rating, upgrade it, or go into default. It is therefore interesting to look at the experience of mid-rating bonds. For initially rated Baa bonds, based on their history they have equal chances of being upgraded or downgraded within one and two years. For five and ten years they have better chances for upgrading than downgrading. Ειδικά Θέματα Χρηματοοικονομικής, Κωνσταντίνος Δράκος 35
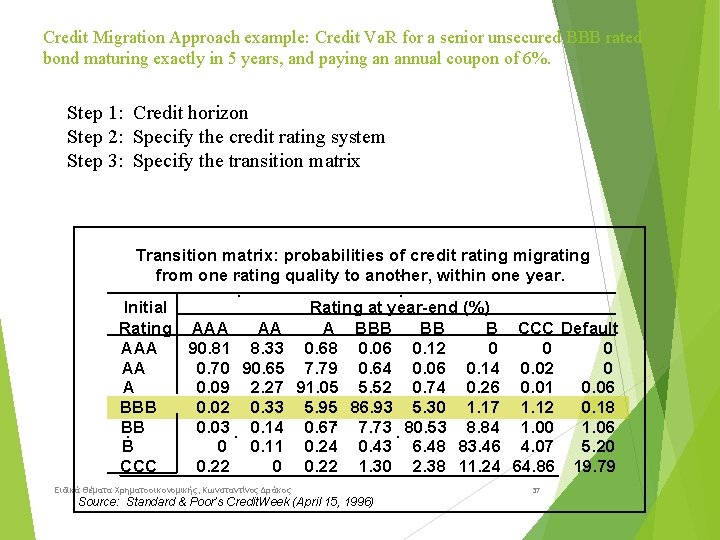
Credit Migration Approach example: Credit Va. R for a senior unsecured BBB rated bond maturing exactly in 5 years, and paying an annual coupon of 6%. Step 1: Credit horizon Step 2: Specify the credit rating system Step 3: Specify the transition matrix Transition matrix: probabilities of credit rating migrating from one rating quality to another, within one year. Initial Rating at year-end (%) Rating AAA AA A BBB BB B CCC Default AAA 90. 81 8. 33 0. 68 0. 06 0. 12 0 0 0 AA 0. 70 90. 65 7. 79 0. 64 0. 06 0. 14 0. 02 0 A 0. 09 2. 27 91. 05 5. 52 0. 74 0. 26 0. 01 0. 06 BBB 0. 02 0. 33 5. 95 86. 93 5. 30 1. 17 1. 12 0. 18 BB 0. 03 0. 14 0. 67 7. 73 80. 53 8. 84 1. 00 1. 06 B 0 0. 11 0. 24 0. 43 6. 48 83. 46 4. 07 5. 20 CCC 0. 22 0 0. 22 1. 30 2. 38 11. 24 64. 86 19. 79 Ειδικά Θέματα Χρηματοοικονομικής, Κωνσταντίνος Δράκος Source: Standard & Poor’s Credit. Week (April 15, 1996) 37
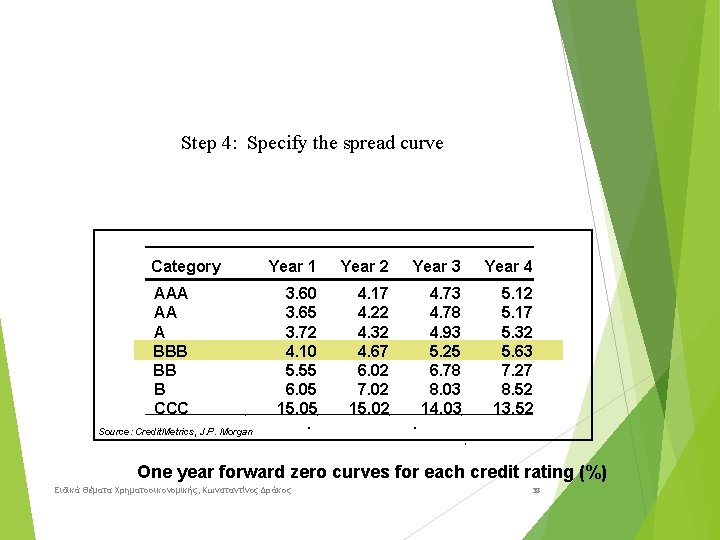
Step 4: Specify the spread curve Category AAA AA A BBB BB B CCC Year 1 Year 2 Year 3 Year 4 3. 60 3. 65 3. 72 4. 10 5. 55 6. 05 15. 05 4. 17 4. 22 4. 32 4. 67 6. 02 7. 02 15. 02 4. 73 4. 78 4. 93 5. 25 6. 78 8. 03 14. 03 5. 12 5. 17 5. 32 5. 63 7. 27 8. 52 13. 52 Source: Credit. Metrics, J. P. Morgan One year forward zero curves for each credit rating (%) Ειδικά Θέματα Χρηματοοικονομικής, Κωνσταντίνος Δράκος 38
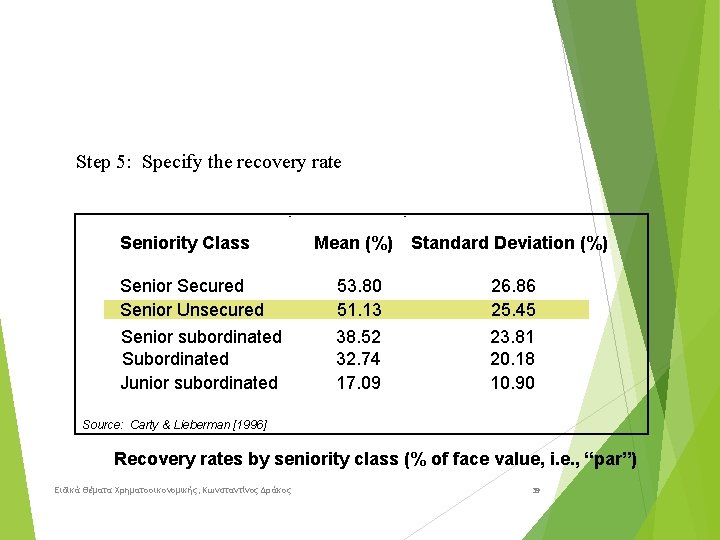
Step 5: Specify the recovery rate Seniority Class Senior Secured Senior Unsecured Senior subordinated Subordinated Junior subordinated Mean (%) 53. 80 51. 13 38. 52 32. 74 17. 09 Standard Deviation (%) 26. 86 25. 45 23. 81 20. 18 10. 90 Source: Carty & Lieberman [1996] Recovery rates by seniority class (% of face value, i. e. , “par”) Ειδικά Θέματα Χρηματοοικονομικής, Κωνσταντίνος Δράκος 39
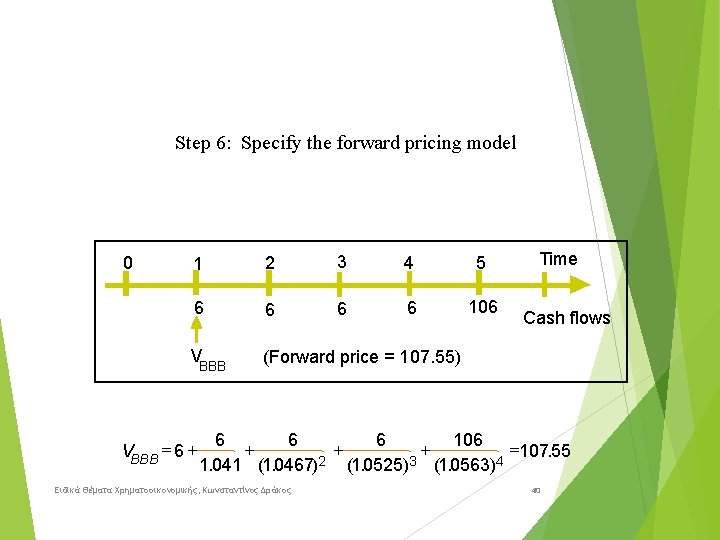
Step 6: Specify the forward pricing model 0 1 2 3 4 5 6 6 106 VBBB (Forward price = 107. 55) VBBB = 6 + Time Cash flows 6 6 6 106 + + + =107. 55 2 3 4 1. 041 (1. 0467) (1. 0525) (1. 0563) Ειδικά Θέματα Χρηματοοικονομικής, Κωνσταντίνος Δράκος 40
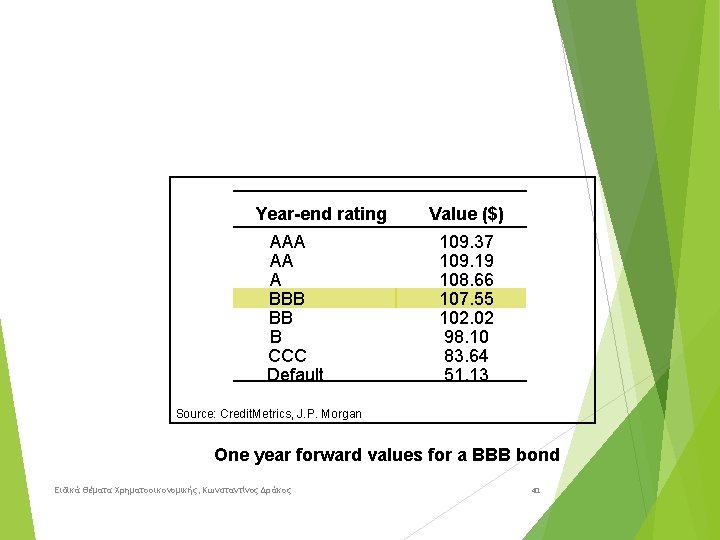
Year-end rating AAA AA A BBB BB B CCC Default Value ($) 109. 37 109. 19 108. 66 107. 55 102. 02 98. 10 83. 64 51. 13 Source: Credit. Metrics, J. P. Morgan One year forward values for a BBB bond Ειδικά Θέματα Χρηματοοικονομικής, Κωνσταντίνος Δράκος 41
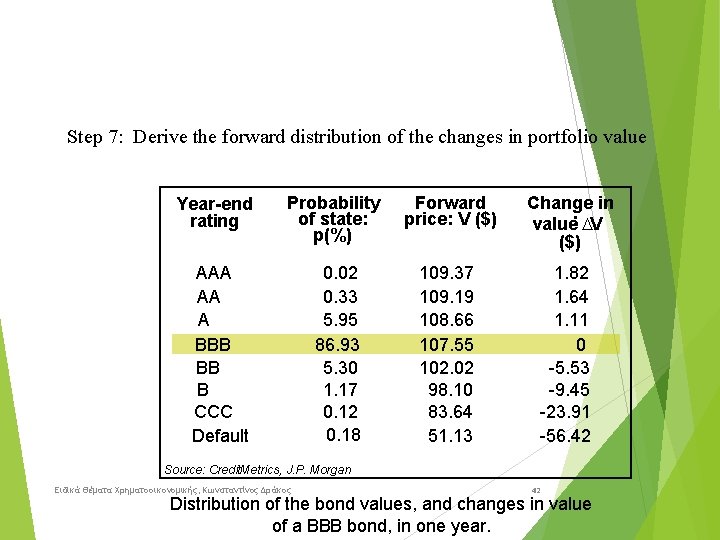
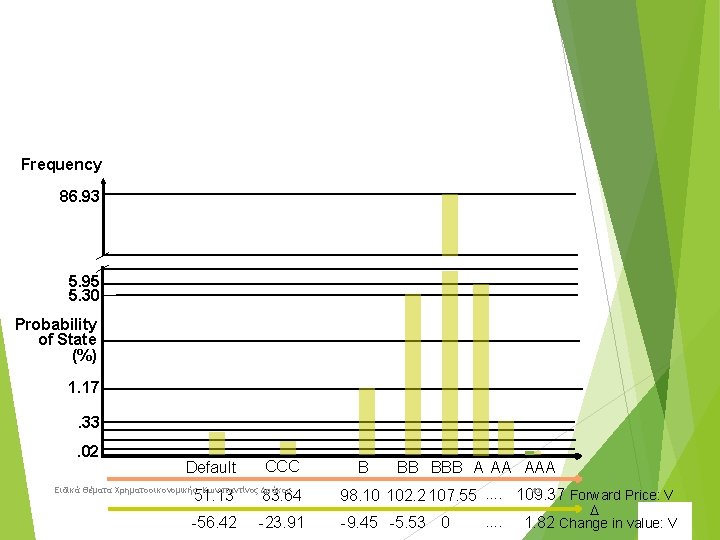
Step 7: Derive the forward distribution of the changes in portfolio value Year-end rating Probability of state: p(%) Forward price: V ($) Change in value: DV ($) 0. 02 0. 33 5. 95 86. 93 5. 30 1. 17 0. 12 0. 18 109. 37 109. 19 108. 66 107. 55 102. 02 98. 10 83. 64 51. 13 1. 82 1. 64 1. 11 0 -5. 53 -9. 45 -23. 91 -56. 42 AAA AA A BBB BB B CCC Default Source: Credit. Metrics, J. P. Morgan Ειδικά Θέματα Χρηματοοικονομικής, Κωνσταντίνος Δράκος 42 Distribution of the bond values, and changes in value of a BBB bond, in one year.
Frequency 86. 93 5. 95 5. 30 Probability of State (%) 1. 17. 33. 02 Default CCC B BB BBB A AA AAA 51. 13 83. 64 43 Forward Price: V 98. 10 102. 2 107. 55. . 109. 37 -56. 42 -23. 91 -9. 45 -5. 53 0 Ειδικά Θέματα Χρηματοοικονομικής, Κωνσταντίνος Δράκος . . D 1. 82 Change in value: V
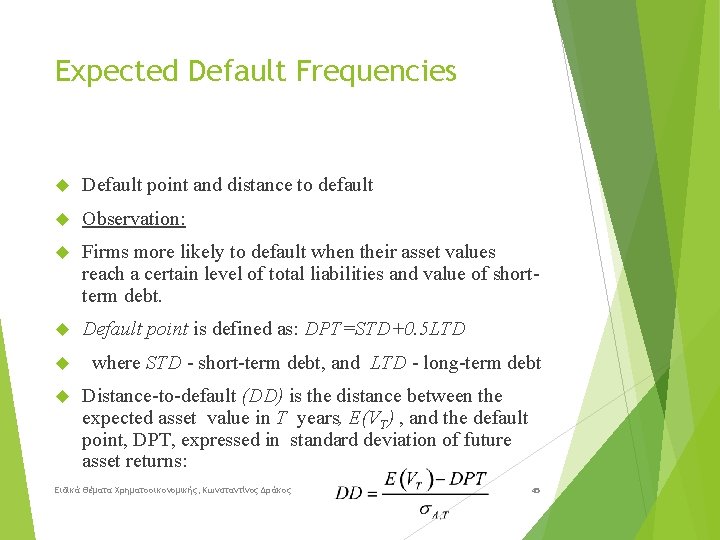
Expected Default Frequencies Default point and distance to default Observation: Firms more likely to default when their asset values reach a certain level of total liabilities and value of shortterm debt. Default point is defined as: DPT=STD+0. 5 LTD where STD - short-term debt, and LTD - long-term debt Distance-to-default (DD) is the distance between the expected asset value in T years, E(VT) , and the default point, DPT, expressed in standard deviation of future asset returns: Ειδικά Θέματα Χρηματοοικονομικής, Κωνσταντίνος Δράκος 45
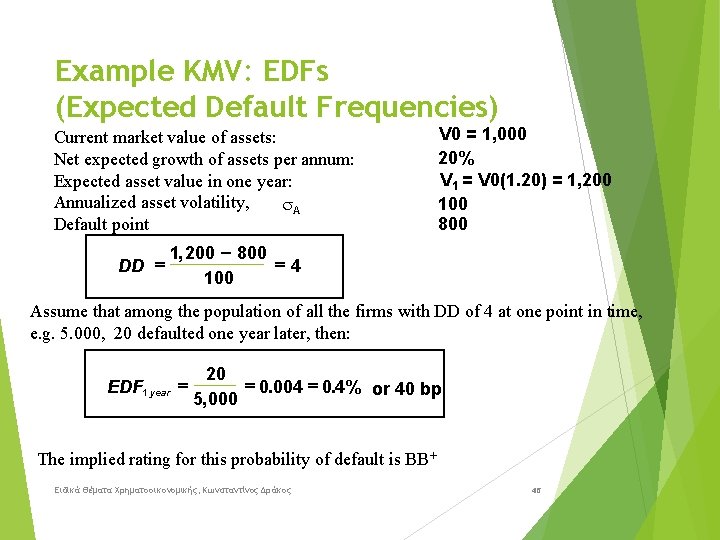
Example KMV: EDFs (Expected Default Frequencies) Current market value of assets: Net expected growth of assets per annum: Expected asset value in one year: Annualized asset volatility, s. A Default point DD = V 0 = 1, 000 20% V 1 = V 0(1. 20) = 1, 200 100 800 1, 200 - 800 =4 100 Assume that among the population of all the firms with DD of 4 at one point in time, e. g. 5. 000, 20 defaulted one year later, then: EDF 1 year = 20 = 0. 004 = 0. 4% or 40 bp 5, 000 The implied rating for this probability of default is BB+ Ειδικά Θέματα Χρηματοοικονομικής, Κωνσταντίνος Δράκος 46
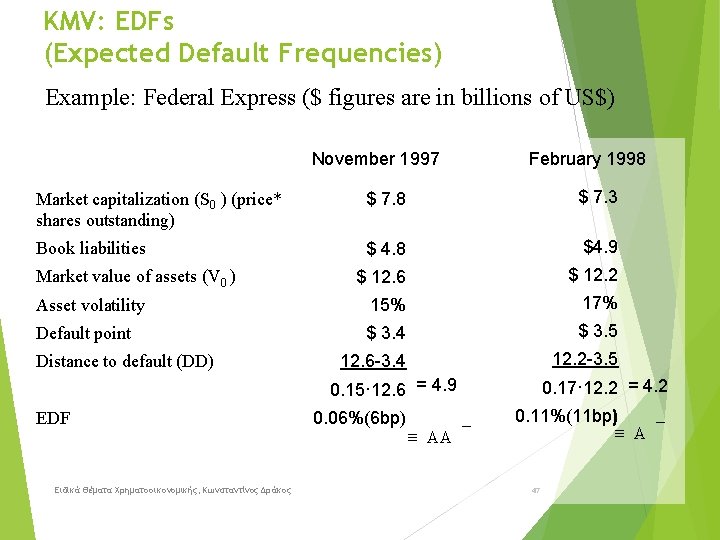
KMV: EDFs (Expected Default Frequencies) Example: Federal Express ($ figures are in billions of US$) November 1997 February 1998 Market capitalization (S 0 ) (price* shares outstanding) $ 7. 8 $ 7. 3 Book liabilities $ 4. 8 $4. 9 $ 12. 6 $ 12. 2 Asset volatility 15% 17% Default point $ 3. 4 $ 3. 5 12. 6 -3. 4 12. 2 -3. 5 Market value of assets (V 0 ) Distance to default (DD) 0. 15· 12. 6 = 4. 9 EDF Ειδικά Θέματα Χρηματοοικονομικής, Κωνσταντίνος Δράκος 0. 06%(6 bp) º AA 0. 17· 12. 2 = 4. 2 0. 11%(11 bp) º A 47