Comparing with redshift surveys of galaxies Redshift surveys

 Las Campanas ----25000 galaxies")


")
")
 model (e. g. Jing et")


- Slides: 31
Comparing with redshift surveys of galaxies
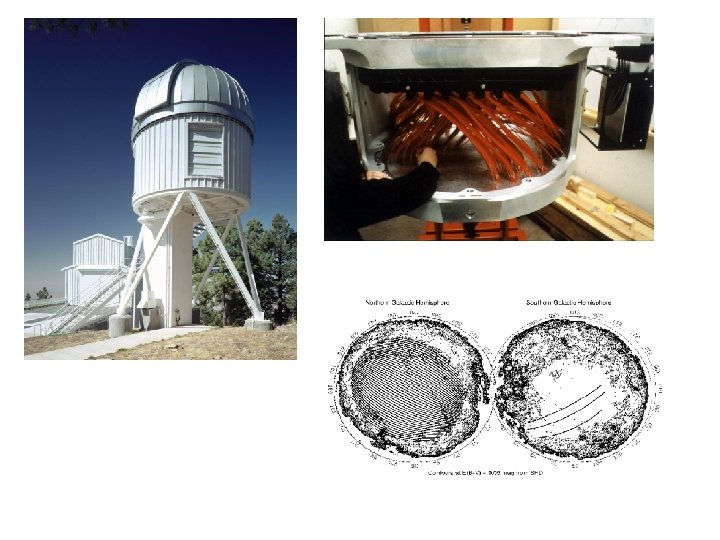
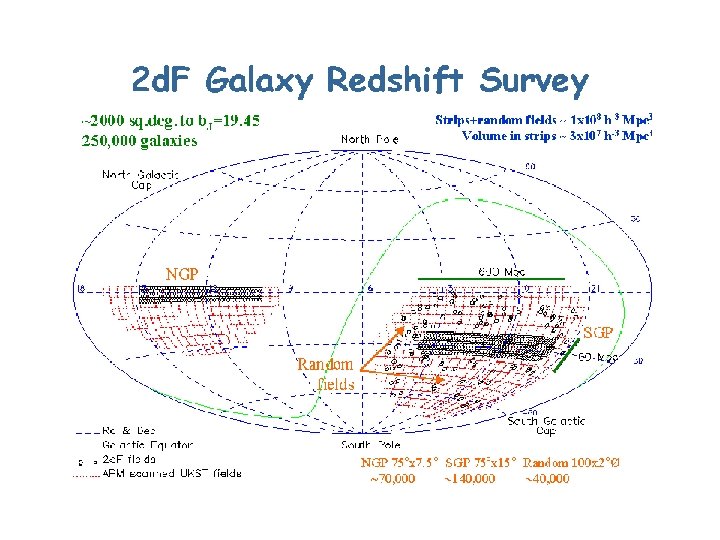
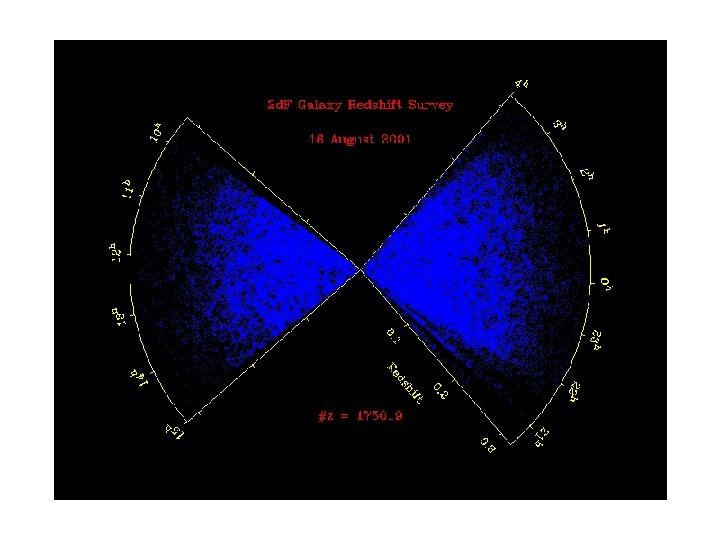
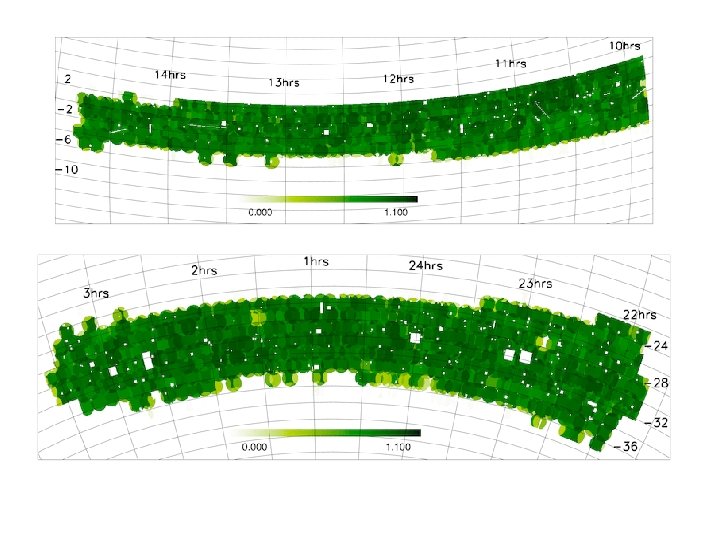
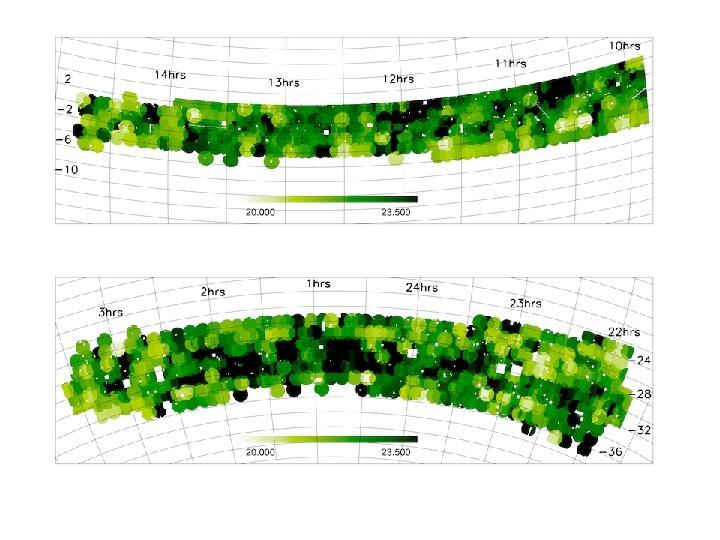
Redshift surveys –brief review • • CFA -----2000 galaxies (1983) Las Campanas ----25000 galaxies (1996) 2 d. F----250, 000 galaxies (2003) SDSS----900, 000 galaxies (2008? )
The role of different observations
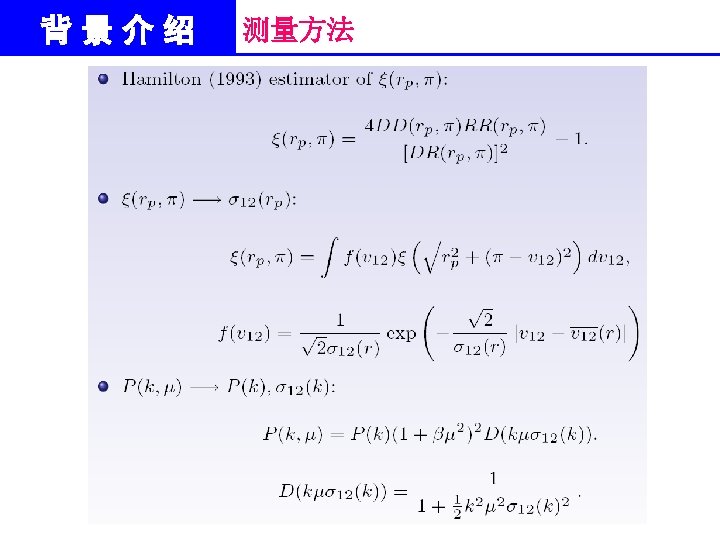
Clustering and environment analysis • The key is to account for the incompleteness correctly • For example, two-point correlation function is measured very simply with DD(r)/RR(r)1, where DD and RR are the number of pairs of galaxies in the observed sample and in the random sample respectively; • The key is to construct the random sample correctly
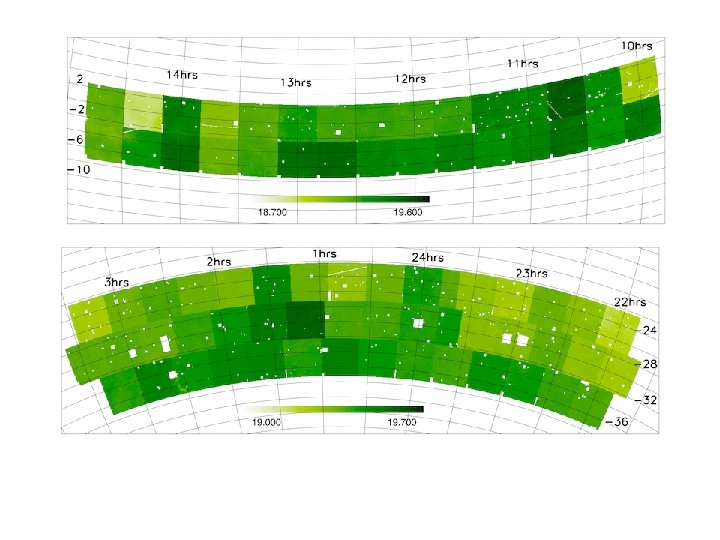
Incompleteness or selection effects • Magnitude limited sample----radial selection effect; • Limiting magnitude variation (0. 1 typically) across the survey region; • Survey boundary; • Redshift measurement completeness; – Sampling rate; – Magnitude dependent redshift incompleteness – Fiber collision
Random sample • A sample of the points randomly distributed spatially but with the same observational selection effects
Redshift two-point correlation functions for DR 2 (Li, C. et al. astroph/0509874; 0509873; see also Zehavi et al. 2005) 函红 数移 空 间 的 星 系 两 点 相 关
• Luminosity dependence of the bias (r_p=2. 7 Mpc/h; Zehavi et al. 2005) • Stellar mass dependence (Li, et al 2005 a, b) • 星系成团的幅度,即 偏袒因子b,随光度 (上图)和恒星质量 (下图)的变化。
Bimodal distribution in the colormagnitude diagram (SDSS)
Three ways of interpreting • Halo Occupation Distribution (HOD) model (e. g. Jing et al. 1998; Yang et al 2003) • Using galaxy formation models – Hydro/N-body simulations with star formation (physical processes; id of galaxies? e. g. V. Springel et al. 2005) – Semi-analytical models of galaxy formation + N-body simulations (e. g. Kauffmann et al. 1999)
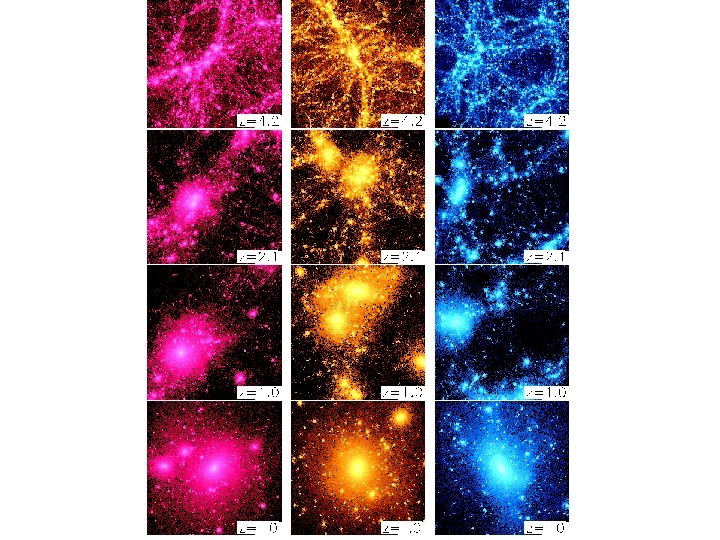
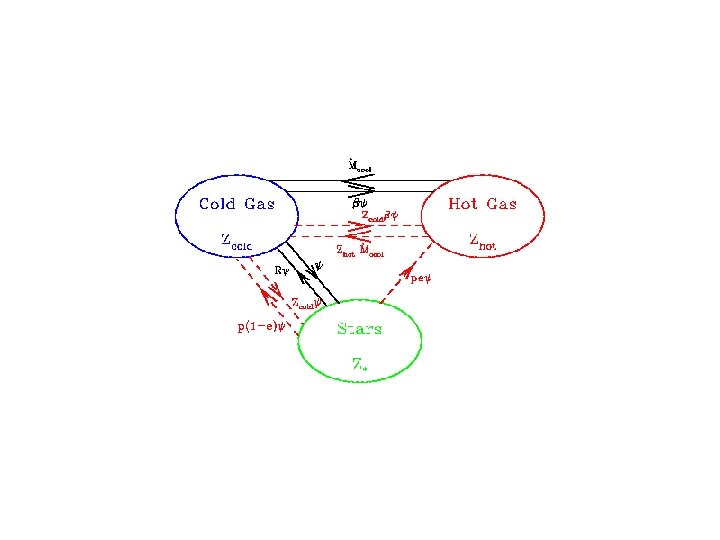
• • Physical processes of galaxy formation Formation of dark halos; gas shock heated; Gas cooled radiatively; Stars formed from cold gas; Massive stars short lived; form neutron stars and supernova explosions • Explosions inject energy and metals into interstellar medium (hot+cold); heating and enrich---feedback effects • Mergers of galaxies after their host halos merge; • Black hole formation and its AGN feedback
Dark matter Galaxies: red for E; blue for spirals
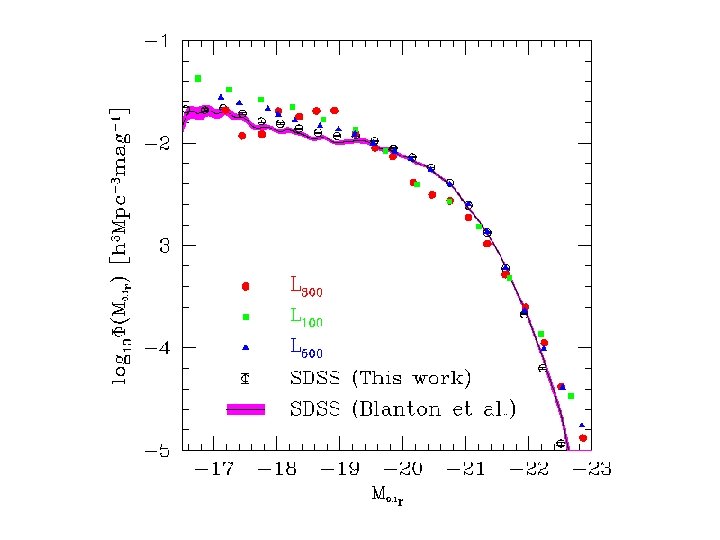
理论比较 构建SDSS的模拟样本 SDSS DR 4 L 500 L 100+L 300
Agreement after the reduction of faint satellites
Subhalo resolved: the bimodal color-mag distribution is much better reproduced
Summary • Main features of galaxies can be explained in current galaxy formation models; • High precision modeling for galaxy formation is still challenging, for very complicated physical process