CHAPTER 9 Tides Overview n n n Rhythmic


 – no continents. Water uniformly covers")


 n n Small horizontal forces push seawater into two bulges Opposite")
 It take 24 hours for the Earth to make one")

 Moon closer to Earth so lunar tide-producing force greater than that")


 Fig. 9. 13")
 and")


- Slides: 37
CHAPTER 9 Tides
Overview n n n Rhythmic rise and fall of sea level Very long and regular shallow-water waves Caused by gravitational attraction of Sun, Moon, and Earth
Weight n A measure of the pull of gravity
Gravity The force of attraction between two objects. The amount of force is determined by 1. The mass of the objects. The more massive the object the greater the force. 2. The distance between the objects. The greater the distance the less the force.
Gravity – Earth, Sun, & Moon Which is more massive? Sun Which is closer to the Earth? Moon Which has the greater gravitational effect on the earth? Moon
Assumptions The Earth is smooth (like a ball) – no continents. Water uniformly covers the Earth.
Gravitational forces n n n Every particle attracts every other particle Gravitational force proportional to product of masses Inversely proportional to square of separation distance Fig. 9. 2
Earth’s Tidal Bulge The Moon’s gravity pulls the water out to one side.
Centrifugal Force Centrifugal force is a force outward from the center of rotation
Center of Mutual Orbit If two objects have the same mass they will orbit about a point half way between them. This point is called the Center of Mass Center of Gravity or Barycenter
Earth’s Barycenter The Earth/Moon center of orbit is a point inside the surface of the Earth. But not the center of the Earth. It is the point of mutual orbit due to gravity and motion.
Earth/Moon Motion This is what the Earth/Moon orbit looks like. Notice how the Earth “Wobbles”.
Equilibrium Bulge The equilibrium bulge on the opposite side of the Earth from the Moon is caused by centrifugal force from the Earth’s Wobble.
The Tide is a Wave The tide is a wave and it has two crests and two troughs. The crest is high tide and the trough is low tide. Trough Low Tide High Tide Crest Trough Low Tide
Tidal bulges (lunar) n n Small horizontal forces push seawater into two bulges Opposite sides of Earth One bulge faces Moon Other bulge opposite side Fig. 9. 6 Earth
Tidal Day (Lunar Day) It take 24 hours for the Earth to make one rotation. But the Moon has moved. It takes an additional 50 minutes to get back to the Moon
Lunar Day n n n Moon orbits Earth 24 hours 50 minutes for observer to see subsequent Moons directly overhead High tides are 12 hours and 25 minutes apart Fig. 9. 7
Tidal bulges (lunar) Moon closer to Earth so lunar tide-producing force greater than that of Sun Tidal bulges (solar) Similar to lunar bulges but much smaller Moon closer to Earth
Spring Tide Sun & Moon Pull Together – New & Full Moon Greatest tidal range (Distance from high to low tide) Highest High Tide & Lowest Low Tide Time between spring tides about two weeks
Neap Tide Sun & Moon Pull At 90 o – Quarter Moons Least tidal range (Distance from High to Low tide) Lowest High Tide & Highest Low Tide
Idealized tide prediction n n Two high tides/two low tides per lunar day Six lunar hours between high and low tides
Complicating factors: Declination n Angular distance of the Moon or Sun above or below Earth’s equator Sun to Earth: 23. 5 o N or S of equator Moon to Earth: 28. 5 o N or S of equator n Shifts lunar and solar bulges away from the equator n Unequal tides Fig. 9. 11
Declination and tides n Unequal tides (unequal tidal ranges) Fig. 9. 13
Complicating factors: Elliptical Orbits n n n Tidal range greatest at perihelion (January) and perigee Tidal range least at aphelion (July) and apogee Perigee and apogee cycle 27. 5 days Fig. 9. 12
Real tides n n n Earth not covered completely by ocean Continents and friction with seafloor modify tidal bulges Tides are shallow water waves with speed determined by depth of water Tidal bulges cannot form (too slow) Tidal cells rotate around amphidromic point
Tidal cells in world ocean n n Cotidal lines Tide wave rotates once in 12 hours n Counterclockwise in Northern Hemisphere
Fig. 9. 14
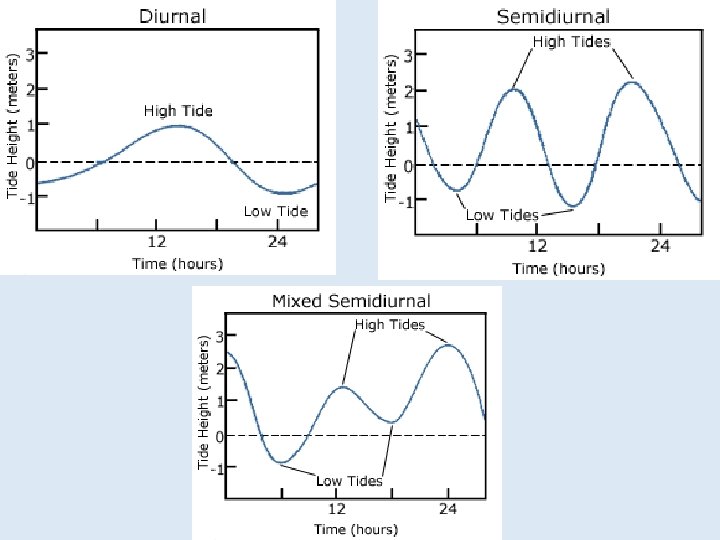
Tidal patterns n n n Diurnal – Gulf Coast n One high tide/one low tide per day Semidiurnal – East Coast (Virginia Beach) n Two high tides/two low tides per day n Tidal range about same (same height) Mixed - West Coast n Two high tides/two low tides per day n Tidal range different (not same height) n Most common
Tides in coastal waters n Standing waves n n n Tide waves reflected by coast Amplification of tidal range Example, Bay of Fundy maximum tidal range 17 m (56 ft)
Tides in coastal waters n Tidal bore in lowgradient rivers Fig. 9 A
Tidal Bore Surfing http: //www. youtube. com/watch? v=4 Zu. Zi. Lu. HM 1 A http: //www. youtube. com/watch? v=mr. Nc. ZUrg. Cr. M http: //video. google. com/videoplay? docid=713809622642491779&ei=92 i. S 7 Pr. Fp. KBlge. Kkf. SODQ&q=tidal+bore+video&hl=en# Wave http: //www. youtube. com/watch? v=gh. BPn 3 UDt 9 ghttp: //www. youtube. com/watch? v=gh. BPn 3 U Dt 9 g http: //www. youtube. com/watch? v=1 HMCK 6 w. Pg 8 E
Coastal Tidal Currents n n Reversing current High tide, Flood current seawater moves on shore Low tide, Ebb current seawater moves offshore High velocity flow in restricted channels
Coastal tidal currents n Whirlpool n Rapidly spinning seawater n Restricted channel connecting two basins with different tidal cycles Fig. 9. 19
Tides and marine life n n Fig. 9 C Tide pools and life Grunion spawning
Tide-generated power n n Renewable resource Does not produce power on demand Possible harmful environmental effects Most devices use tidal currents
End of CHAPTER 9 Tides