CHANGES to ECOSYSTEMS and POPULATIONS Population Fluctuations Natality
- Slides: 11
CHANGES to ECOSYSTEMS and POPULATIONS
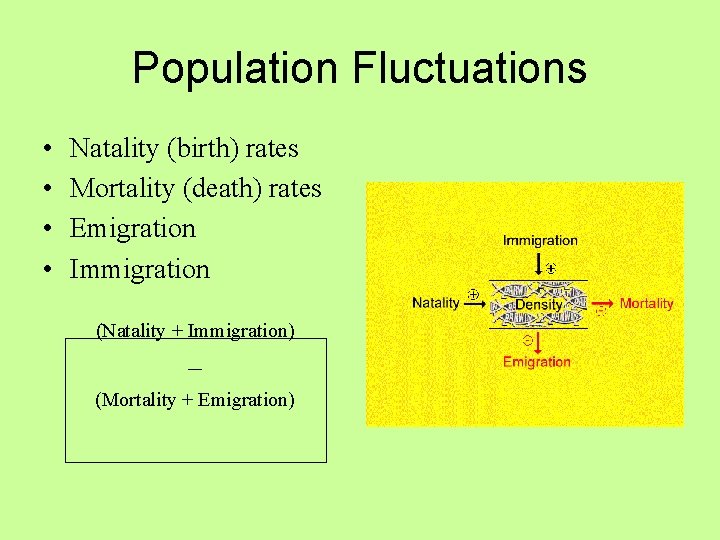
Population Fluctuations • • Natality (birth) rates Mortality (death) rates Emigration Immigration (Natality + Immigration) – (Mortality + Emigration)
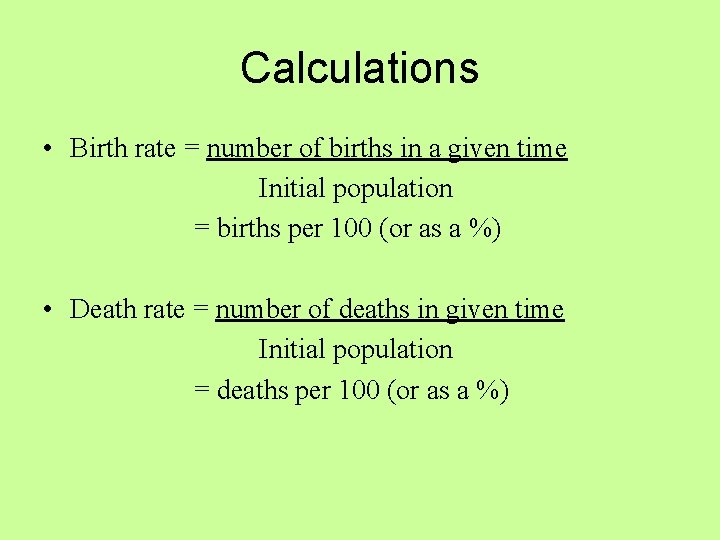
Calculations • Birth rate = number of births in a given time Initial population = births per 100 (or as a %) • Death rate = number of deaths in given time Initial population = deaths per 100 (or as a %)
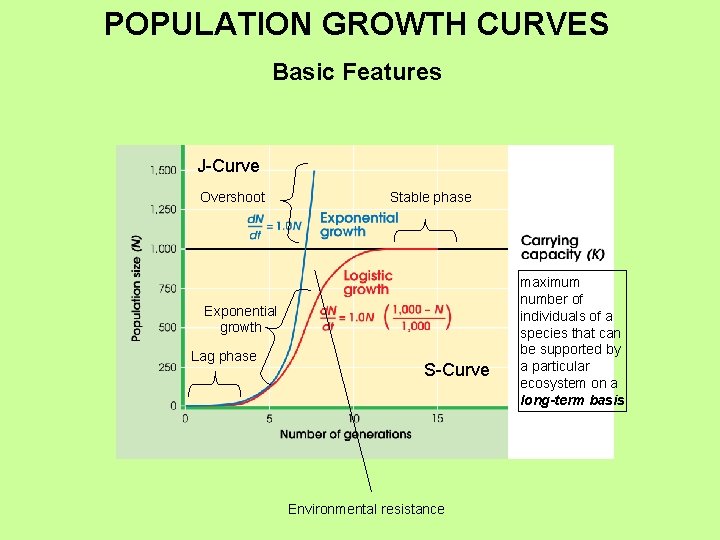
POPULATION GROWTH CURVES Basic Features J-Curve Overshoot Stable phase Exponential growth Lag phase S-Curve Environmental resistance maximum number of individuals of a species that can be supported by a particular ecosystem on a long-term basis
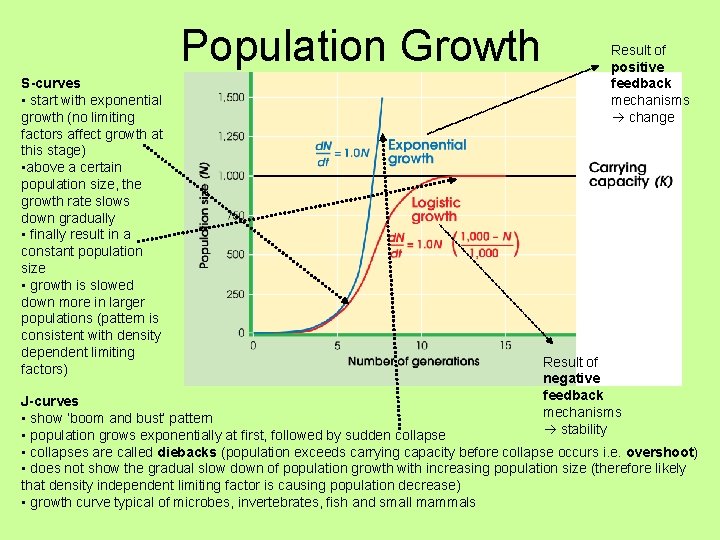
Population Growth S-curves • start with exponential growth (no limiting factors affect growth at this stage) • above a certain population size, the growth rate slows down gradually • finally result in a constant population size • growth is slowed down more in larger populations (pattern is consistent with density dependent limiting factors) Result of positive feedback mechanisms change Result of negative feedback mechanisms stability J-curves • show ‘boom and bust’ pattern • population grows exponentially at first, followed by sudden collapse • collapses are called diebacks (population exceeds carrying capacity before collapse occurs i. e. overshoot) • does not show the gradual slow down of population growth with increasing population size (therefore likely that density independent limiting factor is causing population decrease) • growth curve typical of microbes, invertebrates, fish and small mammals
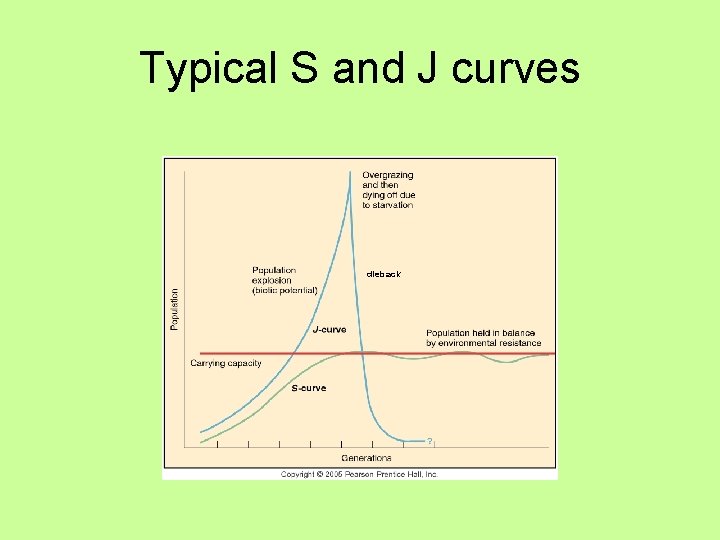
Typical S and J curves dieback
Carrying Capacity Carrying capacity can be determined by: • Examining the requirements of the species • Examining the available resources
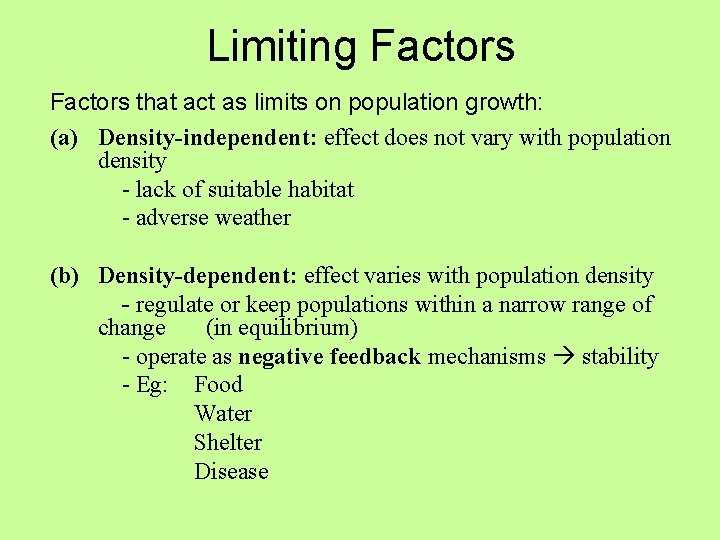
Limiting Factors that act as limits on population growth: (a) Density-independent: effect does not vary with population density - lack of suitable habitat - adverse weather (b) Density-dependent: effect varies with population density - regulate or keep populations within a narrow range of change (in equilibrium) - operate as negative feedback mechanisms stability - Eg: Food Water Shelter Disease
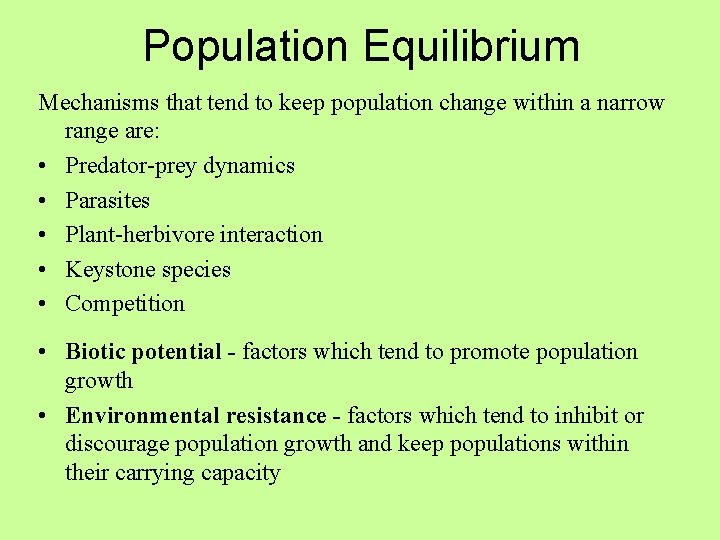
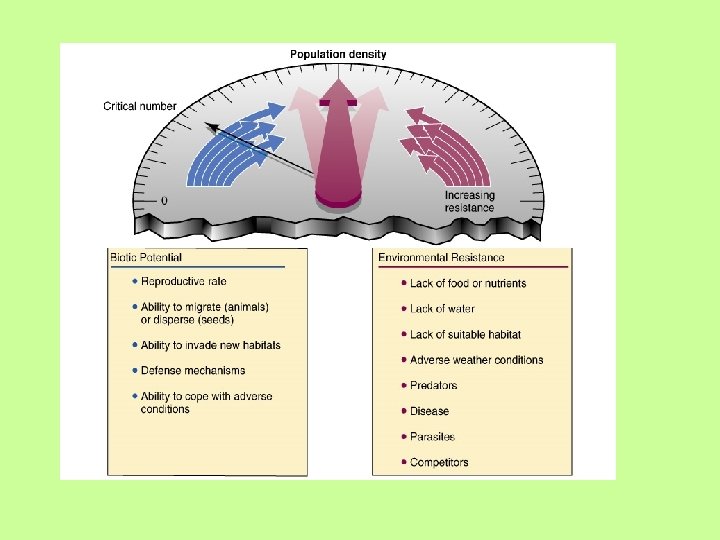
Population Equilibrium Mechanisms that tend to keep population change within a narrow range are: • Predator-prey dynamics • Parasites • Plant-herbivore interaction • Keystone species • Competition • Biotic potential - factors which tend to promote population growth • Environmental resistance - factors which tend to inhibit or discourage population growth and keep populations within their carrying capacity
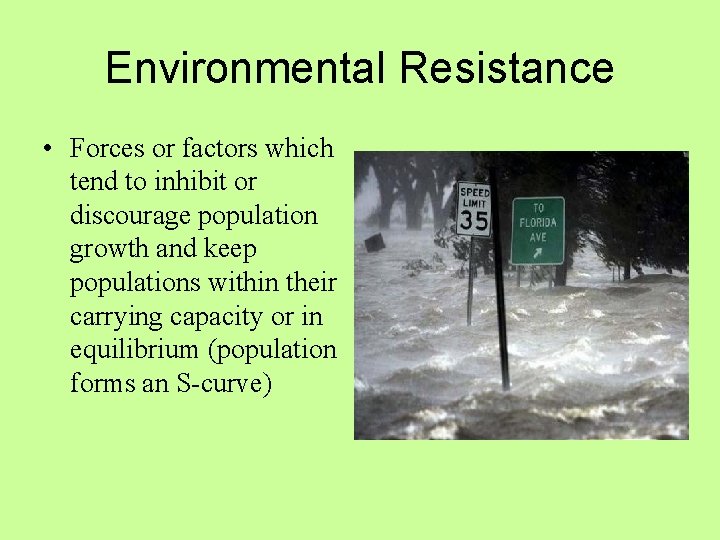
Environmental Resistance • Forces or factors which tend to inhibit or discourage population growth and keep populations within their carrying capacity or in equilibrium (population forms an S-curve)