Assessing Fire Damage and Erosion Potential in Forestland


 Vegetative Cover 2) Soil Type and Composition 3) Land Use/Land")
 A = R K LS C P")
 To find GIS data that can be used to measure")
 Once the erosivity numbers are determined for each data layer, the erosivity numbers")
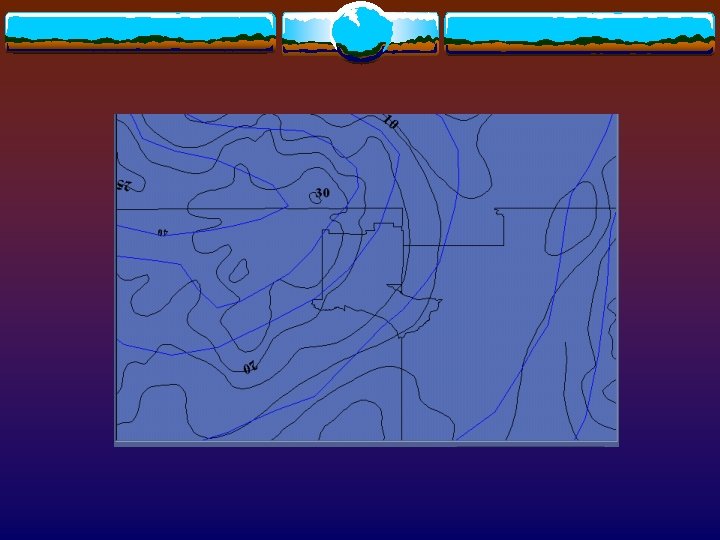
 Rainfall/Runoff- Climate Data from NMRGIS and USDA Water and Climate Center")
 Much of data has coarse resolution 2) Very general- soil erosion is")
- Slides: 13
Assessing Fire Damage and Erosion Potential in Forestland Affected by the Cerro Grande Wildfire of 2000 Rachel Anne Rebecca November 21, 2000
Smoke Plume from the Fire at Los Alamos, NM May 2000
The Cerro Grande Fire of 2000 Introduction
Where? Fires are NOT rare in this area- La Mesa Fire of 1977, Dome Fire 1996 The fire scorched a large area in the Jemez Mountains. Bandelier National Monument, Santa Fe National Forest, Los Alamos National Laboratory Lands, and Various Native American Reservations were all affected. 47, 650 acres burned
Source: Unknown
Source: National Park Service
Factors of Erosion 1) Vegetative Cover 2) Soil Type and Composition 3) Land Use/Land Cover 4) Climate 5) Geology 6) Elevation/Slope 7) Density of Large Animals
RUSLE EQUATION (Revised Universal Soil Loss Equation) A = R K LS C P Where A is the predicted average annual soil loss in tons per acre; R is the rainfall-runoff erosivity factor; K is the soil erodibility factor; L is the slope length factor; S is the slope steepness factor; C is the cover-management factor; P is the support practice factor.
Goals of Projects 1) To find GIS data that can be used to measure each variable in the RUSLE equation 2) Process and analyze the data 3) In each dataset (ex: climate or soils, etc. ), assign a erosivity number to each range of values (ex: amount of yearly precipitation) with higher numbers assigned to values of greater erosivity 4) Example: 500 mm/yr- 5; 400 mm/year- 4 because generally areas of higher annual precipitation will be more prone to erosion and runoff
4) Once the erosivity numbers are determined for each data layer, the erosivity numbers for each cell are going to be added up and that final number will determine a total erosion potential for each individual cell. 5) The erosion potential of the entire burned area will be mapped. 6) This will hopefully show in map form what areas are most prone to accelerated erosion from the fire.
Datasets Used 1) Rainfall/Runoff- Climate Data from NMRGIS and USDA Water and Climate Center 2) Soil Erodibility- SSURGO soil dataset 3) Slope- Digital Elevation Model from NMRGIS 1: 100, 000 4) Cover- Vegetation, Land Use/Land Cover Maps from GAPAnalysis Program and EPA 5) USGS Digital Raster Graphics
Limitations 1) Much of data has coarse resolution 2) Very general- soil erosion is much more complex than this model can allow for 3) Data Analysis takes awhile