Application of the Bootstrap Estimating a Population Mean

Application of the Bootstrap Estimating a Population Mean Movie Average Shot Lengths Sources: Barry Sands’ Average Shot Length Movie Database L. Chihara and T. Hesterberg (2011). Mathematical Statistics with Resampling and R. Wiley, Hoboken, NJ.
 for a population of 11001 films (Barry")
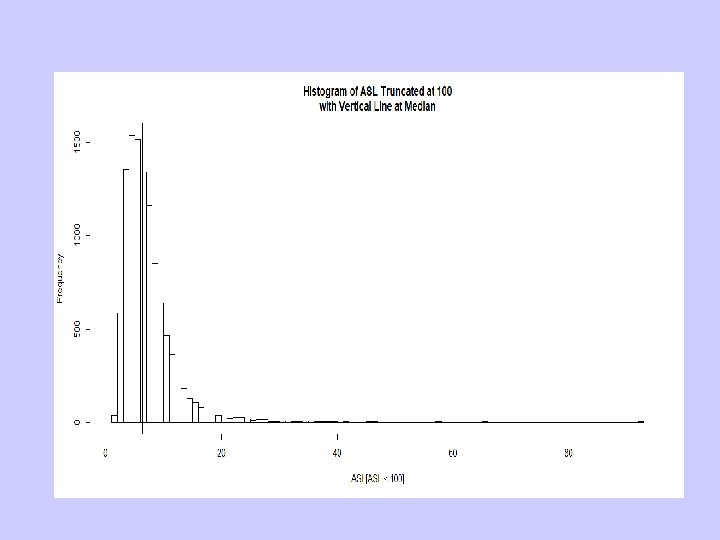
Data Description • Average Shot Length (seconds) for a population of 11001 films (Barry Sands’ movie database) • Very highly right-skewed population. • Min=1. 330 LQ=4. 510 Median=6. 400 UQ=8. 910 Max=1000 • m = 7. 739 s = 12. 765 • Coefficient of Variation: CV=100(12. 765/7. 739)=164. 94% • Goal: Small sample estimation of m with unknown smallsample sampling distribution of sample mean (in terms of shape)

Introduction to the Bootstrap • Makes use of a sample from a population to estimate the sampling distribution of a statistic/estimator. • Treats the sample as an “estimate” of the population of measurements (sample empirical cumulative distribution function as estimate of population cdf)
")
Population and Sample Empirical CDF’s (sample size: n=25)

Applying the Bootstrap • • Obtain a random sample of size n from the population Determine the estimator(s) of interest Compute the estimate(s) based on the sample: Determine B, the number of bootstrap samples to be taken Obtain B random samples of size n from the original sample with replacement Compute the estimate for each bootstrap sample: The bootstrap distribution is the collection of estimates The bootstrap standard error is the standard deviation of the estimates

Properties of the Bootstrap Sampling Distribution • Center: The center of the bootstrap sampling distribution is the estimate based on the full sample, not the population parameter it is estimating • Spread: The spread is representative of the spread of the estimator’s sampling distribution • Bias: Represents the difference between the center of the bootstrap sampling distribution and the true parameter the estimator is used for. The bootstrap bias estimate is accurate for the true bias. • Skewness: Skewness in bootstrap sampling distribution is representative of the skewness of the estimator’s sampling distribution
 • Interested in approximating the sampling distributions")
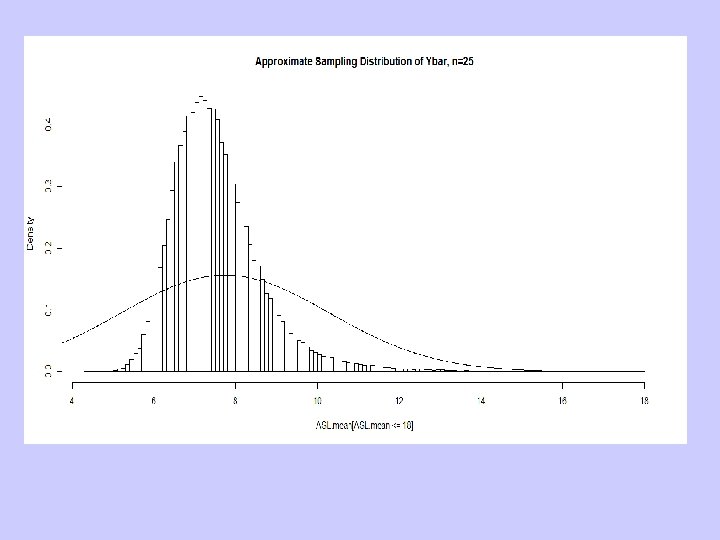
Example – Movie Average Shot Lengths (ASL) • Interested in approximating the sampling distributions of the sample mean. • Population value: m = 7. 739 • (Pseudo) Random sample of n=25 films’ ASLs: 4. 40 14. 98 7. 80 9. 50 6. 70 7. 50 9. 20 3. 70 8. 04 4. 47 9. 40 8. 88 5. 50 16. 30 6. 70 3. 65 4. 27 11. 60 9. 30 3. 40 2. 90 12. 00 16. 60

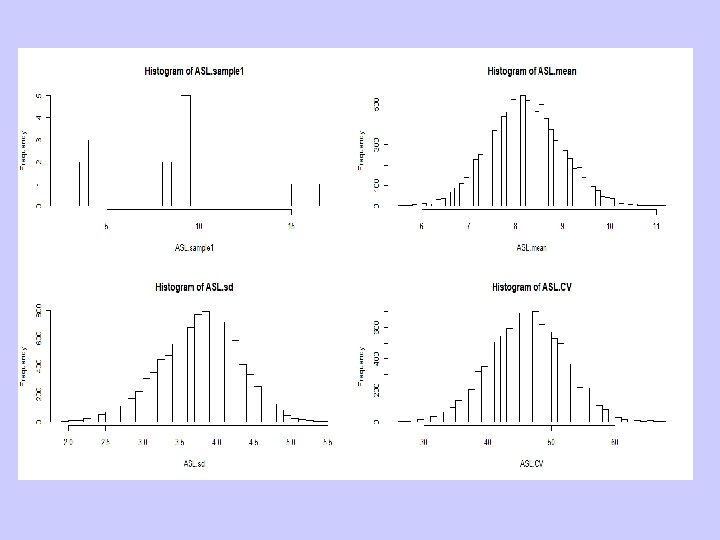
Bootstrap Samples • Taking B=10000 bootstrap samples from the original samples. • Summaries for original sample, mean, sd, CV: > summary(ASL. sample 1) Min. 1 st Qu. Median Mean 3 rd Qu. Max. 2. 900 4. 470 8. 040 8. 188 9. 500 16. 600 > summary(ASL. mean) Min. 1 st Qu. Median Mean 3 rd Qu. Max. 5. 560 7. 666 8. 182 8. 190 8. 687 11. 100 > summary(ASL. sd) Min. 1 st Qu. Median Mean 3 rd Qu. Max. 1. 916 3. 423 3. 800 3. 772 4. 137 5. 494 > summary(ASL. CV) Min. 1 st Qu. Median Mean 3 rd Qu. Max. 26. 19 42. 28 46. 19 46. 16 50. 13 67. 20

Bootstrap Standard Error and Sampling Distribution • In terms of the sampling distribution of the sample mean: § Mean of bootstrap sample means: 8. 1899 (Close to original sample mean (8. 1876), not so close to population mean (7. 7394). Bootstrap estimate of bias: 8. 1899 -8. 1876=0. 0023. § Bootstrap standard error: Standard deviation of the 10000 bootstrap sample means: 0. 7620. Bias/BSE=. 0023/. 7620=. 0030 (0. 30%) § Bootstrap 95 -percentile interval: (. 025, . 975) quantiles of the bootstrap mean sampling distribution: (6. 7444, 9. 7113) which does include the population mean (7. 739) § Note: Interval is of the following form (reflecting an asymmetric bootstrap sampling distribution:

Bootstrap t Confidence Interval for m

ASL Example

Comparison of 3 Methods – 95% CI for m • Repeat methods described previously, based on each of M=1000 random samples from the original population. • Obtain empirical coverage rates for each method based on the M=1000 random samples, with B=1000 bootstrap samples per random sample of n=25. • Method 1: (t-interval based on normality assumption): Coverage Probability: . 869 Average width: 5. 05 seconds • Method 2: Bootstrap Percentile Interval: Coverage Probability: . 849 Average width: 4. 40 seconds • Method 3: Bootstrap t Confidence Interval: Coverage Probability: . 903 Average width: 22. 23 seconds
- Slides: 15