2020 Coronavirus Survey Series Holly Kurtz Ph D
- Slides: 15
2020 Coronavirus Survey Series Holly Kurtz, Ph. D Director, Ed. Week Research Center
About the Ed. Week Research Center § Founded in 1997 § Nonprofit and nonpartisan § Director, Holly Kurtz, Ph. D, former education reporter, plus two staff members § Independent research arm of Editorial Projects in Education § Projects include: § EWA State of the Education Beat (2016 and 2020) § Quality Counts § Support for Ed. Week, Ed. Week Market Brief data journalism
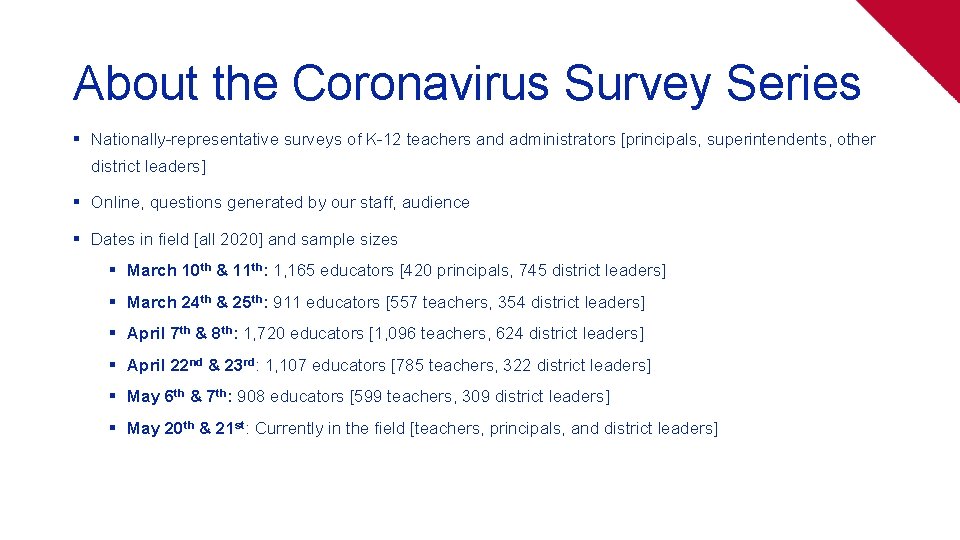
About the Coronavirus Survey Series § Nationally-representative surveys of K-12 teachers and administrators [principals, superintendents, other district leaders] § Online, questions generated by our staff, audience § Dates in field [all 2020] and sample sizes § March 10 th & 11 th: 1, 165 educators [420 principals, 745 district leaders] § March 24 th & 25 th: 911 educators [557 teachers, 354 district leaders] § April 7 th & 8 th: 1, 720 educators [1, 096 teachers, 624 district leaders] § April 22 nd & 23 rd: 1, 107 educators [785 teachers, 322 district leaders] § May 6 th & 7 th: 908 educators [599 teachers, 309 district leaders] § May 20 th & 21 st: Currently in the field [teachers, principals, and district leaders]
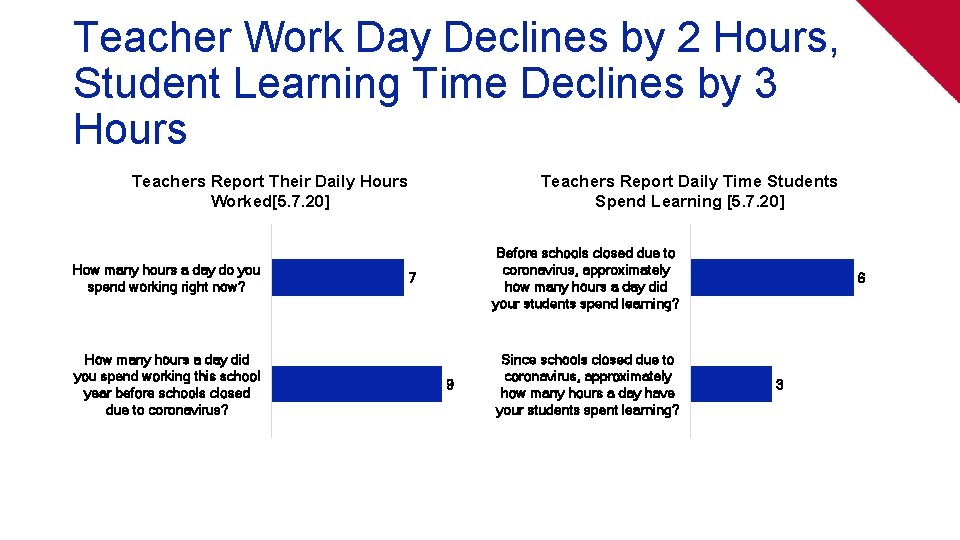
Teacher Work Day Declines by 2 Hours, Student Learning Time Declines by 3 Hours Teachers Report Their Daily Hours Worked[5. 7. 20] How many hours a day do you spend working right now? How many hours a day did you spend working this school year before schools closed due to coronavirus? Teachers Report Daily Time Students Spend Learning [5. 7. 20] Before schools closed due to coronavirus, approximately how many hours a day did your students spend learning? 7 9 Since schools closed due to coronavirus, approximately how many hours a day have your students spent learning? 6 3
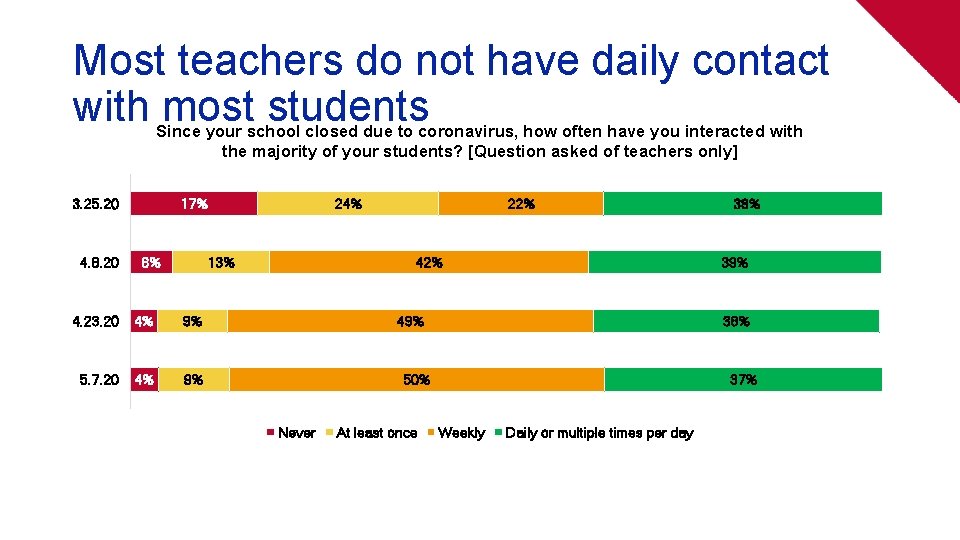
Most teachers do not have daily contact with most students Since your school closed due to coronavirus, how often have you interacted with the majority of your students? [Question asked of teachers only] 3. 25. 20 4. 8. 20 17% 6% 24% 13% 4. 23. 20 4% 9% 5. 7. 20 4% 9% 22% 42% 39% 49% 38% 50% Never At least once 38% 37% Weekly Daily or multiple times per day
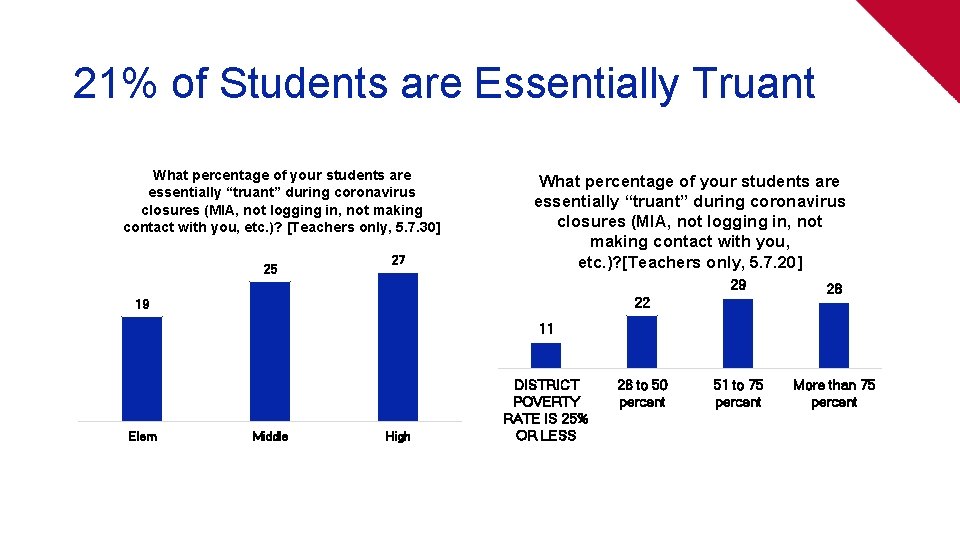
21% of Students are Essentially Truant What percentage of your students are essentially “truant” during coronavirus closures (MIA, not logging in, not making contact with you, etc. )? [Teachers only, 5. 7. 30] 25 27 What percentage of your students are essentially “truant” during coronavirus closures (MIA, not logging in, not making contact with you, etc. )? [Teachers only, 5. 7. 20] 29 28 51 to 75 percent More than 75 percent 22 19 11 Elem Middle High DISTRICT POVERTY RATE IS 25% OR LESS 26 to 50 percent
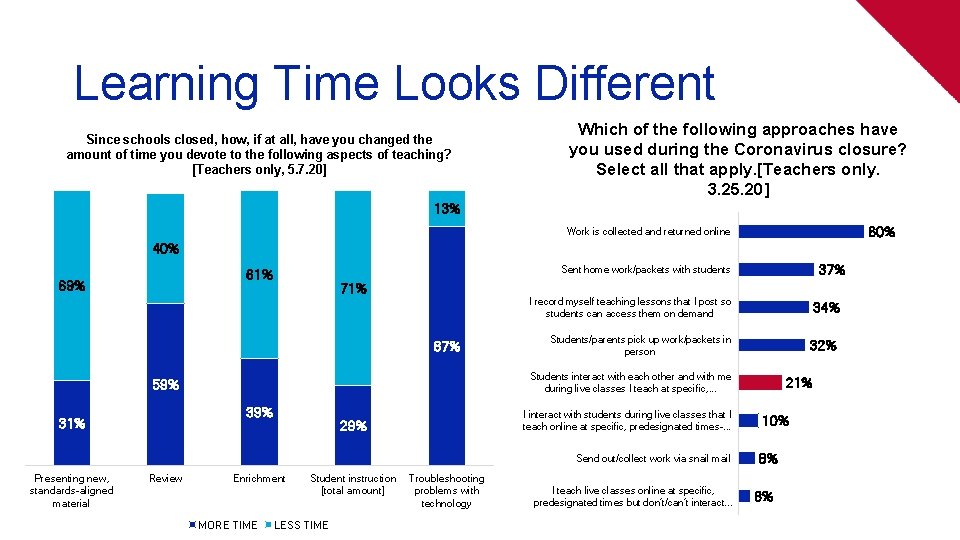
Learning Time Looks Different Since schools closed, how, if at all, have you changed the amount of time you devote to the following aspects of teaching? [Teachers only, 5. 7. 20] Which of the following approaches have you used during the Coronavirus closure? Select all that apply. [Teachers only. 3. 25. 20] 13% 60% Work is collected and returned online 40% 69% 71% I record myself teaching lessons that I post so students can access them on demand 87% Students/parents pick up work/packets in person 39% I interact with students during live classes that I teach online at specific, predesignated times-. . . 29% Send out/collect work via snail mail Presenting new, standards-aligned material Review 34% 32% Students interact with each other and with me during live classes I teach at specific, . . . 59% 31% 37% Sent home work/packets with students 61% Enrichment MORE TIME Student instruction [total amount] LESS TIME Troubleshooting problems with technology I teach live classes online at specific, predesignated times but don’t/can’t interact. . . 21% 10% 8% 6%
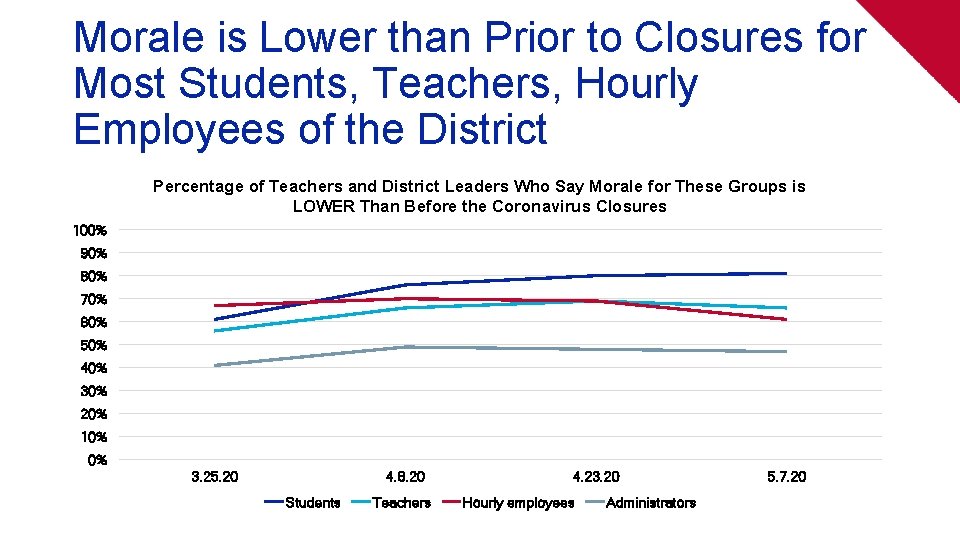
Morale is Lower than Prior to Closures for Most Students, Teachers, Hourly Employees of the District Percentage of Teachers and District Leaders Who Say Morale for These Groups is LOWER Than Before the Coronavirus Closures 100% 90% 80% 70% 60% 50% 40% 30% 20% 10% 0% 3. 25. 20 4. 8. 20 Students Teachers 4. 23. 20 Hourly employees Administrators 5. 7. 20
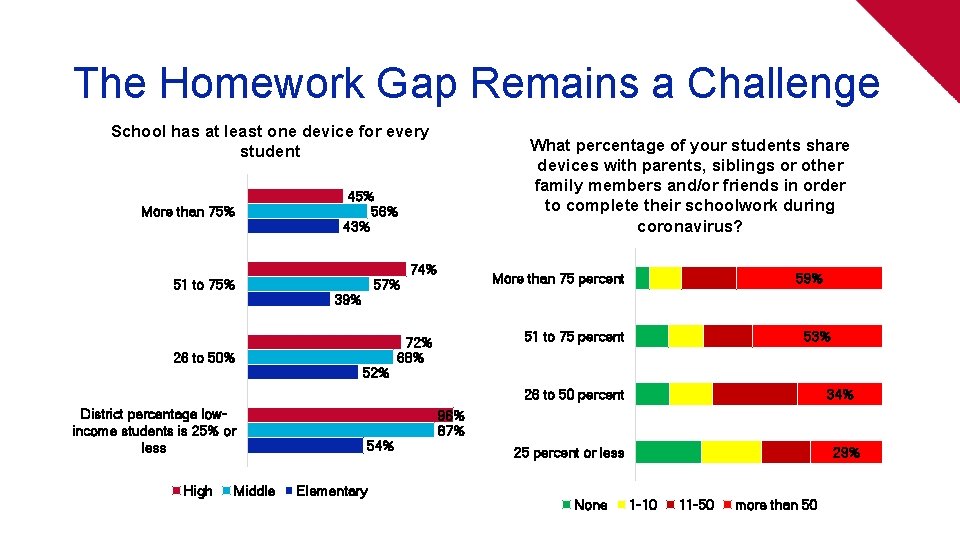
The Homework Gap Remains a Challenge School has at least one device for every student More than 75% 51 to 75% 26 to 50% What percentage of your students share devices with parents, siblings or other family members and/or friends in order to complete their schoolwork during coronavirus? 45% 56% 43% 57% 39% 52% 74% More than 75 percent 59% 51 to 75 percent 72% 68% 53% 26 to 50 percent District percentage lowincome students is 25% or less High Middle 54% Elementary 34% 96% 87% 25 percent or less None 29% 1 -10 11 -50 more than 50
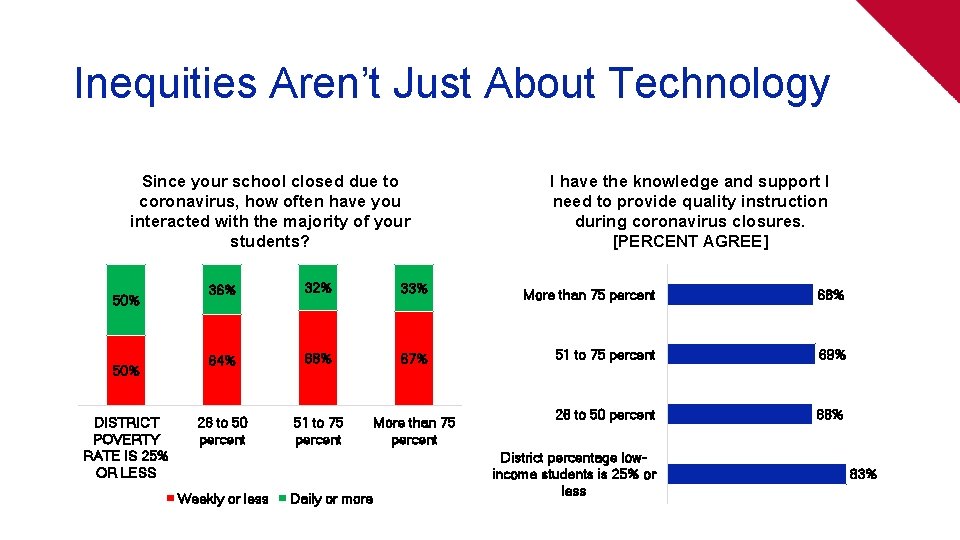
Inequities Aren’t Just About Technology Since your school closed due to coronavirus, how often have you interacted with the majority of your students? 50% DISTRICT POVERTY RATE IS 25% OR LESS I have the knowledge and support I need to provide quality instruction during coronavirus closures. [PERCENT AGREE] 36% 32% 33% More than 75 percent 68% 64% 68% 67% 51 to 75 percent 69% 26 to 50 percent 51 to 75 percent More than 75 percent 26 to 50 percent 68% Weekly or less Daily or more District percentage lowincome students is 25% or less 83%
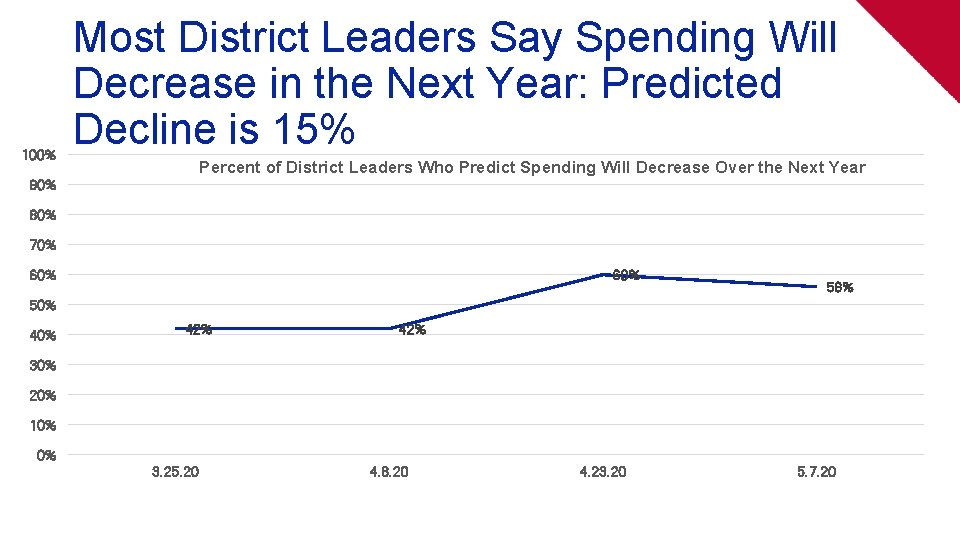
100% Most District Leaders Say Spending Will Decrease in the Next Year: Predicted Decline is 15% Percent of District Leaders Who Predict Spending Will Decrease Over the Next Year 90% 80% 70% 60% 56% 50% 42% 42% 30% 20% 10% 0% 3. 25. 20 4. 8. 20 4. 23. 20 5. 7. 20
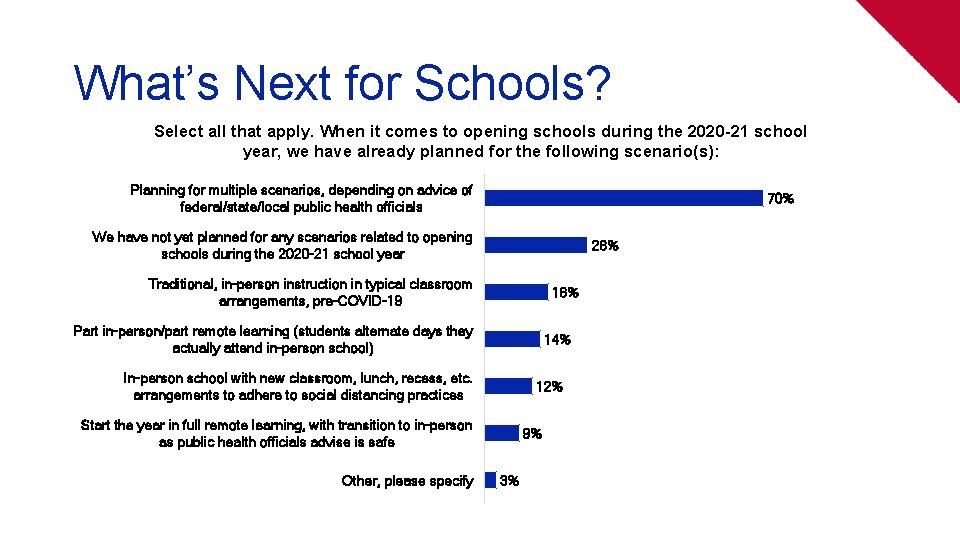
What’s Next for Schools? Select all that apply. When it comes to opening schools during the 2020 -21 school year, we have already planned for the following scenario(s): Planning for multiple scenarios, depending on advice of federal/state/local public health officials 70% We have not yet planned for any scenarios related to opening schools during the 2020 -21 school year 26% Traditional, in-person instruction in typical classroom arrangements, pre-COVID-19 16% Part in-person/part remote learning (students alternate days they actually attend in-person school) 14% In-person school with new classroom, lunch, recess, etc. arrangements to adhere to social distancing practices 12% Start the year in full remote learning, with transition to in-person as public health officials advise is safe Other, please specify 9% 3%
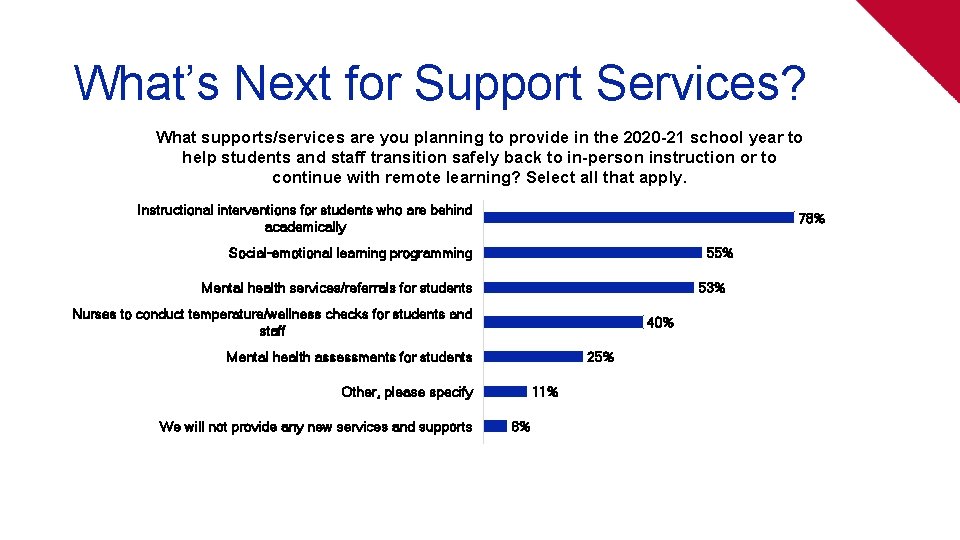
What’s Next for Support Services? What supports/services are you planning to provide in the 2020 -21 school year to help students and staff transition safely back to in-person instruction or to continue with remote learning? Select all that apply. Instructional interventions for students who are behind academically 78% Social-emotional learning programming 55% Mental health services/referrals for students 53% Nurses to conduct temperature/wellness checks for students and staff 40% Mental health assessments for students Other, please specify We will not provide any new services and supports 25% 11% 6%
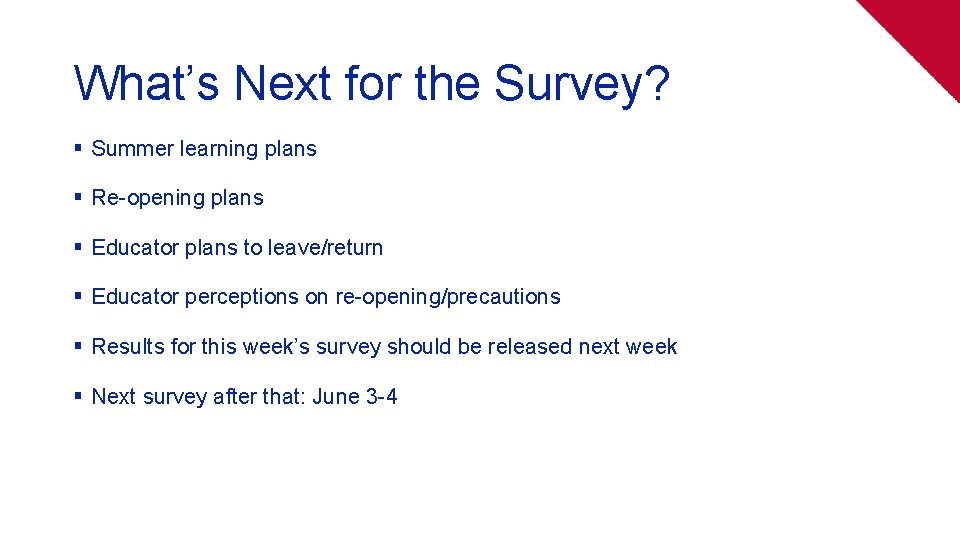
What’s Next for the Survey? § Summer learning plans § Re-opening plans § Educator plans to leave/return § Educator perceptions on re-opening/precautions § Results for this week’s survey should be released next week § Next survey after that: June 3 -4
Holly Kurtz hkurtz@educationweek. org