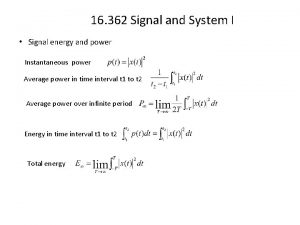
16 362 Signal and System I Magnitudephase representation
- Slides: 12
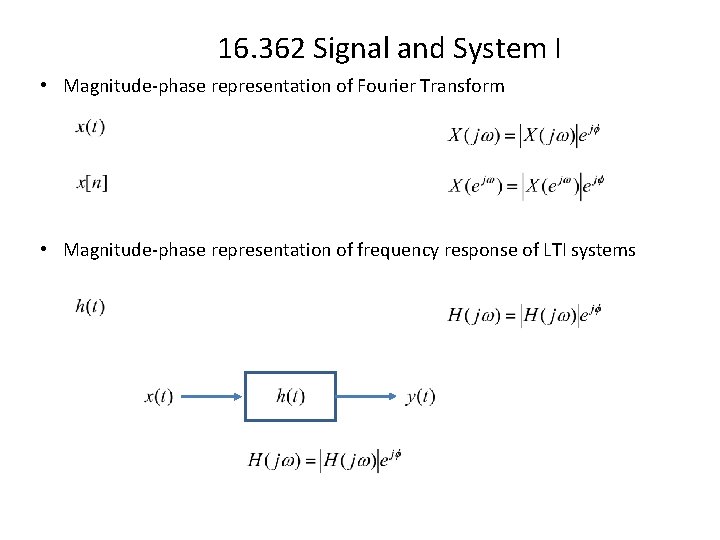
16. 362 Signal and System I • Magnitude-phase representation of Fourier Transform • Magnitude-phase representation of frequency response of LTI systems
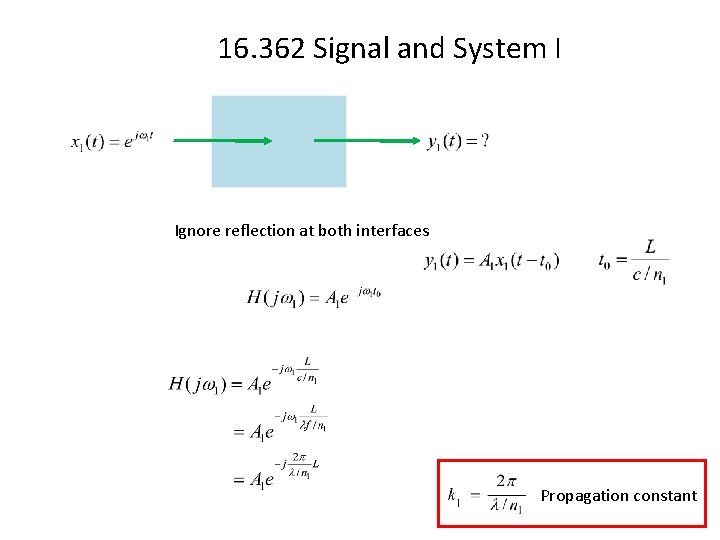
16. 362 Signal and System I Ignore reflection at both interfaces Propagation constant
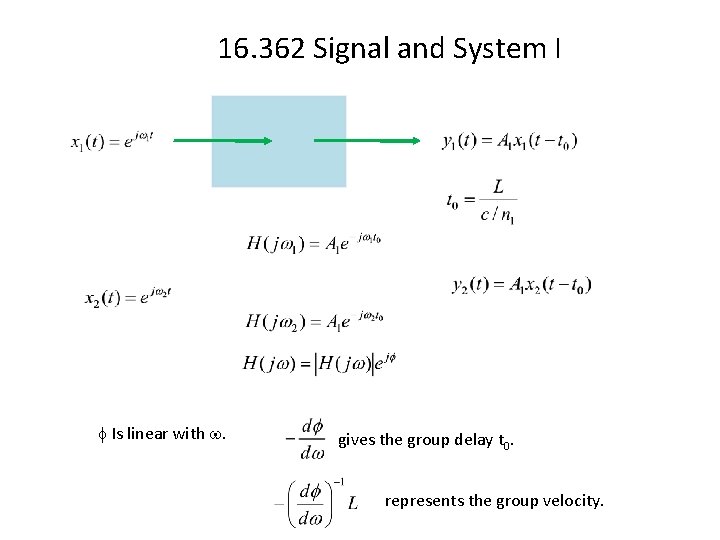
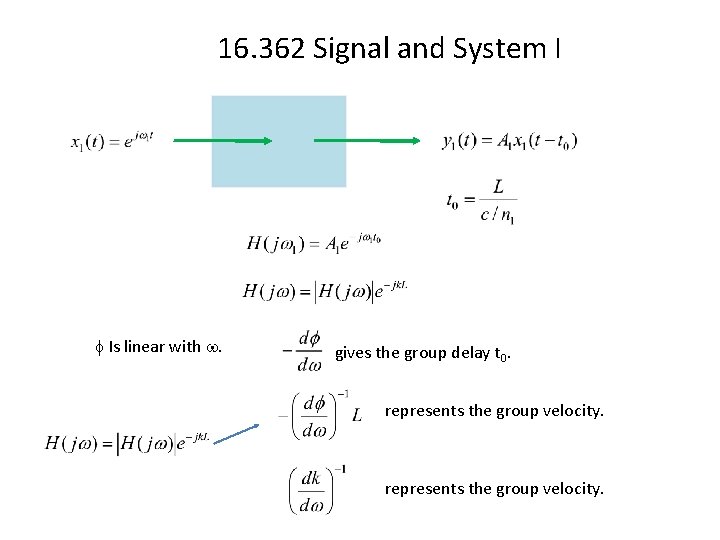
16. 362 Signal and System I Is linear with . gives the group delay t 0. represents the group velocity.
16. 362 Signal and System I Is linear with . gives the group delay t 0. represents the group velocity.
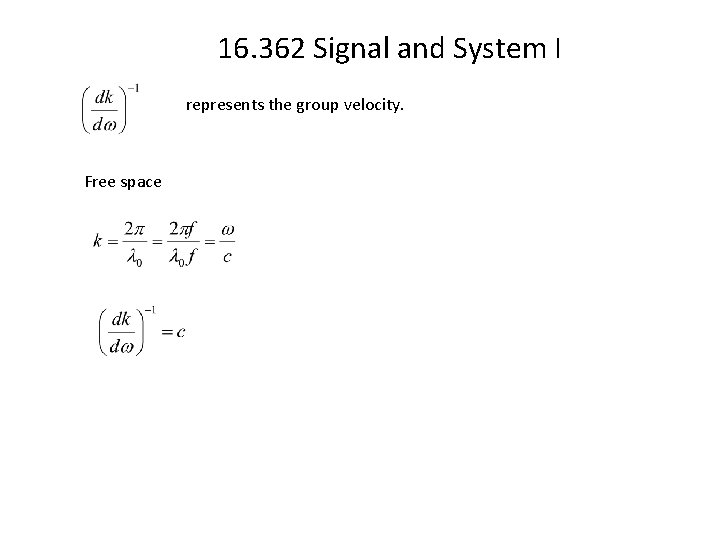
16. 362 Signal and System I represents the group velocity. Free space
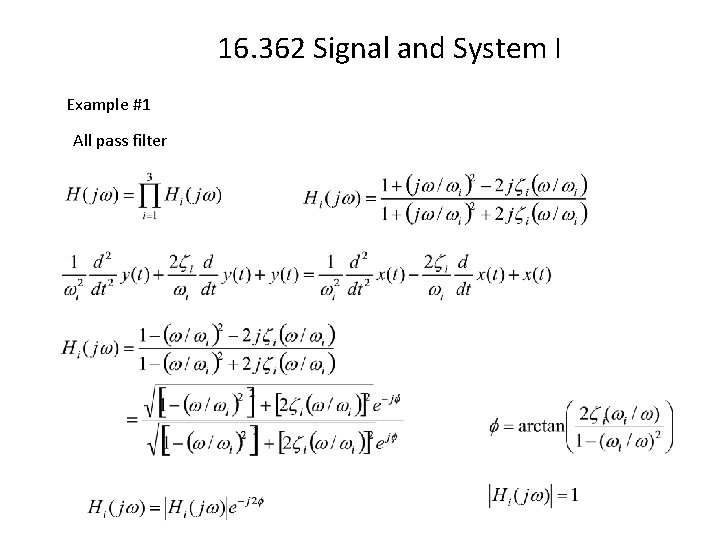
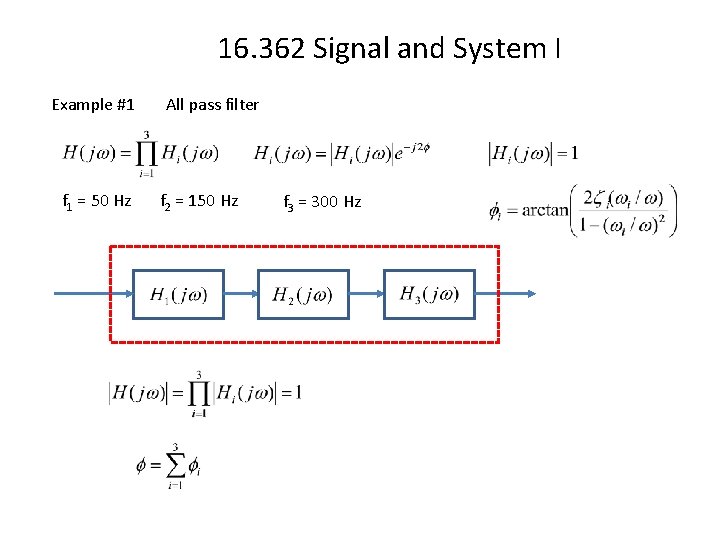
16. 362 Signal and System I Example #1 All pass filter
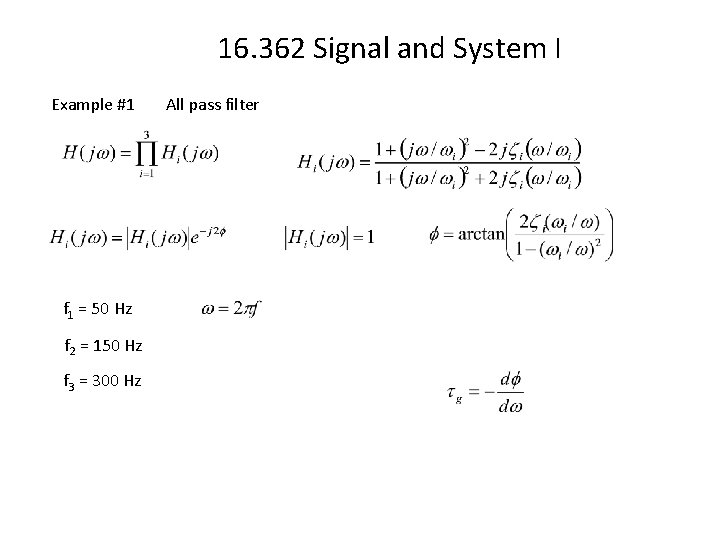
16. 362 Signal and System I Example #1 f 1 = 50 Hz f 2 = 150 Hz f 3 = 300 Hz All pass filter
16. 362 Signal and System I Example #1 f 1 = 50 Hz All pass filter f 2 = 150 Hz f 3 = 300 Hz
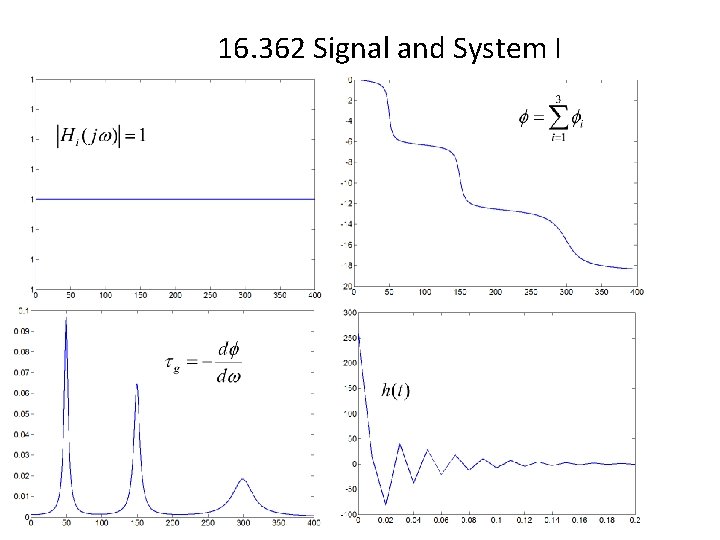
16. 362 Signal and System I
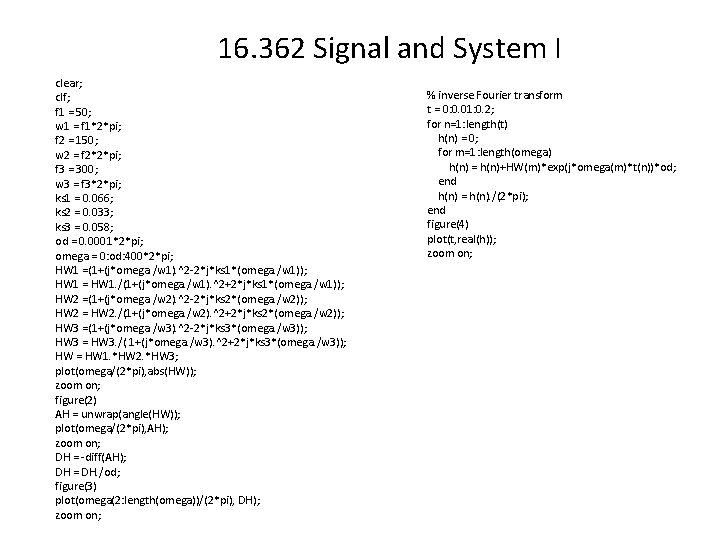
16. 362 Signal and System I clear; clf; f 1 = 50; w 1 = f 1*2*pi; f 2 = 150; w 2 = f 2*2*pi; f 3 = 300; w 3 = f 3*2*pi; ks 1 = 0. 066; ks 2 = 0. 033; ks 3 = 0. 058; od = 0. 0001*2*pi; omega = 0: od: 400*2*pi; HW 1 =(1+(j*omega. /w 1). ^2 -2*j*ks 1*(omega. /w 1)); HW 1 = HW 1. /(1+(j*omega. /w 1). ^2+2*j*ks 1*(omega. /w 1)); HW 2 =(1+(j*omega. /w 2). ^2 -2*j*ks 2*(omega. /w 2)); HW 2 = HW 2. /(1+(j*omega. /w 2). ^2+2*j*ks 2*(omega. /w 2)); HW 3 =(1+(j*omega. /w 3). ^2 -2*j*ks 3*(omega. /w 3)); HW 3 = HW 3. /( 1+(j*omega. /w 3). ^2+2*j*ks 3*(omega. /w 3)); HW = HW 1. *HW 2. *HW 3; plot(omega/(2*pi), abs(HW)); zoom on; figure(2) AH = unwrap(angle(HW)); plot(omega/(2*pi), AH); zoom on; DH = -diff(AH); DH = DH. /od; figure(3) plot(omega(2: length(omega))/(2*pi), DH); zoom on; % inverse Fourier transform t = 0: 0. 01: 0. 2; for n=1: length(t) h(n) = 0; for m=1: length(omega) h(n) = h(n)+HW(m)*exp(j*omega(m)*t(n))*od; end h(n) = h(n). /(2*pi); end figure(4) plot(t, real(h)); zoom on;
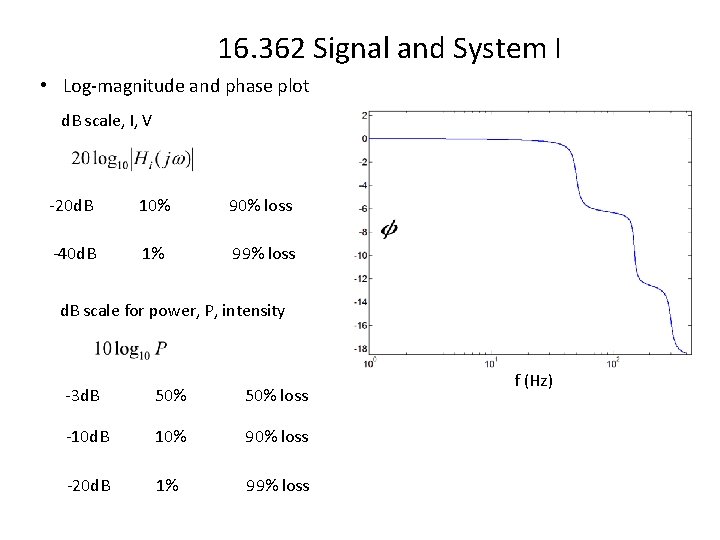
16. 362 Signal and System I • Log-magnitude and phase plot d. B scale, I, V -20 d. B 10% 90% loss -40 d. B 1% 99% loss d. B scale for power, P, intensity -3 d. B 50% loss -10 d. B 10% 90% loss -20 d. B 1% 99% loss f (Hz)
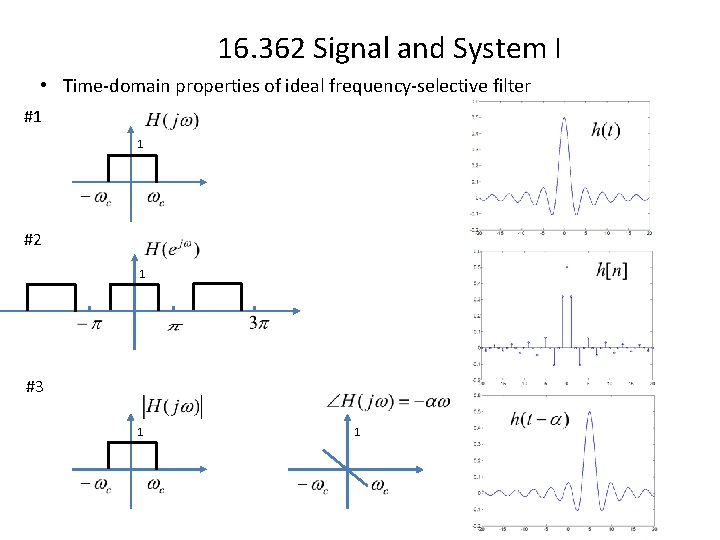
16. 362 Signal and System I • Time-domain properties of ideal frequency-selective filter #1 1 #2 1 #3 1 1