World Energy Resources To catalyze the potential of


")

- Slides: 10
World Energy Resources • To catalyze the potential of renewable energy sources into production line power requires two basic physical ingredients: – The raw resource – Infrastructure to export the resource as electricity
Renewable Potential is Variable
Survey of Energy Resources 2004 Oil 15 11 91 19 Europe North America Asia 34 42 Middle East Africa 9 South America Oceania R/P RATIO 41. 2 years RESERVES 148 Gt PRODUCTION 3. 5 Gt/year CONSUMPTION 3. 5 Gt/year
Survey of Energy Resources 2004 Natural Gas 56 >100 40 9 Europe North America 70 Asia 57 Middle East Africa 29 South America Oceania R/P RATIO 59. 8 years RESERVES 171 tcm PRODUCTION 2. 6 tcm/year CONSUMPTION 2. 6 tcm/year
Survey of Energy Resources 2004 Coal 247 255 258 Europe North America Asia 50 0. 4 20 Middle East Africa 79 South America Oceania RESERVES 909 Gt PRODUCTION 4. 8 Gt/year CONSUMPTION 4. 8 Gt/year
Survey of Energy Resources 2004 Hydropower: Usage/Potential (2002)
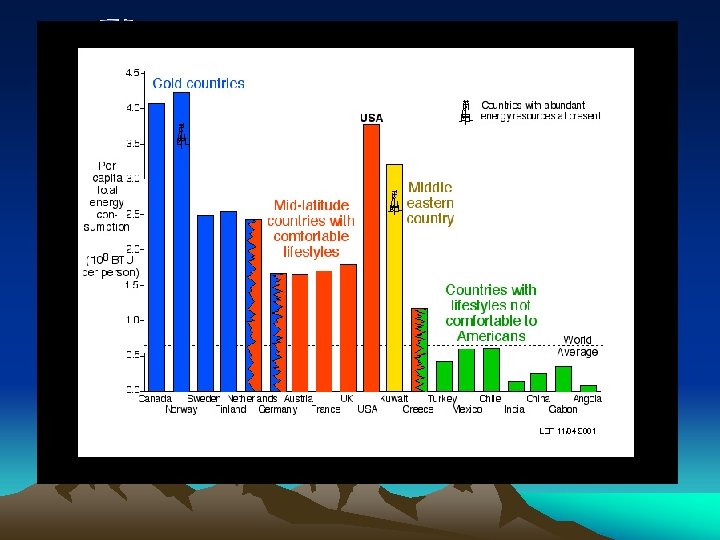
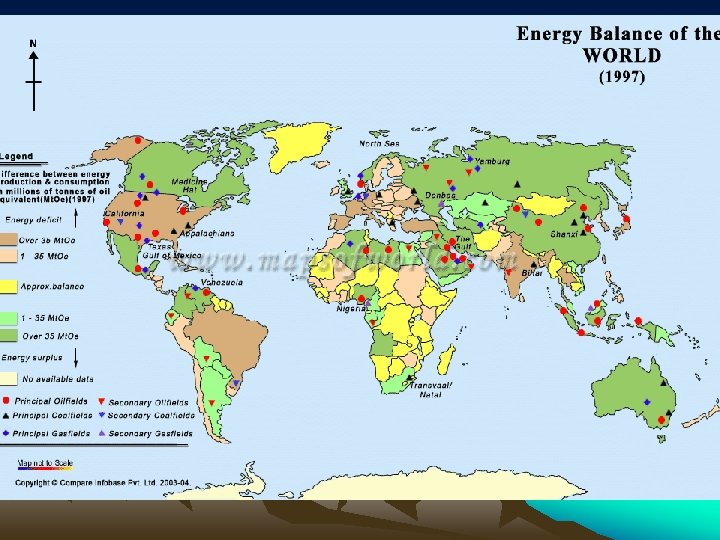
Conclusions • No shortage of global energy resources • R/P ratio for fossil fuels: – Oil 40 years – Natural Gas 60 years – Coal 200 years • Uneven distribution of strategic resources around the world • Consumption areas do not all coincide with production areas • Environmental issues/rules will play a strategic role in sustainable development • Substantial increase of non-hydro renewables, but total share only some 5% in 2030 (with wind and bioenergy the leading players)