While you wait Please enter the following data
- Slides: 20
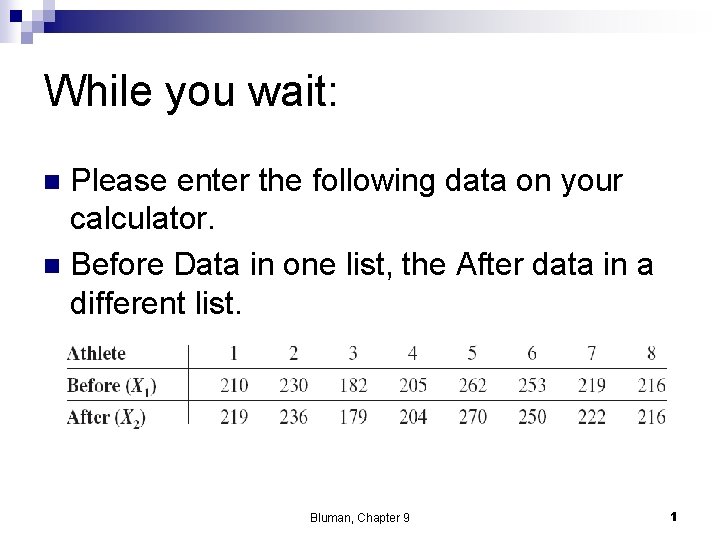
While you wait: Please enter the following data on your calculator. n Before Data in one list, the After data in a different list. n Bluman, Chapter 9 1
Testing the Difference Between Two Means: Dependent Samples Sec 9. 3 Bluman, Chapter 9 2
Dependent Samples n Samples are considered to be dependent samples when the subjects are paired or matched in some way.
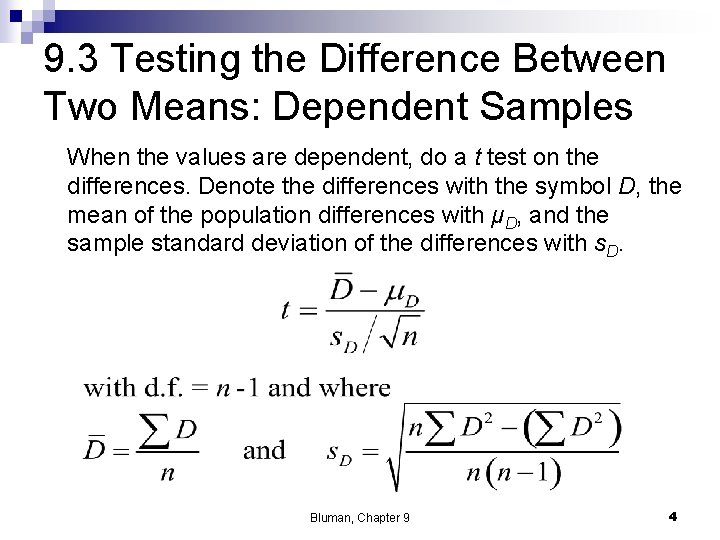
9. 3 Testing the Difference Between Two Means: Dependent Samples When the values are dependent, do a t test on the differences. Denote the differences with the symbol D, the mean of the population differences with μD, and the sample standard deviation of the differences with s. D. Bluman, Chapter 9 4
Some examples Medicine n Education n Fitness n Can you think of some? n
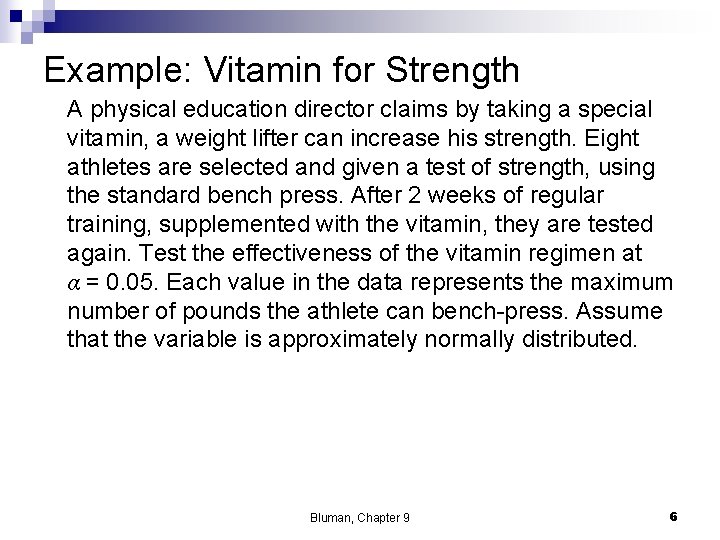
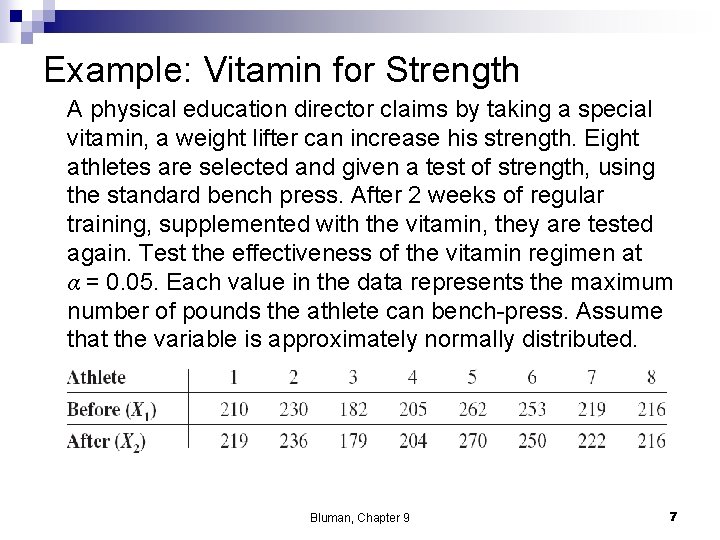
Example: Vitamin for Strength A physical education director claims by taking a special vitamin, a weight lifter can increase his strength. Eight athletes are selected and given a test of strength, using the standard bench press. After 2 weeks of regular training, supplemented with the vitamin, they are tested again. Test the effectiveness of the vitamin regimen at α = 0. 05. Each value in the data represents the maximum number of pounds the athlete can bench-press. Assume that the variable is approximately normally distributed. Bluman, Chapter 9 6
Example: Vitamin for Strength A physical education director claims by taking a special vitamin, a weight lifter can increase his strength. Eight athletes are selected and given a test of strength, using the standard bench press. After 2 weeks of regular training, supplemented with the vitamin, they are tested again. Test the effectiveness of the vitamin regimen at α = 0. 05. Each value in the data represents the maximum number of pounds the athlete can bench-press. Assume that the variable is approximately normally distributed. Bluman, Chapter 9 7
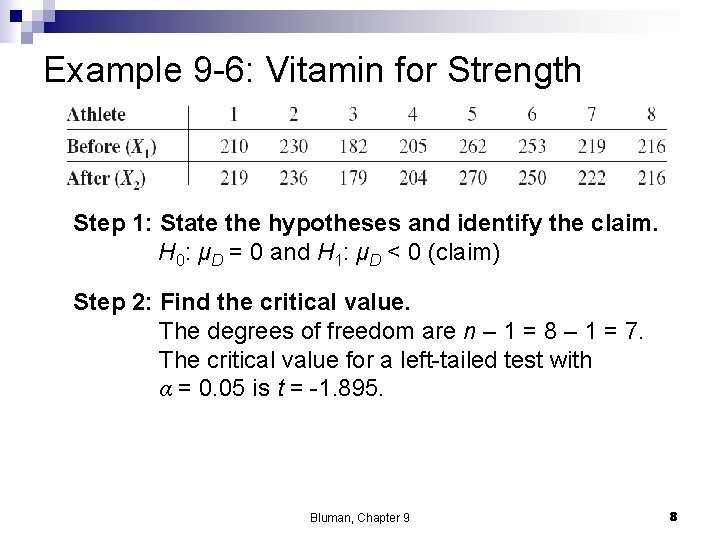
Example 9 -6: Vitamin for Strength Step 1: State the hypotheses and identify the claim. H 0: μD = 0 and H 1: μD < 0 (claim) Step 2: Find the critical value. The degrees of freedom are n – 1 = 8 – 1 = 7. The critical value for a left-tailed test with α = 0. 05 is t = -1. 895. Bluman, Chapter 9 8
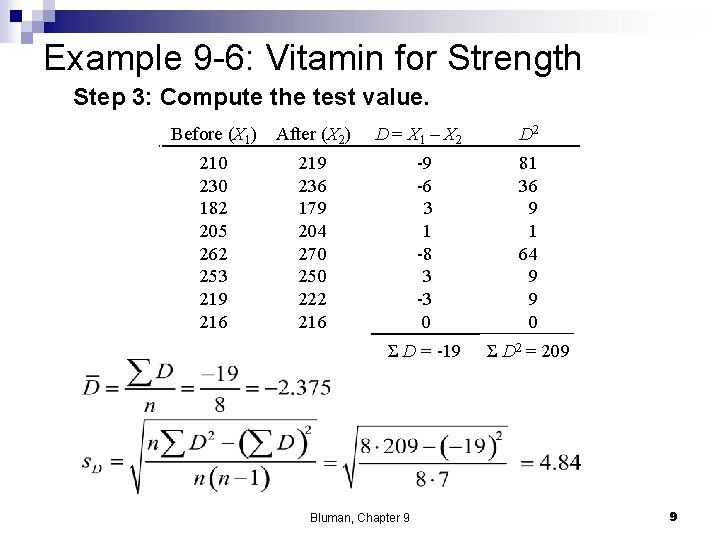
Example 9 -6: Vitamin for Strength Step 3: Compute the test value. Before (X 1) After (X 2) 210 230 182 205 262 253 219 216 D = X 1 – X 2 219 236 179 204 270 250 222 216 D 2 -9 -6 3 1 -8 3 -3 0 81 36 9 1 64 9 9 0 Σ D = -19 Σ D 2 = 209 Bluman, Chapter 9 9
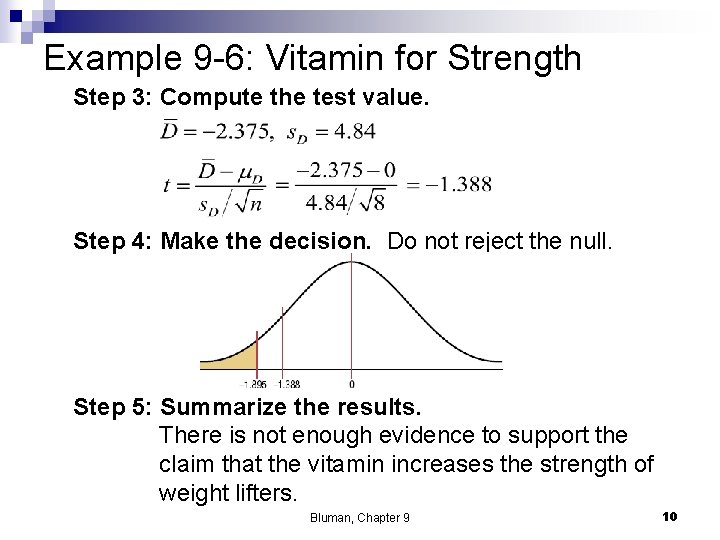
Example 9 -6: Vitamin for Strength Step 3: Compute the test value. Step 4: Make the decision. Do not reject the null. Step 5: Summarize the results. There is not enough evidence to support the claim that the vitamin increases the strength of weight lifters. Bluman, Chapter 9 10
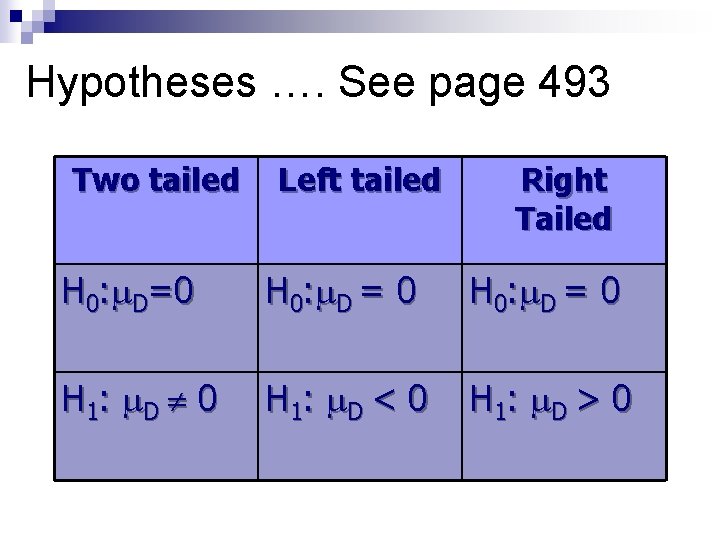
Hypotheses …. See page 493 Two tailed Left tailed Right Tailed H 0: D=0 H 0 : D = 0 H 1 : D < 0 H 1 : D > 0
Chapter 9 Testing the Difference Between Two Means, Two Proportions, and Two Variances Section 9 -3 Example 9 -7 Page #495 Bluman, Chapter 9 12
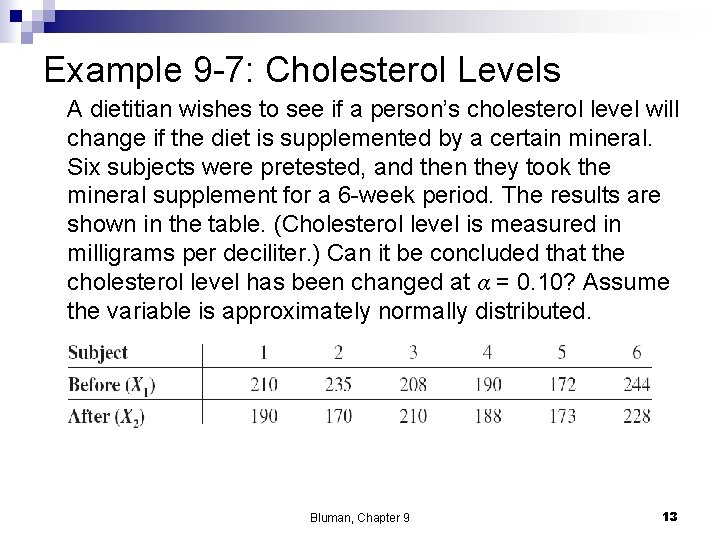
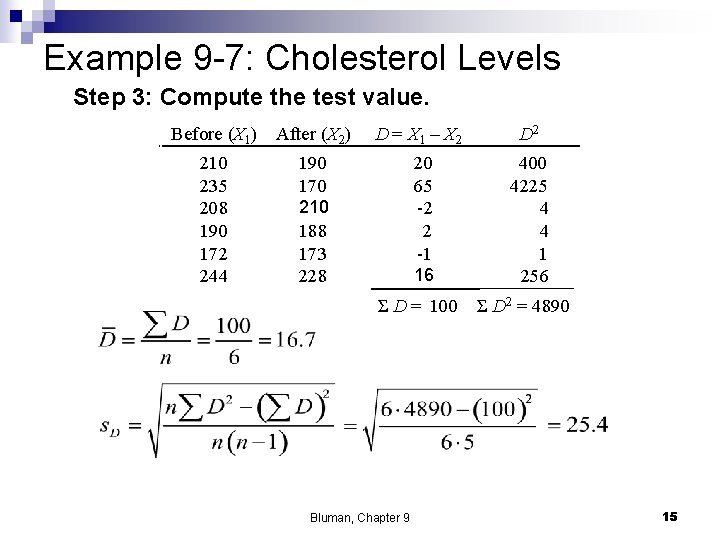
Example 9 -7: Cholesterol Levels A dietitian wishes to see if a person’s cholesterol level will change if the diet is supplemented by a certain mineral. Six subjects were pretested, and then they took the mineral supplement for a 6 -week period. The results are shown in the table. (Cholesterol level is measured in milligrams per deciliter. ) Can it be concluded that the cholesterol level has been changed at α = 0. 10? Assume the variable is approximately normally distributed. Bluman, Chapter 9 13
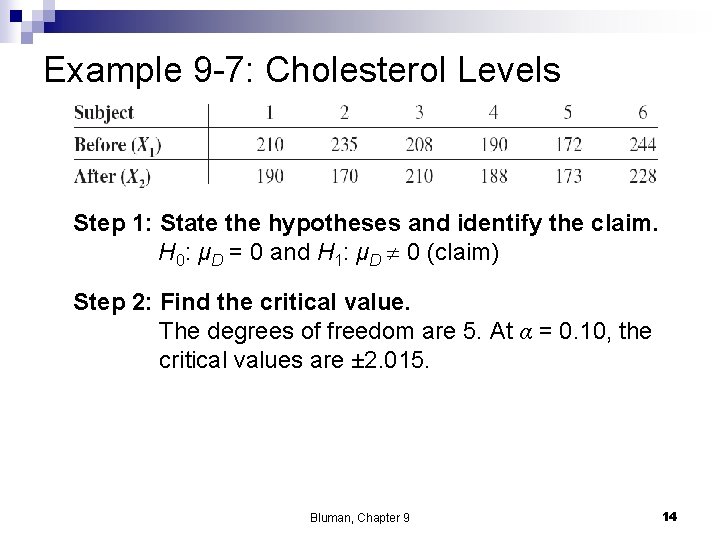
Example 9 -7: Cholesterol Levels Step 1: State the hypotheses and identify the claim. H 0: μD = 0 and H 1: μD 0 (claim) Step 2: Find the critical value. The degrees of freedom are 5. At α = 0. 10, the critical values are ± 2. 015. Bluman, Chapter 9 14
Example 9 -7: Cholesterol Levels Step 3: Compute the test value. Before (X 1) After (X 2) 210 235 208 190 172 244 D = X 1 – X 2 D 2 20 65 -2 2 -1 400 4225 4 4 1 256 190 170 210 188 173 228 16 Σ D = 100 Σ D 2 = 4890 Bluman, Chapter 9 15
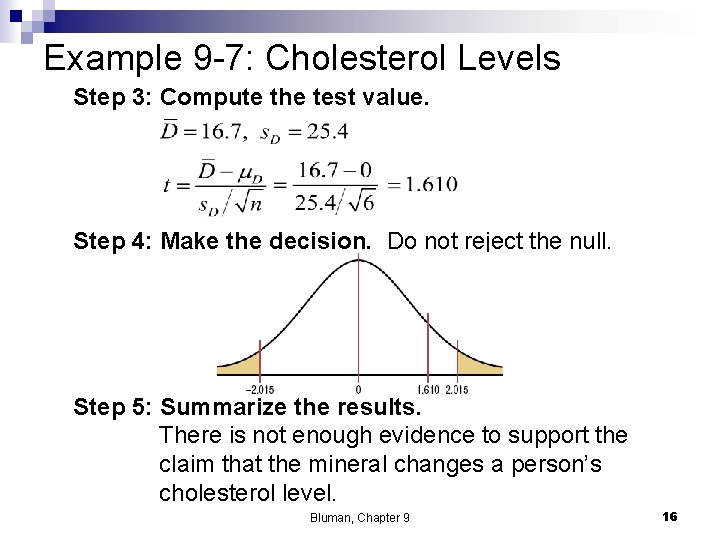
Example 9 -7: Cholesterol Levels Step 3: Compute the test value. Step 4: Make the decision. Do not reject the null. Step 5: Summarize the results. There is not enough evidence to support the claim that the mineral changes a person’s cholesterol level. Bluman, Chapter 9 16
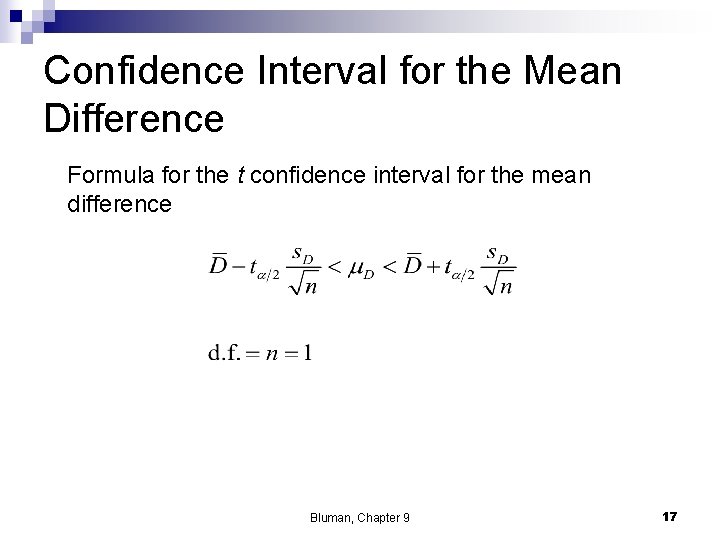
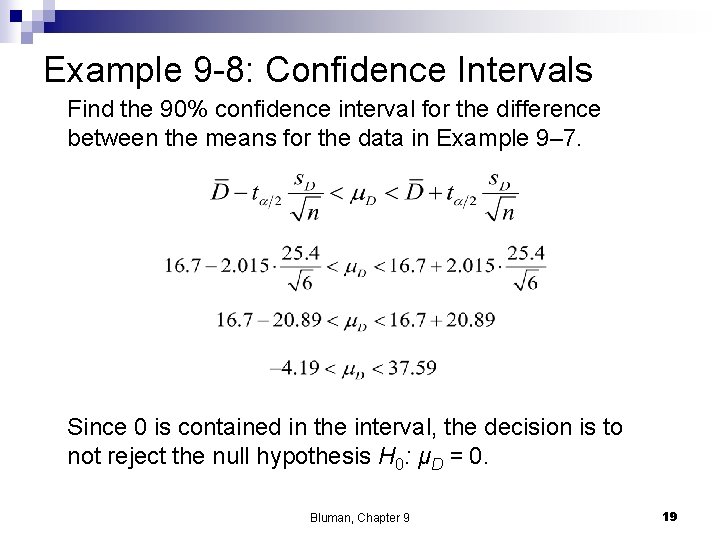
Confidence Interval for the Mean Difference Formula for the t confidence interval for the mean difference Bluman, Chapter 9 17
Chapter 9 Testing the Difference Between Two Means, Two Proportions, and Two Variances Section 9 -3 Example 9 -8 Page #498 Bluman, Chapter 9 18
Example 9 -8: Confidence Intervals Find the 90% confidence interval for the difference between the means for the data in Example 9– 7. Since 0 is contained in the interval, the decision is to not reject the null hypothesis H 0: μD = 0. Bluman, Chapter 9 19
On your own n n Study the examples in section 9. 3 Calculator instructions: on page 502 n n Sec 9. 3 page 500 #1 -9 odds Bluman, Chapter 9 20