WELCOME Improvement in trade exchanges of Sino Turkey

- Slides: 22
WELCOME Improvement in trade exchanges of Sino -Turkey, promotes Turkish agricultural development 2 nd Eastern Europe Crop Protection Forum & International Agrochemical Exhibition in Turkey 20. 2. 2021
by Sezin Tezcan R&D Manager DOĞAL KİMYEVİ MADDELER VE ZİRAİ İLAÇLAR SAN. VE TİC. AŞ 20. 2. 2021
AGENDA 20. 2. 2021
v Turkey vs China v Crop Distribution in Turkey v Turkey-total agriculture potential v Regional Development Projects 20. 2. 2021
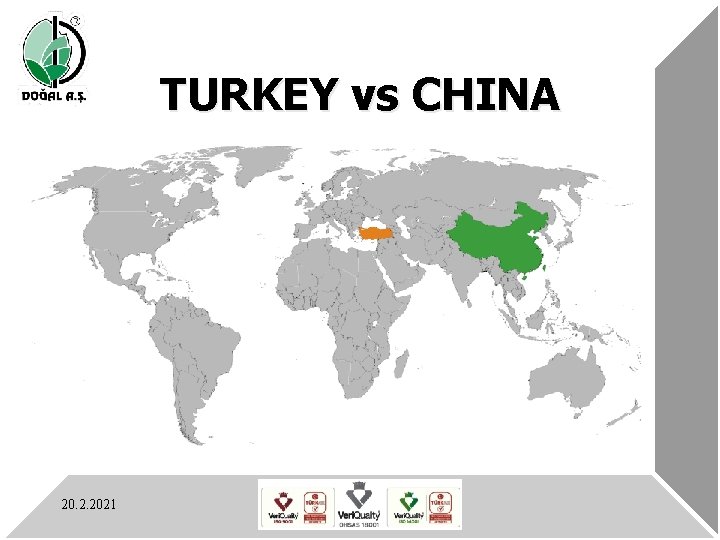
TURKEY vs CHINA 20. 2. 2021
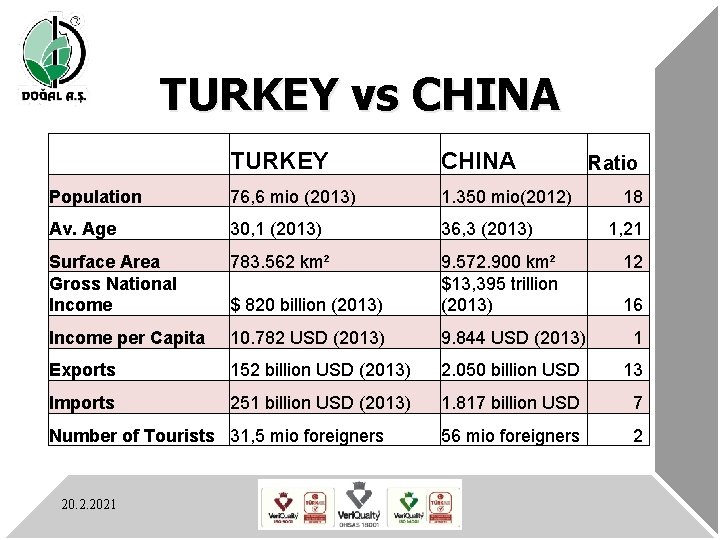
TURKEY vs CHINA TURKEY CHINA Population 76, 6 mio (2013) 1. 350 mio(2012) Av. Age 30, 1 (2013) 36, 3 (2013) Surface Area Gross National Income 783. 562 km² $ 820 billion (2013) 9. 572. 900 km² $13, 395 trillion (2013) Income per Capita 10. 782 USD (2013) 9. 844 USD (2013) 1 Exports 152 billion USD (2013) 2. 050 billion USD 13 Imports 251 billion USD (2013) 1. 817 billion USD 7 56 mio foreigners 2 Number of Tourists 31, 5 mio foreigners 20. 2. 2021 Ratio 18 1, 21 12 16
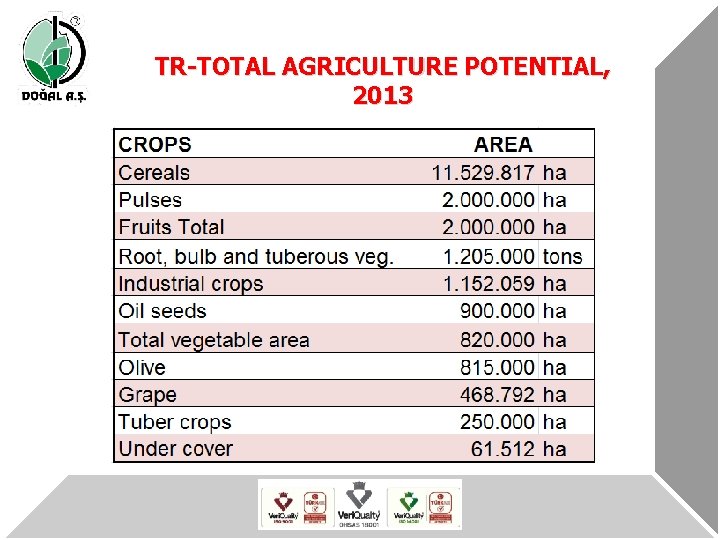
TR-TOTAL AGRICULTURE POTENTIAL, 2013
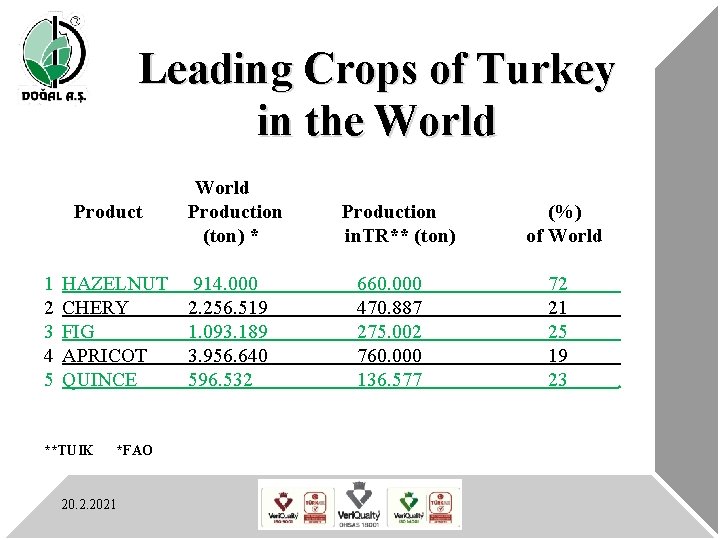
Leading Crops of Turkey in the World Product 1 2 3 4 5 HAZELNUT CHERY FIG APRICOT QUINCE **TUIK *FAO 20. 2. 2021 World Production (ton) * 914. 000 2. 256. 519 1. 093. 189 3. 956. 640 596. 532 Production in. TR** (ton) 660. 000 470. 887 275. 002 760. 000 136. 577 (%) of World 72 21 25 19 23 .
Regional Development Projects 1. GAP: South Eastern Project 2. DAP: East Anatolian Project 3. DOKAP: East Blacksea Project 4. ZBK: Zonguldak, Bartın, Karabük Project 5. YGH: “Yeşilırmak” River Basin Project 6. KOP: Konya Plain Project 7. Blue Tunnel (Mavi Tünel): Bağbaşı Dam Project 20. 2. 2021
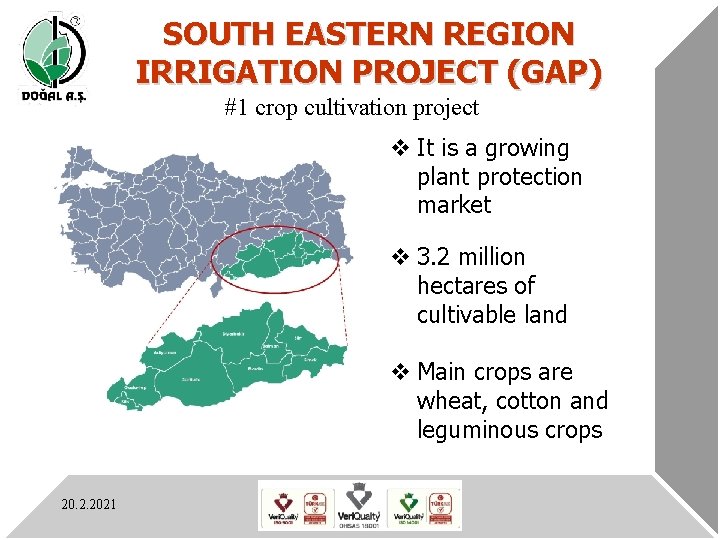
SOUTH EASTERN REGION IRRIGATION PROJECT (GAP) #1 crop cultivation project v It is a growing plant protection market v 3. 2 million hectares of cultivable land v Main crops are wheat, cotton and leguminous crops 20. 2. 2021
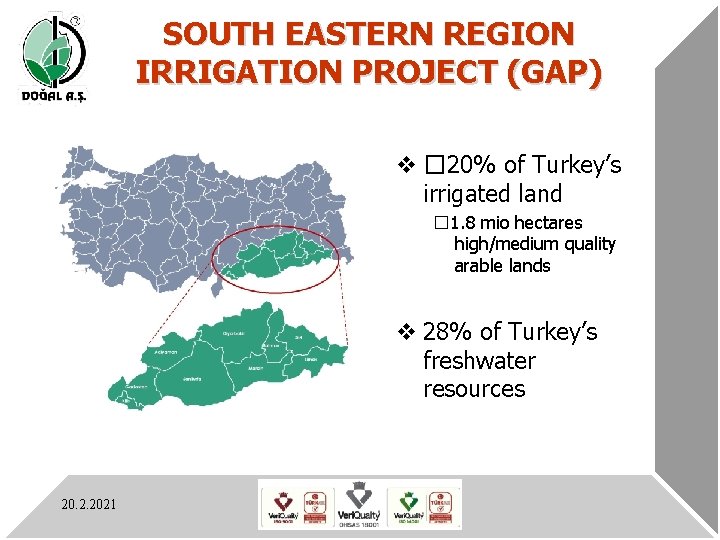
SOUTH EASTERN REGION IRRIGATION PROJECT (GAP) v � 20% of Turkey’s irrigated land � 1. 8 mio hectares high/medium quality arable lands v 28% of Turkey’s freshwater resources 20. 2. 2021
v Sales values • Turkish Plant Protection Market • Consumed product value v Turkish Plant Production Market v First ten big a. i. 20. 2. 2021
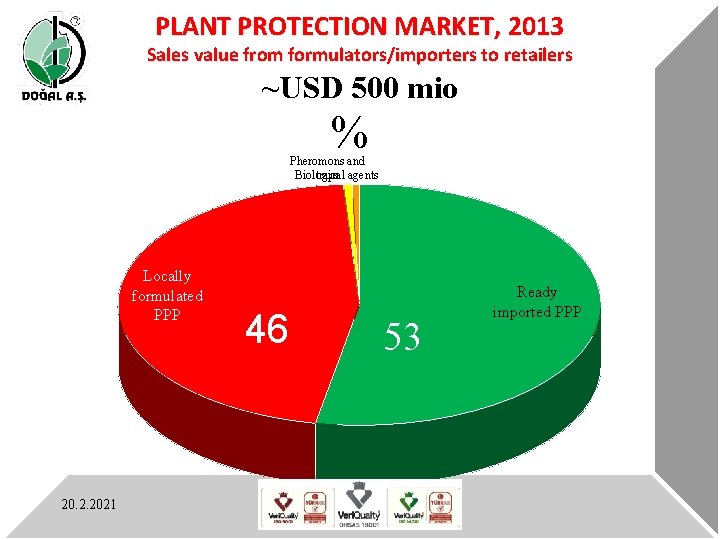
PLANT PROTECTION MARKET, 2013 Sales value from formulators/importers to retailers ~USD 500 mio % Pheromons and Biological traps agents Locally formulated PPP 20. 2. 2021 46 53 Ready imported PPP
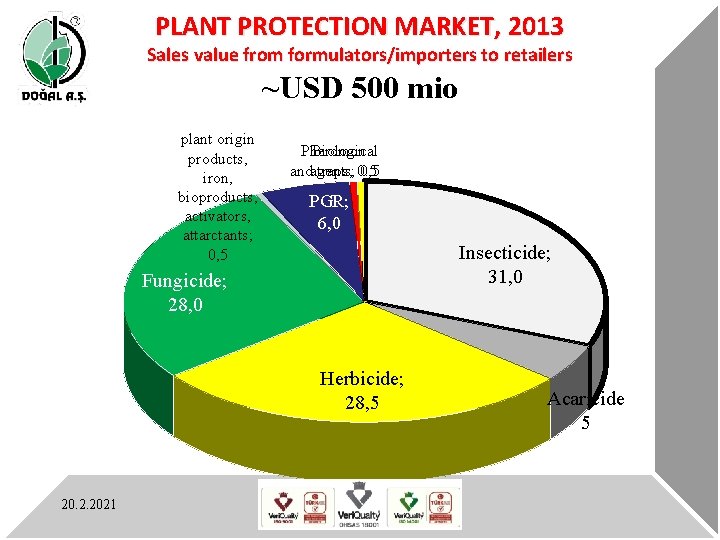
PLANT PROTECTION MARKET, 2013 Sales value from formulators/importers to retailers ~USD 500 mio plant origin products, iron, bioproducts, activators, attarctants; 0, 5 Pheromon Biological andagents; traps, 0. 5 0, 5 PGR; 6, 0 Insecticide; 31, 0 Fungicide; 28, 0 Herbicide; 28, 5 20. 2. 2021 Acaricide 5
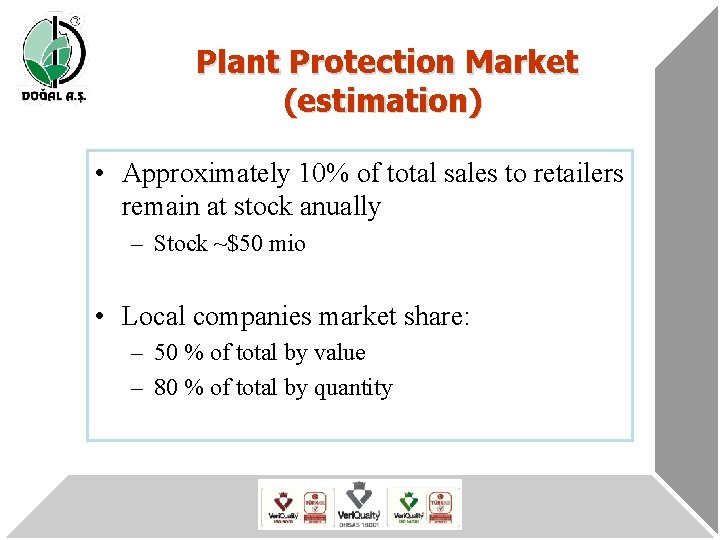
Plant Protection Market (estimation) • Approximately 10% of total sales to retailers remain at stock anually – Stock ~$50 mio • Local companies market share: – 50 % of total by value – 80 % of total by quantity
Plant Protection Market • China sourced ready formulation and technical for local formulation: – 70 -80 percent of total import of local companies is from China
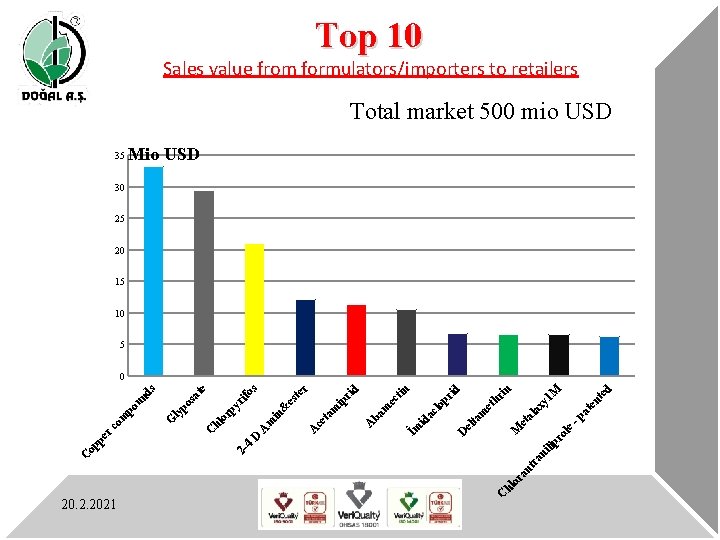
ra hl o C 20. 2. 2021 le ro M te d en at -p yl n d hr i et ax al et M m el ta D lo pr i id ac tin ec r d ip ri m ba m A ce ta A te es s ifo yr rp in & m A İm D ili p an nt r 4 2 - hl o e at ly po s ds un po m G co 35 C pe r op C Top 10 Sales value from formulators/importers to retailers Total market 500 mio USD Mio USD 30 25 20 15 10 5 0
Plant Protection Market v Number of active ingredients registered ~320 v Number of registered formulation ~ 4160, ~ 1900 of them on the market 20. 2. 2021
Plant Protection Market • Trends – EU harmonization & withdrawal of registrations – 181 a. i. withdrawn from Annex 1 was also withdrawn from Turkish market – EU MRL harmonization implemented. 20. 2. 2021
Plant Protection Market • Trends – Biological product, bio agent, Pheromon market is slowly growing– Residue awareness domestic & export • Shorter PHI product demand growing – Safe product for pollination bees and biological agents 20. 2. 2021
Turkish Plant Protection Market • Trends - Novel formulations, user and environmental friendly like SC, WDG usage are increasing - Cost effective products 20. 2. 2021
Thank you for listening! 20. 2. 2021