Wages of Power vs Wages of Care Nancy


 • Intrinsic motivation")

 but also consider")
 Earnings inequality in the top half of the earnings distribution, measured")

 Care Industries")

 High school degree or less College degree or")

")

- Slides: 16
Wages of Power vs. Wages of Care Nancy Folbre Political Economy Research Institute, University of Massachusetts Amherst and Kristin Smith Carsey School of Public Policy, University of New Hampshire
Pay Premia vs. Pay Penalties “You have to be willing to fire your mother. ” “I love them. That’s all. You can’t help it. ”
The Care Penalty Workers in jobs that entail care for others earn lower pay, net of other personal and job characteristics. Best evidence: fixed-effects analysis of longitudinal data from the NLSY (England et al 2001; Hodges et al 2016).
Distinctive Features of Care Provision • Concern for the well-being of the care recipient is likely to affect the quality of the services provided. • Emotional interaction and personal attachment. • Little or no consumer sovereignty. • Team production (often collaboration with “consumer. ” • Quality of services difficult to measure • Spillovers and externalities
Reduced Bargaining Power of Care Providers (net of skill/human capital characteristics) • Intrinsic motivation and emotional attachment reduce exit threat. • The marginal social product of labor far greater than marginal private product. • Team production makes it difficult to identify individual contribution. • Lack of standardized quality measures make it difficult for providers to claim the actual value of their contribution.
Care provision is concentrated in the public and private non-profit sector with predominantly female employees. It is largely ignored by most empirical studies of earnings inequality in the U. S. (one exception: Dwyer, 2013).
Empirical Strategy Focus on care industries (health, education, and social services) but also consider care occupations (e. g. nurse, teacher, social worker). Analysis of Current Population Survey data, March supplement 2015. Basic Question: How does earnings inequality in care industries differ from that in other industries?
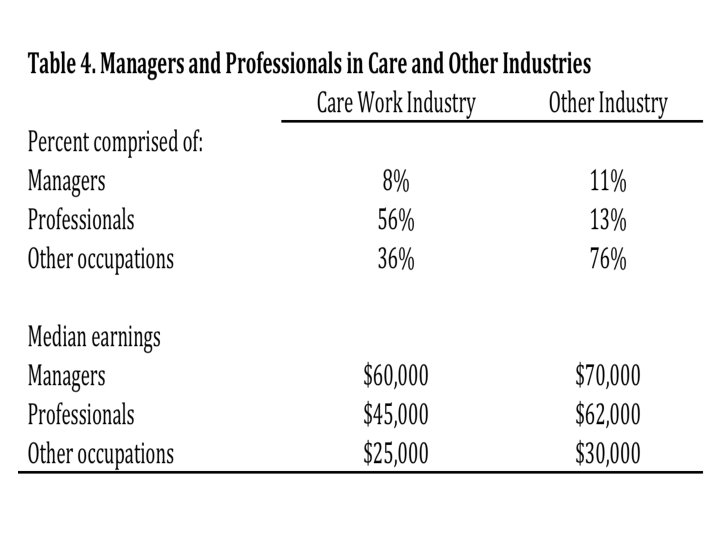
Three Hypotheses 1) Earnings inequality in the top half of the earnings distribution, measured by the ratio of the 90 th to the 50 th percentile, is lower in care than non-care industries; 2) Both employment in a care industry and employment in a care occupation have a negative effect on earnings, controlling for personal and other job characteristics. 3) Professionals and managers in care industries have lower earnings than those in other industries, controlling for personal and other job characteristics.
Type of Employer in Care and Other Industries (based on Table 1) Care Industries Other Industries Total Women 25% 38% 75% 62% Private For-Profit Women Public Women 16% 28% 50% 63% 84% 72% 50% 37%
Annual Earnings at the 10 th, 50 th, and 90 th Percentiles by Type of Industry (based on Table 2) Earnings Care industries Other industries Earnings Ratios P 10 P 50 (Median) P 90 P 10/P P 50/P 50 90 $10, 000 $37, 000 $82, 000 27% 45% $8, 000 $35, 000 $100, 000 23% 35%
Educational Attainment (based on Table 4) High school degree or less College degree or more Care Industries Other Industries Women Men 20% 17% 37% 42% 50% 60% 31% 30%
Controls not shown: gender, age, education, race, ethnicity
Occupation/ Industry Interactions (based on Table 6, controlling for other individual and job characteristics) Penalties for Working in a Care Industry Managers: -14% Professionals in non-care occupations: -20% Professionals in care industries: -22% Premia for Managers In care industries: 26% In other industries: 37% Premia for Professionals In care industries: 16% In other industries: 31%
Thanks for your attention!