Validation of WRF and WRF LES Simulations of
- Slides: 1
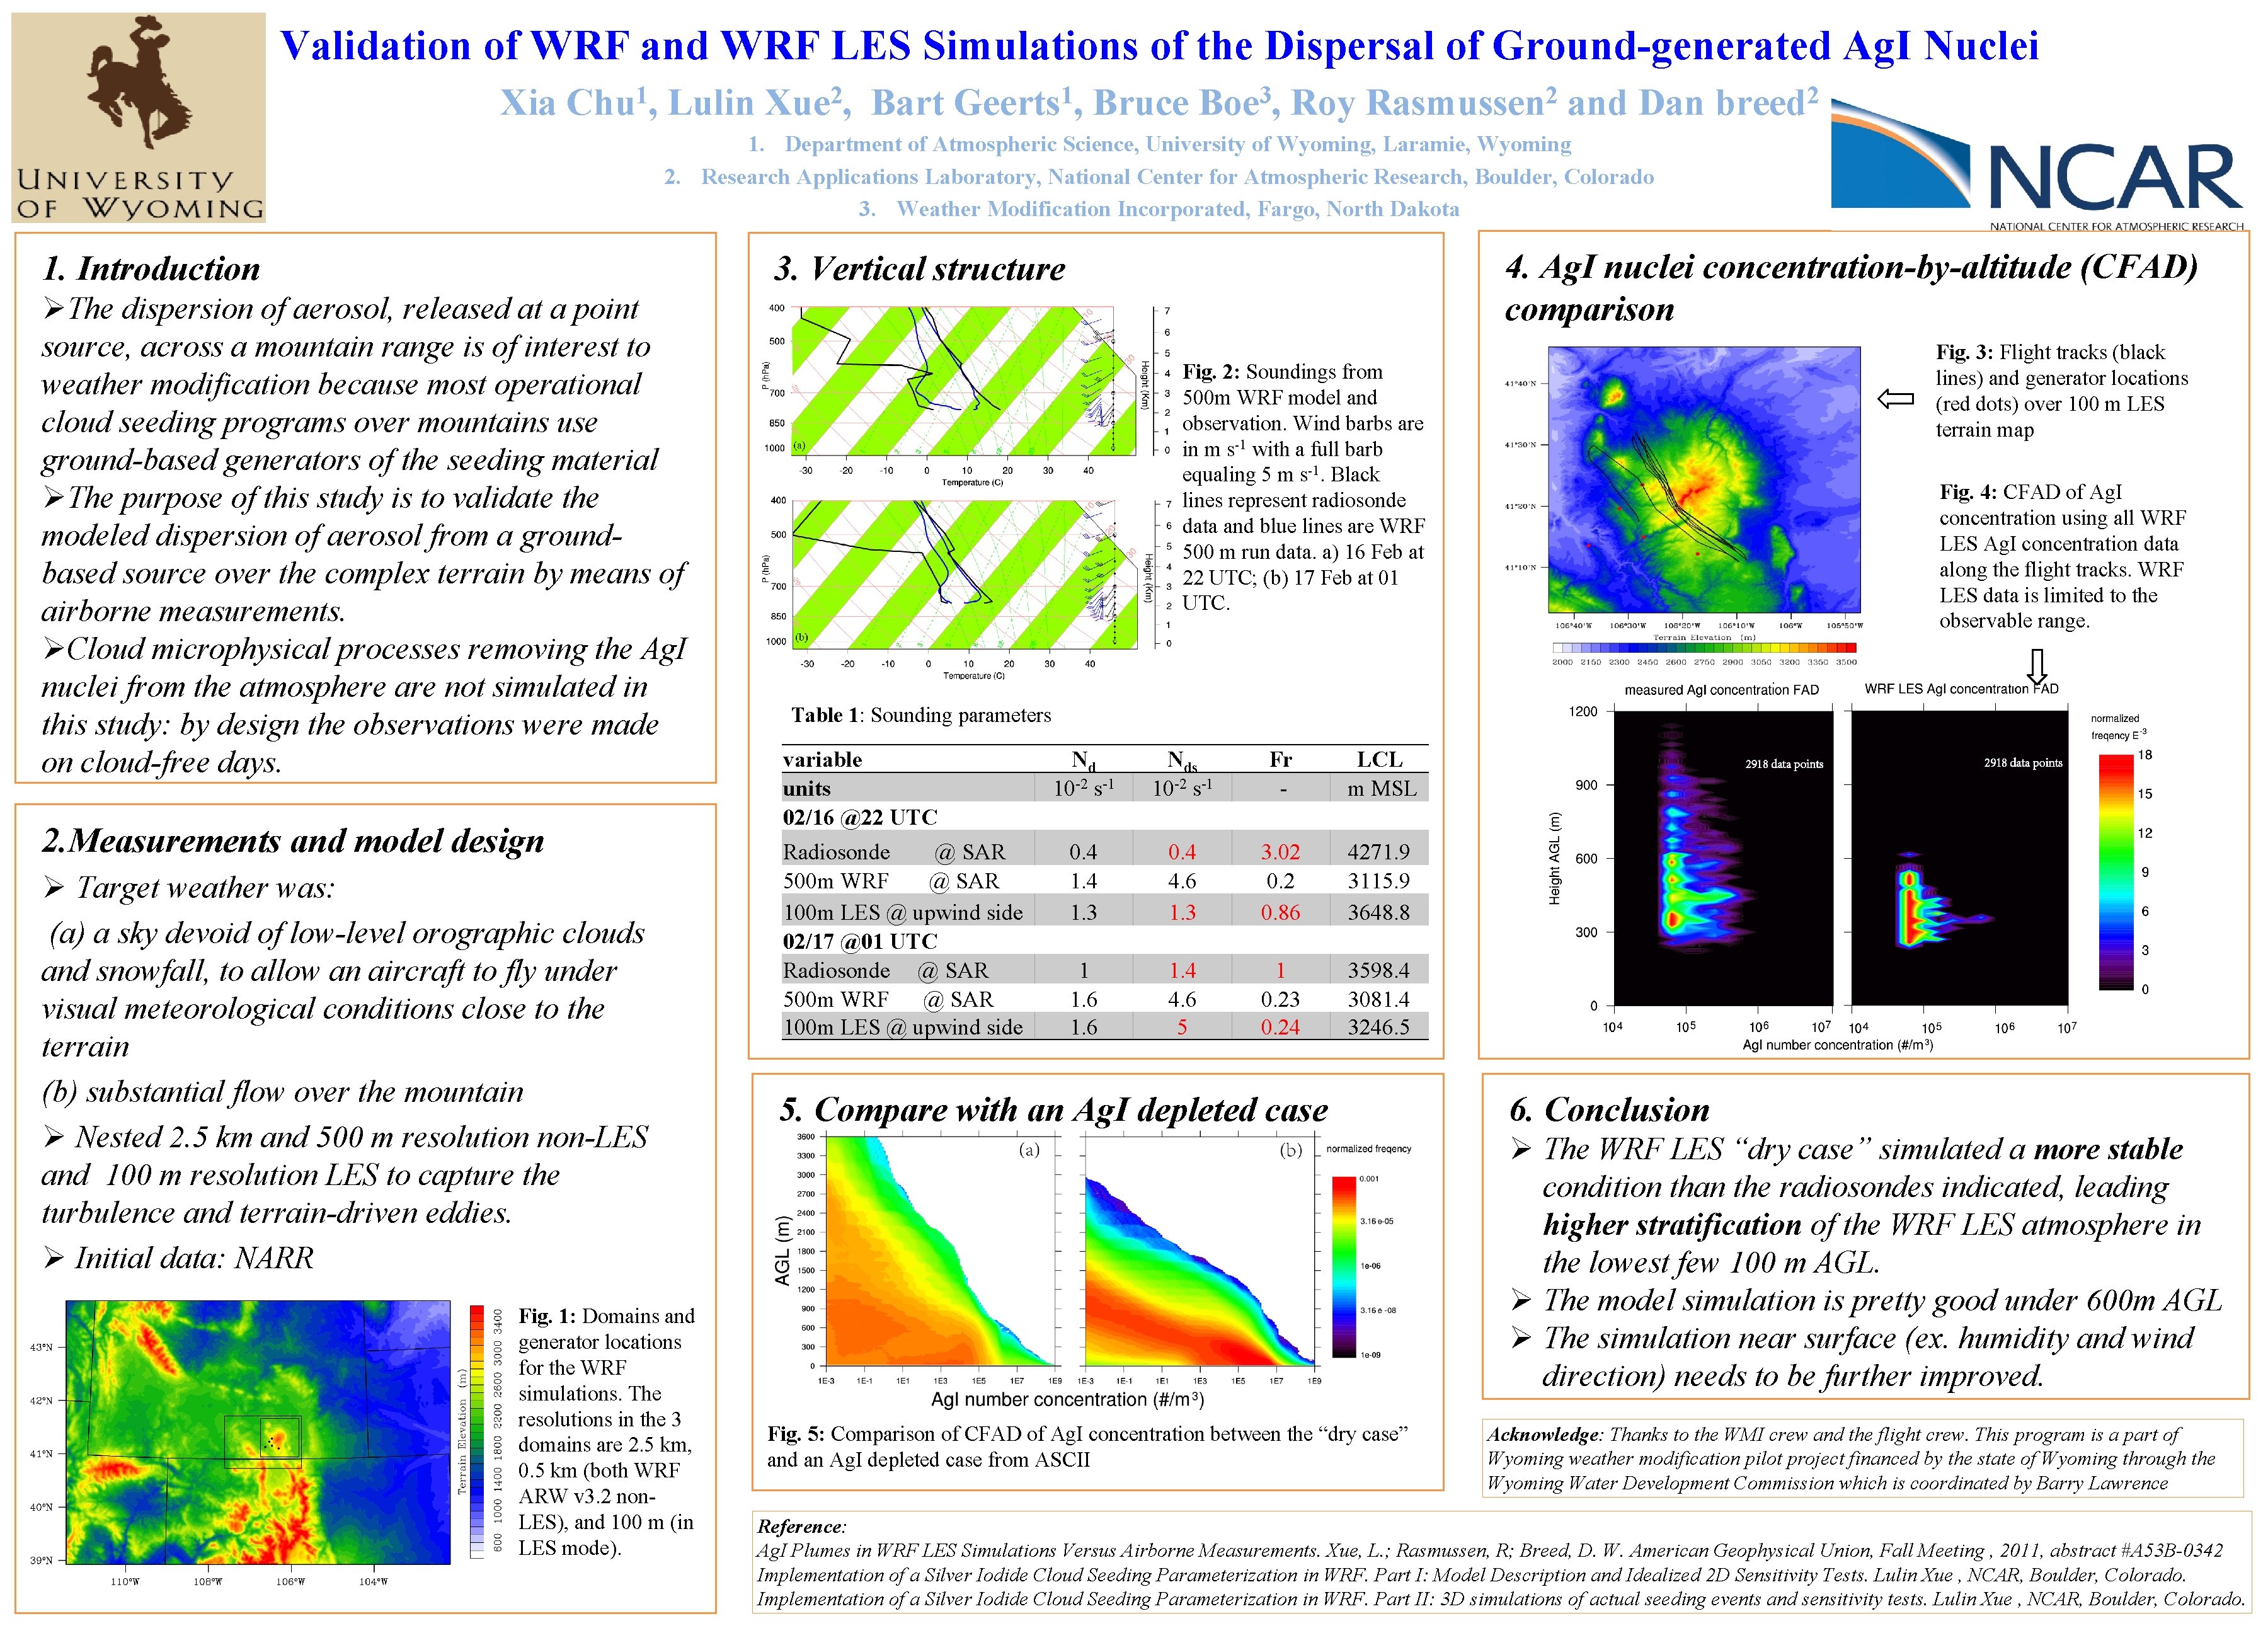
Validation of WRF and WRF LES Simulations of the Dispersal of Ground-generated Ag. I Nuclei Xia 1 Chu , Lulin 2 Xue , Bart 1 Geerts , Bruce 3 Boe , Roy 2 Rasmussen and Dan 2 breed 1. Department of Atmospheric Science, University of Wyoming, Laramie, Wyoming 2. Research Applications Laboratory, National Center for Atmospheric Research, Boulder, Colorado 3. Weather Modification Incorporated, Fargo, North Dakota 4. Ag. I nuclei concentration-by-altitude (CFAD) comparison 3. Vertical structure 1. Introduction ØThe dispersion of aerosol, released at a point source, across a mountain range is of interest to weather modification because most operational cloud seeding programs over mountains use ground-based generators of the seeding material ØThe purpose of this study is to validate the modeled dispersion of aerosol from a groundbased source over the complex terrain by means of airborne measurements. ØCloud microphysical processes removing the Ag. I nuclei from the atmosphere are not simulated in this study: by design the observations were made on cloud-free days. 2. Measurements and model design Ø Target weather was: (a) a sky devoid of low-level orographic clouds and snowfall, to allow an aircraft to fly under visual meteorological conditions close to the terrain (b) substantial flow over the mountain Ø Nested 2. 5 km and 500 m resolution non-LES and 100 m resolution LES to capture the turbulence and terrain-driven eddies. Ø Initial data: NARR Fig. 1: Domains and generator locations for the WRF simulations. The resolutions in the 3 domains are 2. 5 km, 0. 5 km (both WRF ARW v 3. 2 non. LES), and 100 m (in LES mode). Fig. 3: Flight tracks (black lines) and generator locations (red dots) over 100 m LES terrain map Fig. 2: Soundings from 500 m WRF model and observation. Wind barbs are in m s-1 with a full barb equaling 5 m s-1. Black lines represent radiosonde data and blue lines are WRF 500 m run data. a) 16 Feb at 22 UTC; (b) 17 Feb at 01 UTC. Fig. 4: CFAD of Ag. I concentration using all WRF LES Ag. I concentration data along the flight tracks. WRF LES data is limited to the observable range. Table 1: Sounding parameters variable units 02/16 @22 UTC Radiosonde @ SAR 500 m WRF @ SAR 100 m LES @ upwind side 02/17 @01 UTC Radiosonde @ SAR 500 m WRF @ SAR 100 m LES @ upwind side Nd 10 -2 s-1 Nds 10 -2 s-1 Fr - LCL m MSL 0. 4 1. 3 0. 4 4. 6 1. 3 3. 02 0. 86 4271. 9 3115. 9 3648. 8 1 1. 6 1. 4 4. 6 5 1 0. 23 0. 24 3598. 4 3081. 4 3246. 5 5. Compare with an Ag. I depleted case 6. Conclusion Ø The WRF LES “dry case” simulated a more stable condition than the radiosondes indicated, leading higher stratification of the WRF LES atmosphere in the lowest few 100 m AGL. Ø The model simulation is pretty good under 600 m AGL Ø The simulation near surface (ex. humidity and wind direction) needs to be further improved. Fig. 5: Comparison of CFAD of Ag. I concentration between the “dry case” and an Ag. I depleted case from ASCII Acknowledge: Thanks to the WMI crew and the flight crew. This program is a part of Wyoming weather modification pilot project financed by the state of Wyoming through the Wyoming Water Development Commission which is coordinated by Barry Lawrence Reference: Ag. I Plumes in WRF LES Simulations Versus Airborne Measurements. Xue, L. ; Rasmussen, R; Breed, D. W. American Geophysical Union, Fall Meeting , 2011, abstract #A 53 B-0342 Implementation of a Silver Iodide Cloud Seeding Parameterization in WRF. Part I: Model Description and Idealized 2 D Sensitivity Tests. Lulin Xue , NCAR, Boulder, Colorado. Implementation of a Silver Iodide Cloud Seeding Parameterization in WRF. Part II: 3 D simulations of actual seeding events and sensitivity tests. Lulin Xue , NCAR, Boulder, Colorado.