UNECE CONFERENCE OF EUROPEAN STATISTICIANS Session III Migration

- Slides: 6
UNECE CONFERENCE OF EUROPEAN STATISTICIANS Session III. Migration and society Fifty-sixth plenary session Paris, 10 -12 June 2008
Invited papers: • The feasibility of determining successful integration with statistical means - using microcensus data for attempted integration analysis Gunter Brückner, FSO, Germany and Thomas Schäfer, Fachhochschule Gelsenkirchen • Diaspora, integration, population mobility and the Asia-Pacific region: a view from the edge Robert Didham, Denise Mc. Gregor, Statistics New Zealand • Why it is important to know about diasporas? Alan Gamlen, University of Oxford v Definition / Data sources / Indicators
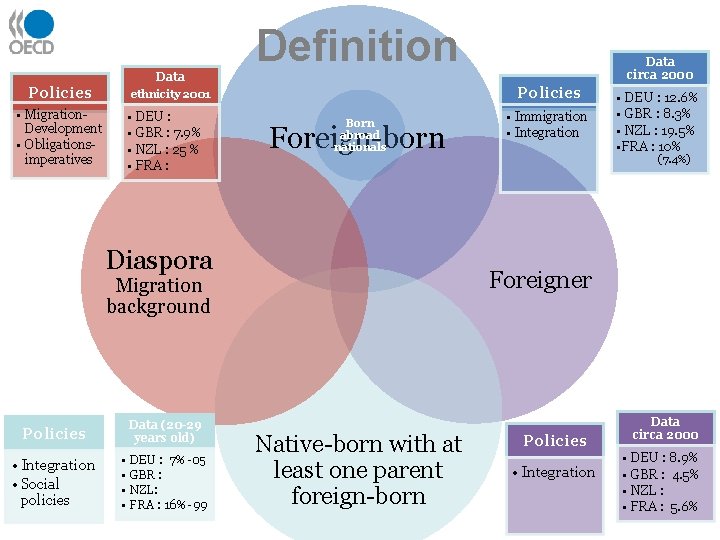
Data Policies Definition Policies ethnicity 2001 • Migration. Development • Obligationsimperatives • DEU : • GBR : 7. 9% • NZL : 25 % • FRA : Born abroad nationals Foreign-born Diaspora Data (20 -29 years old) • Integration • Social policies • • DEU : 7% -05 GBR : NZL: FRA : 16% -99 • Immigration • Integration • DEU : 12. 6% • GBR : 8. 3% • NZL : 19. 5% • FRA : 10% (7. 4%) Foreigner Migration background Policies Data circa 2000 Native-born with at least one parent foreign-born Policies • Integration Data circa 2000 • DEU : 8. 9% • GBR : 4. 5% • NZL : • FRA : 5. 6%
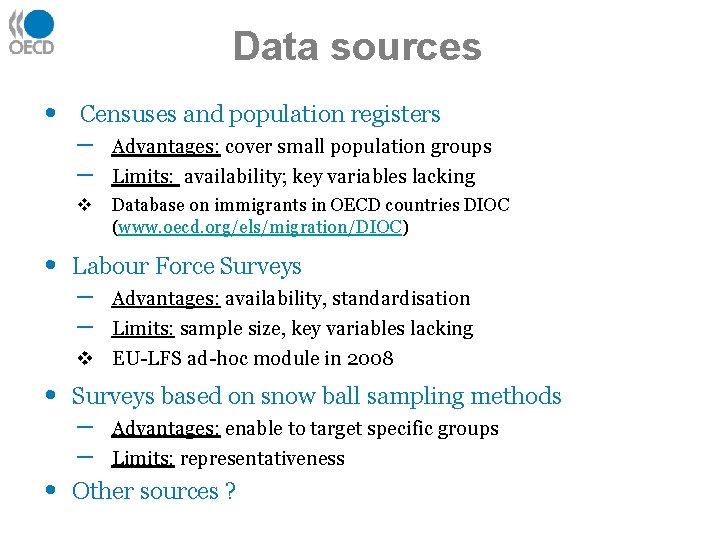
Data sources • • Censuses and population registers – – Advantages: cover small population groups v Database on immigrants in OECD countries DIOC (www. oecd. org/els/migration/DIOC) Limits: availability; key variables lacking Labour Force Surveys – – Advantages: availability, standardisation Limits: sample size, key variables lacking v EU-LFS ad-hoc module in 2008 • • Surveys based on snow ball sampling methods – – Advantages: enable to target specific groups Limits: representativeness Other sources ?
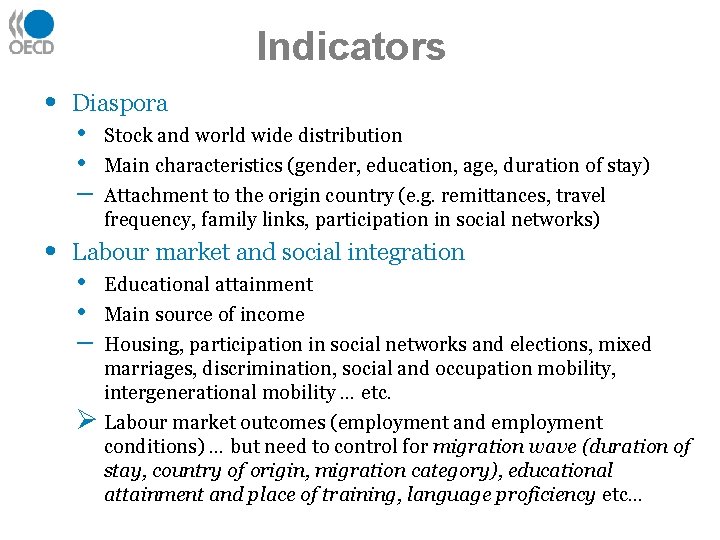
Indicators • • Diaspora • • – Stock and world wide distribution Main characteristics (gender, education, age, duration of stay) Attachment to the origin country (e. g. remittances, travel frequency, family links, participation in social networks) Labour market and social integration • • – Educational attainment Main source of income Housing, participation in social networks and elections, mixed marriages, discrimination, social and occupation mobility, intergenerational mobility … etc. Ø Labour market outcomes (employment and employment conditions) … but need to control for migration wave (duration of stay, country of origin, migration category), educational attainment and place of training, language proficiency etc…
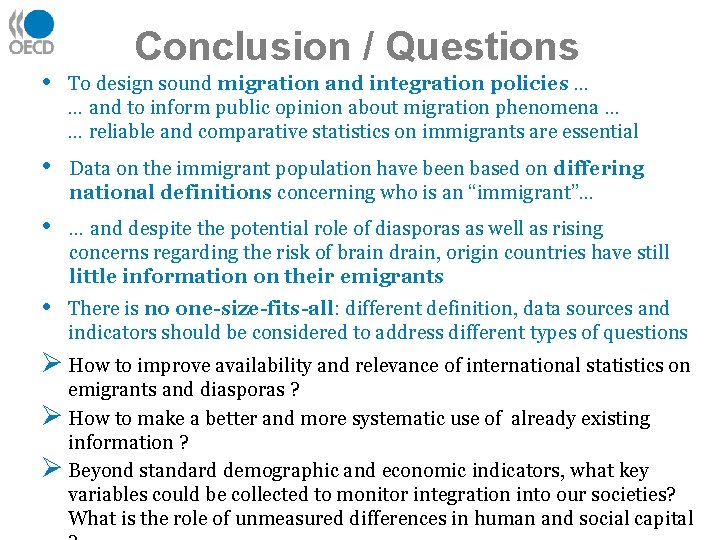
Conclusion / Questions • To design sound migration and integration policies … … and to inform public opinion about migration phenomena … … reliable and comparative statistics on immigrants are essential • Data on the immigrant population have been based on differing national definitions concerning who is an “immigrant”… • … and despite the potential role of diasporas as well as rising concerns regarding the risk of brain drain, origin countries have still little information on their emigrants • There is no one-size-fits-all: different definition, data sources and indicators should be considered to address different types of questions Ø How to improve availability and relevance of international statistics on emigrants and diasporas ? Ø How to make a better and more systematic use of already existing information ? Ø Beyond standard demographic and economic indicators, what key variables could be collected to monitor integration into our societies? What is the role of unmeasured differences in human and social capital