Total Cost Analysis ANGELO DALISAY RAYMOND YE YANG
- Slides: 4
Total Cost Analysis ANGELO DALISAY RAYMOND YE YANG ZHENG
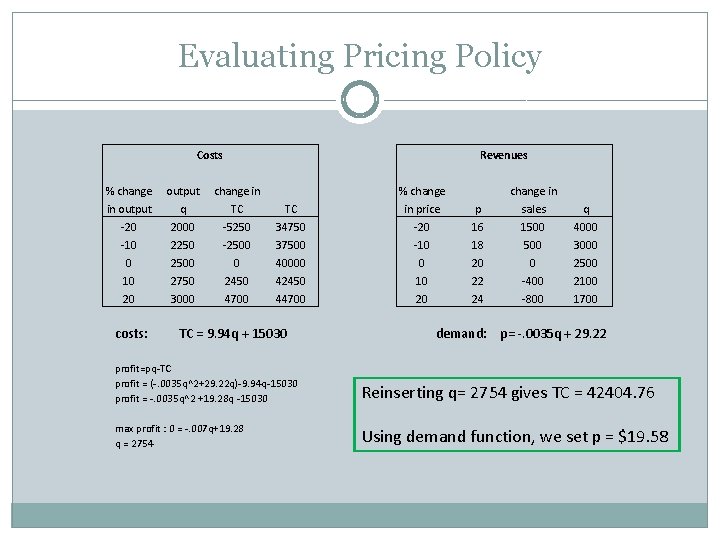
Evaluating Pricing Policy Costs % change in output -20 -10 0 10 20 costs: output q 2000 2250 2500 2750 3000 change in TC -5250 -2500 0 2450 4700 TC 34750 37500 40000 42450 44700 TC = 9. 94 q + 15030 % change in price -20 -10 0 10 20 Revenues p 16 18 20 22 24 change in sales 1500 0 -400 -800 q 4000 3000 2500 2100 1700 demand: p= -. 0035 q + 29. 22 profit=pq-TC profit = (-. 0035 q^2+29. 22 q)-9. 94 q-15030 profit = -. 0035 q^2 +19. 28 q -15030 Reinserting q= 2754 gives TC = 42404. 76 max profit : 0 = -. 007 q+19. 28 q = 2754 Using demand function, we set p = $19. 58
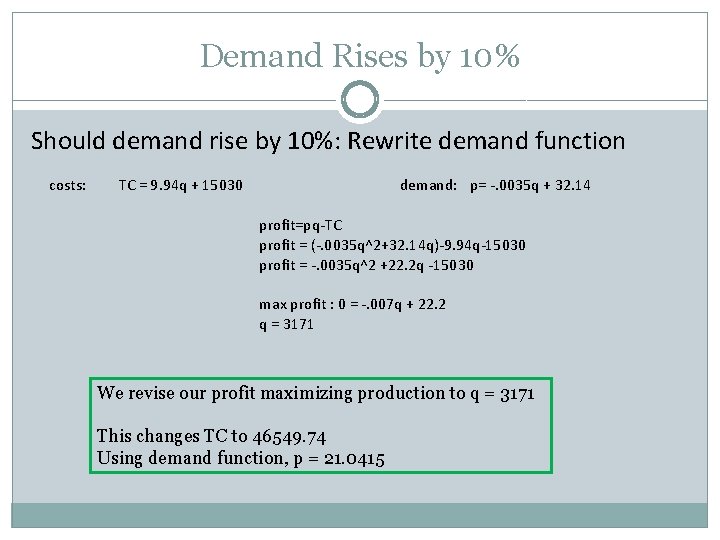
Demand Rises by 10% Should demand rise by 10%: Rewrite demand function costs: TC = 9. 94 q + 15030 demand: p= -. 0035 q + 32. 14 profit=pq-TC profit = (-. 0035 q^2+32. 14 q)-9. 94 q-15030 profit = -. 0035 q^2 +22. 2 q -15030 max profit : 0 = -. 007 q + 22. 2 q = 3171 We revise our profit maximizing production to q = 3171 This changes TC to 46549. 74 Using demand function, p = 21. 0415
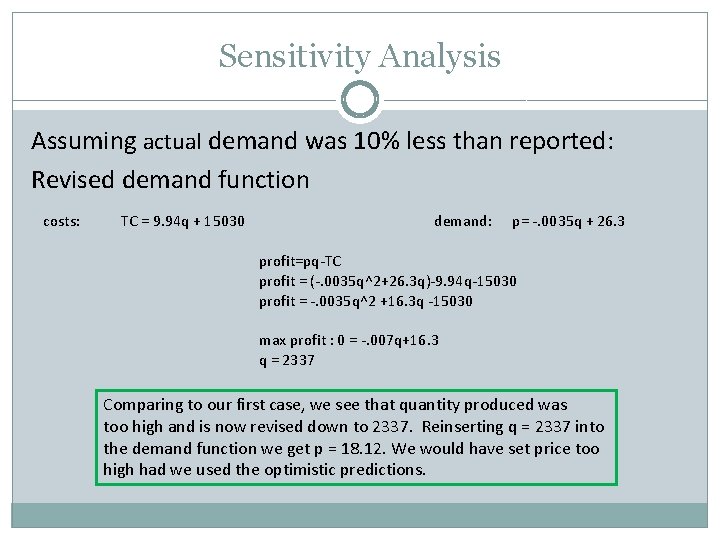
Sensitivity Analysis Assuming actual demand was 10% less than reported: Revised demand function costs: TC = 9. 94 q + 15030 demand: p= -. 0035 q + 26. 3 profit=pq-TC profit = (-. 0035 q^2+26. 3 q)-9. 94 q-15030 profit = -. 0035 q^2 +16. 3 q -15030 max profit : 0 = -. 007 q+16. 3 q = 2337 Comparing to our first case, we see that quantity produced was too high and is now revised down to 2337. Reinserting q = 2337 into the demand function we get p = 18. 12. We would have set price too high had we used the optimistic predictions.