SSCAASA Joint Meeting Academic Surgery Departments Funds Flow


- Slides: 19

SSC/AASA Joint Meeting Academic Surgery Departments Funds Flow Models: AASA Funds Flow Survey October 4, 2015

Agenda I. Introduction to the Survey II. Survey Methodology III. Preliminary Findings IV. Implications and Next Steps 0100. 015344417(pptx)-E 2 1

I. Introduction to the Survey Rationale At one point or another, most of us have questioned our funds flow. What percentage of my department’s clinical faculty compensation should come from professional fees or contracted clinical services? How much support do other departments get from the hospital for advanced practice providers (APPs)? Do other departments get support from the Dean’s Office or hospital for GME infrastructure? What’s the right number of APPs and residents per clinical faculty? 0100. 015344417(pptx)-E 2 These and other questions were the impetus for AASA to initiate its funds flow survey. 2

I. Introduction to the Survey Purpose and Approach AASA’s purpose and approach to answering our funds flow questions are shown below. Purpose To understand the following: » The relative distribution of sources and uses of funds across surgical departments » APP and resident staffing models Approach » A pilot survey was distributed to three surgical department administrators. » The revised survey was distributed to an additional 16 administrators. » Respondents were contacted by phone for questions and clarification, and responses were adjusted accordingly. 0100. 015344417(pptx)-E 2 The convenience sample limits generalizability but will inform subsequent surveys. 3

II. Survey Methodology Survey Design Survey design considerations are presented below. » Based on pilot results, the survey was refined and narrowed in focus. › Compensation and benefits › Clinical faculty › Nonclinical faculty › APPs › Residents/fellows › GME infrastructure costs › FTEs » Compensation costs were included or excluded according to the following: › Include the cost regardless of the source of funds (e. g. , residents paid directly by the hospital). › Exclude payments directly to individuals from sources outside the institution (e. g. , VA compensation). 0100. 015344417(pptx)-E 2 4

II. Survey Methodology Survey Design (continued) » Sources of compensation were categorized as follows: › Clinical services (professional collections) › Affiliated hospital › Grants/contracts › General funds/Dean’s Office/state funds › Gifts/endowments/investments » The same approach was used to categorize GME infrastructure costs. 0100. 015344417(pptx)-E 2 5

II. Survey Methodology Metrics were chosen with consideration to wide-ranging institutional sizes and characteristics. » FTE ratios › APPs per clinical faculty › Residents per clinical faculty » Percentage of compensation and benefit support by source for the following groups: › Clinical faculty › Nonclinical faculty › APPs › ACGME residents/fellows › Non-ACGME residents/fellows › Clinical residents/fellows in research » Percentage of GME infrastructure cost support by source 0100. 015344417(pptx)-E 2 6

III. Preliminary Findings Sample Characteristics survey respondents are described below. » Eleven departments of surgery › Three private and eight public institutions. › One Eastern, two Midwestern, five Southern, and three Western region institutions » Size ranges › 48 to 217 faculty › 16 to 130 APPs › 64 to 129 residents/fellows › $32 million to $108 million in total compensation and benefit costs › $568, 000 to $3. 3 million in GME infrastructure costs 0100. 015344417(pptx)-E 2 Characteristics represent wide variation among AASA member institutions. 7

III. Preliminary Findings Support FTEs Per Clinical Faculty FTE 2. 50 APPs Std Dev = 0. 13 Relative Std Dev = 21% Residents/Fellows Std Dev = 0. 20 Relative Std Dev = 18% APPs, Residents, and Fellows Std Dev = 0. 17 Relative Std Dev = 10% FTE Per Clinical Faculty FTE 2. 00 1. 50 1. 00 0. 50 1 0100. 015344417(pptx)-E 2 2 3 4 5 6 7 Departments of Surgery 8 Average APPs and residents/fellows per clinical FTE are 1. 1 and 0. 6 FTEs, respectively. 9 10 11 8

III. Preliminary Findings Clinical Faculty Compensation and Benefits 100% 9% 13% 12% 80% 23% 22% 24% 21% 70% 36% 42% 55% 52% 10 11 60% 50% 40% 84% 81% 78% 77% 72% 71% 70% 30% 66% 62% 20% 10% 0% 1 Clinical Services 0100. 015344417(pptx)-E 2 2 3 Affiliated Hospital 4 Grants/Contracts 5 6 7 Departments of Surgery 8 General Funds/Dean's Office/State Appropriations On average, 70% of clinical faculty compensation and benefits is from clinical services. 9 Gifts/Endowments/Investments 9

III. Preliminary Findings Nonclinical Faculty Compensation and Benefits FTEs 51 6 7 13 8 19 15 18 4 5 8 100% 90% 80% 3% 10% 42% 9% 70% 29% 60% 47% 46% 7% 50% 0% 40% 27% 12% 51% 0% 30% 8% 56% 39% 41% 19% 0% 24% 55% 51% 48% 20% 11% 47% 38% 36% 33% 32% 10% 18% 0% 1 Grants/Contracts 0100. 015344417(pptx)-E 2 2 3 Clinical Services 4 5 6 7 Departments of Surgery General Funds/Dean's Office/State Appropriations 8 9 Gifts, Endowments, Investments On average, 41% of nonclinical faculty compensation and benefits is from grants. 10 11 Affiliated Hospital 10

III. Preliminary Findings APP Compensation and Benefits 0. 90 3% 15% 90% 15% 0. 78 0. 77 0. 80 27% 19% 0. 75 80% 34% 0. 70 70% 0. 62 54% 49% 60% 50% 0. 60 0. 59 0. 57 81% 0. 51 85% 76% 0. 40 0. 37 0. 36 73% 30% 0. 30 66% 48% 20% 46% 10% 0. 20 0. 10 19% 4% 0% 1 2 3 Affiliated Hospital 0100. 015344417(pptx)-E 2 0. 50 96% 97% 40% 0. 60 4 5 6 Departments of Surgery Clinical Services Other 7 Per Clinical Faculty FTE 100% 8 9 - 10 APPs Per Clinical Faculty FTE On average, 60% of APP compensation and benefits is from affiliated hospital payments. 11

III. Preliminary Findings ACGME Resident/Fellow Compensation and Benefits 100% 90% 80% 70% 60% 50% 100% 98% 96% 94% 88% 40% 82% 61% 30% 20% 10% 0% 1 2 3 4 5 6 7 Departments of Surgery Affiliated Hospital 0100. 015344417(pptx)-E 2 Clinical Services 8 9 10 11 Other On average, 92% of ACGME resident/fellow compensation and benefits is from affiliated hospital payments. 12

III. Preliminary Findings Non-ACGME Resident/Fellow Compensation and Benefits 100% 0% 90% 0% 80% 0% 36% 0% 70% 25% 60% 57% 92% 100% 95% 86% 40% 100% 84% 73% 30% 64% 54% 20% 35% 10% 8% 0% 1 Clinical Services 0100. 015344417(pptx)-E 2 2 3 Affiliated Hospital 4 5 6 Departments of Surgery Gifts/Endowments/Investments Grants/Contracts 7 8 0% 9 0% 10 General Funds/Dean's Office/State Appropriations On average, 50% of non-ACGME resident/fellow compensation and benefits is from clinical services, and 41% is from affiliated hospital payments. 13

III. Preliminary Findings Research Resident/Fellow Compensation and Benefits FTEs 2 14 8 10 40 2 13 9 4 9 0% 10 100% 90% 80% 70% 60% 50% 100% 88% 40% 73% 30% 67% 55% 50% 28% 10% 14% 0% 1 2 3 Grants/Contracts Clinical Services 0100. 015344417(pptx)-E 2 4 5 6 Departments of Surgery 7 8 Affiliated Hospital General Funds/Dean's Office/State Appropriations Gifts/Endowments/Investments On average, 48% of research resident/fellow compensation and benefits is from grants/contracts. 14

III. Preliminary Findings Total of All Compensation and Benefits 100% 90% 80% 26% 28% 25% 29% 20% 70% 37% 36% 35% 33% 50% 47% 60% 50% 40% 69% 30% 64% 63% 61% 55% 54% 53% 48% 20% 41% 37% 10% 0% 1 Clinical Services 0100. 015344417(pptx)-E 2 2 3 Affiliated Hospital 4 5 6 7 Departments of Surgery 8 General Funds/Dean's Office/State Appropriations Grants/Contracts On average, 55% of total compensation and benefits is from clinical services, and 33% is from affiliated hospital payments. 9 10 11 Gifts/Endowments/Investments 15

III. Preliminary Findings GME Infrastructure 0% 90% $40, 000 19% 80% 33, 706 $35, 000 41% $30, 000 36% 70% $25, 000 66% 60% 25, 305 50% $20, 000 20, 726 20, 454 19, 035 40% 17, 482 0% 17, 675 52% 61% 30% 53% 0% $10, 000 31% 20% 10% $15, 000 Cost Per Resident/Fellow 100% 9, 342 5, 185 100% 74% 59% 53% 1 2 3 4 General Funds/Dean's Office/State Appropriations 0100. 015344417(pptx)-E 2 39% 27% 12% 5 6 7 Departments of Surgery Clinical Services Affiliated Hospital 5% 8 0% 0% 9 6, 641 6, 593 0% 0% 10 11 Gifts, Endowments, Investments Average GME infrastructure cost per resident/fellow is approximately $16, 500. $5, 000 $0 Grants/Contracts 16

IV. Implications and Next Steps While the initial findings are informative, AASA will work over the next several months to expand the survey. Implications » Findings from the AASA funds flow survey are a tool to help departments in understanding their current funds flows relative to peers, and findings should be considered directional rather than absolute. » Moving toward a more integrated funds flow approach also involves: › Ongoing and active discussions among hospital, physician and department leadership. › Alignment of strategic and institutional goals and objectives. Next Steps » The survey will be expanded to the AASA membership. » Updated findings will be reported to participants, 0100. 015344417(pptx)-E 2 17

Questions Jamie Meyer meyerjr@musc. edu 843 -792 -3727 0100. 015344417(pptx)-E 2 & Discussion Matt Johnson mjohnson@ecgmc. com 206 -689 -2200 18
 Basic flow of funds through the financial system
 Uab oncology faculty
 Fund flow statement
 Financial markets instruments and institutions
 Agencies that facilitate international flow of funds
 International flow of funds
 International flow of funds
 International flow of funds
 For todays meeting
 Meeting objective
 What is meeting and types of meeting
 What is meeting and types of meeting
 Joint meeting of essex and union counties
 Advantages of joint application development
 Spool joint in lambs
 Intertransverse ligament
 Joining methods wood
 Joint venture account
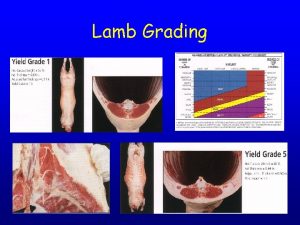
 Lamb grading chart
 Plane joint


