Plotting XY plots A typical XY plot shows

, from – 10")


- Slides: 6
Plotting • X-Y plots: A typical X-Y plot shows horizontal x-values versus vertical y-values to create an X-Y plot follow these steps: 1. Click in your worksheet where you want the graph to appear. 2. Choose Graph X-Y Plot from the Insert menu or click on the Graph toolbar. Alternatively, type [Shift] 2 or @. Mathcad inserts a blank XY plot. 3. Fill in both the x-axis placeholder (bottom center) and the y-axis placeholder (left center) with a function, expression, or variable. 4. Click outside the plot or press [Enter].
Mathcad automatically chooses axis limits (default range for the independent variable(s), from – 10 to 10). If you want to specify the axis limits yourself, click in the plot and type over the numbers in the placeholders at the ends of the axes.
Graphing Functions and Expressions 1. Click in your worksheet where you want the graph to appear. 2. Enter the expression or function of a single variable you want to plot. Make sure the editing lines remain in the expression. 3. Choose Graph X-Y Plot from the Insert menu or click on Graph toolbar. 4. Click outside the graph or press [Enter]. the
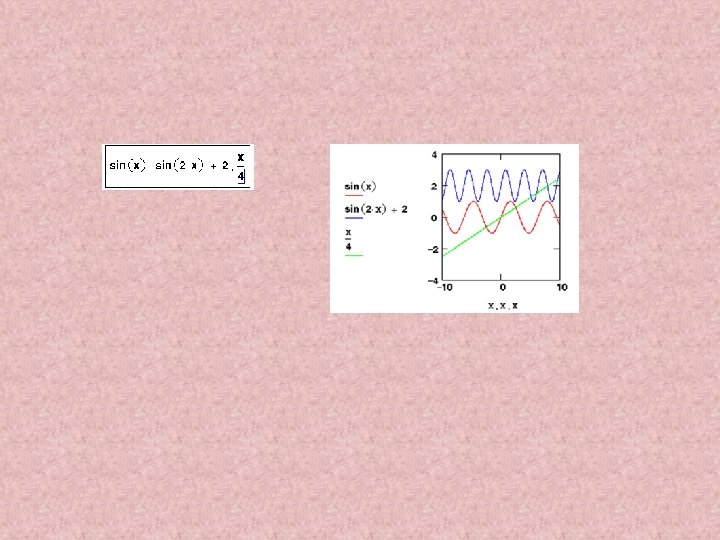
Example
Plotting Multiple 2 D Curves in the same plot 1 - Enter the expressions or functions of a single variable you want to plot, separated by commas. Make sure the editing lines remain in the expression. 2. Choose Graph X-Y Plot from the Insert menu or click on the Graph toolbar. 3 - Type the expressions or name of functions at y-coordinates of the plot and the variable name at x-axis. 4 - Click outside the graph or press [Enter].