Monday 15 th June 2020 LO To recap
- Slides: 6
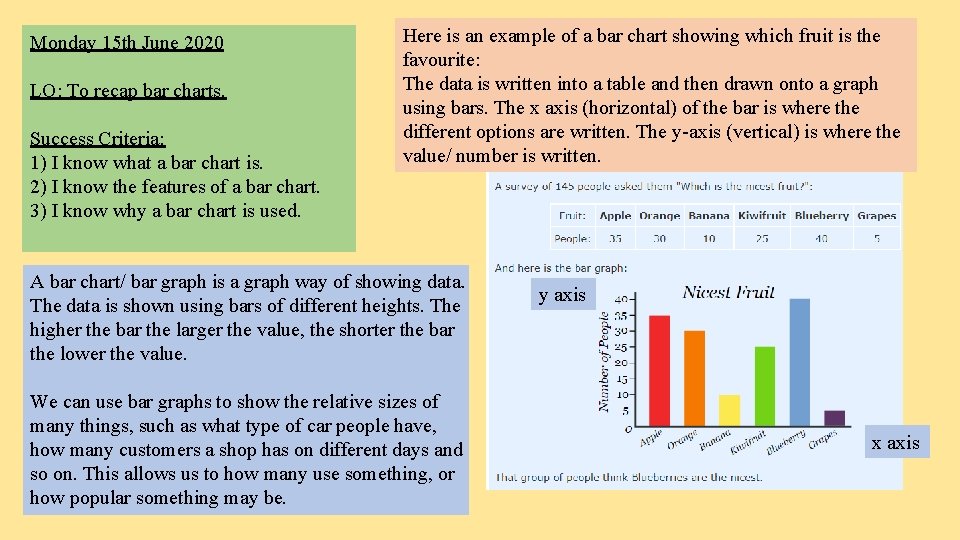
Monday 15 th June 2020 LO: To recap bar charts. Success Criteria: 1) I know what a bar chart is. 2) I know the features of a bar chart. 3) I know why a bar chart is used. Here is an example of a bar chart showing which fruit is the favourite: The data is written into a table and then drawn onto a graph using bars. The x axis (horizontal) of the bar is where the different options are written. The y-axis (vertical) is where the value/ number is written. A bar chart/ bar graph is a graph way of showing data. The data is shown using bars of different heights. The higher the bar the larger the value, the shorter the bar the lower the value. We can use bar graphs to show the relative sizes of many things, such as what type of car people have, how many customers a shop has on different days and so on. This allows us to how many use something, or how popular something may be. y axis x axis
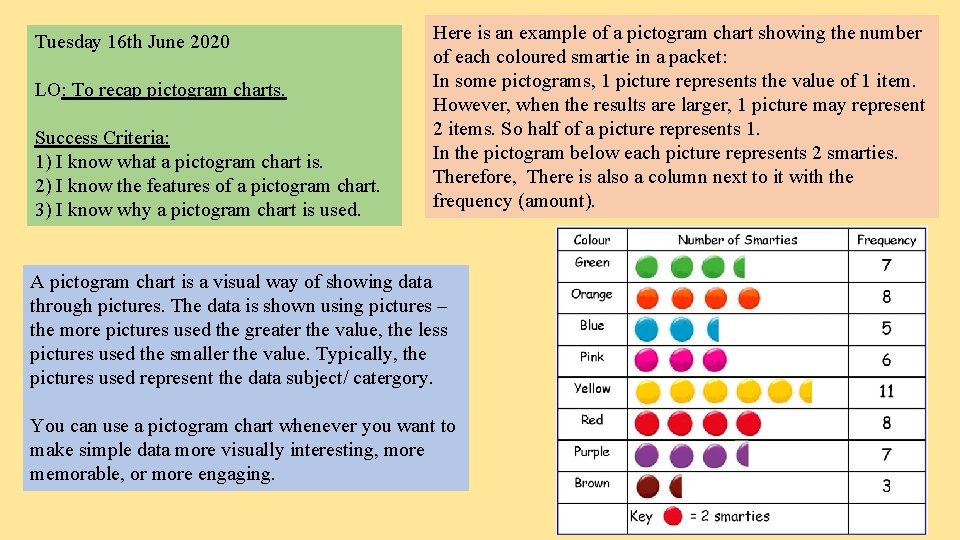
Tuesday 16 th June 2020 LO: To recap pictogram charts. Success Criteria: 1) I know what a pictogram chart is. 2) I know the features of a pictogram chart. 3) I know why a pictogram chart is used. Here is an example of a pictogram chart showing the number of each coloured smartie in a packet: In some pictograms, 1 picture represents the value of 1 item. However, when the results are larger, 1 picture may represent 2 items. So half of a picture represents 1. In the pictogram below each picture represents 2 smarties. Therefore, There is also a column next to it with the frequency (amount). A pictogram chart is a visual way of showing data through pictures. The data is shown using pictures – the more pictures used the greater the value, the less pictures used the smaller the value. Typically, the pictures used represent the data subject/ catergory. You can use a pictogram chart whenever you want to make simple data more visually interesting, more memorable, or more engaging.
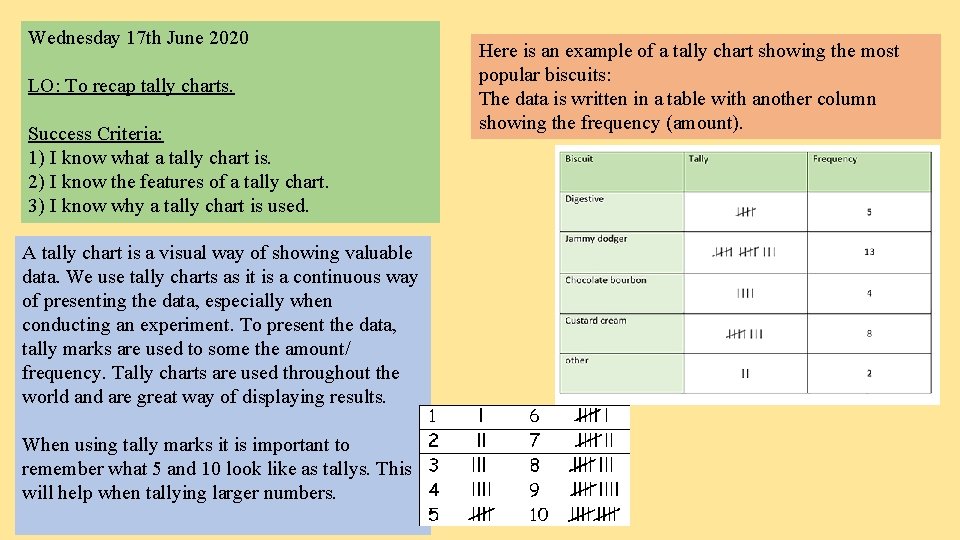
Wednesday 17 th June 2020 LO: To recap tally charts. Success Criteria: 1) I know what a tally chart is. 2) I know the features of a tally chart. 3) I know why a tally chart is used. A tally chart is a visual way of showing valuable data. We use tally charts as it is a continuous way of presenting the data, especially when conducting an experiment. To present the data, tally marks are used to some the amount/ frequency. Tally charts are used throughout the world and are great way of displaying results. When using tally marks it is important to remember what 5 and 10 look like as tallys. This will help when tallying larger numbers. Here is an example of a tally chart showing the most popular biscuits: The data is written in a table with another column showing the frequency (amount).
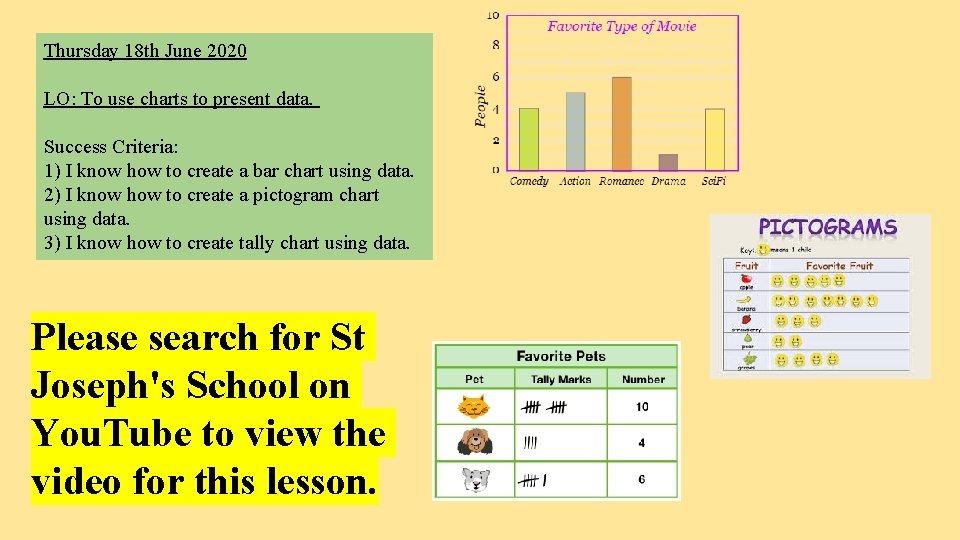
Thursday 18 th June 2020 LO: To use charts to present data. Success Criteria: 1) I know how to create a bar chart using data. 2) I know how to create a pictogram chart using data. 3) I know how to create tally chart using data. Please search for St Joseph's School on You. Tube to view the video for this lesson.
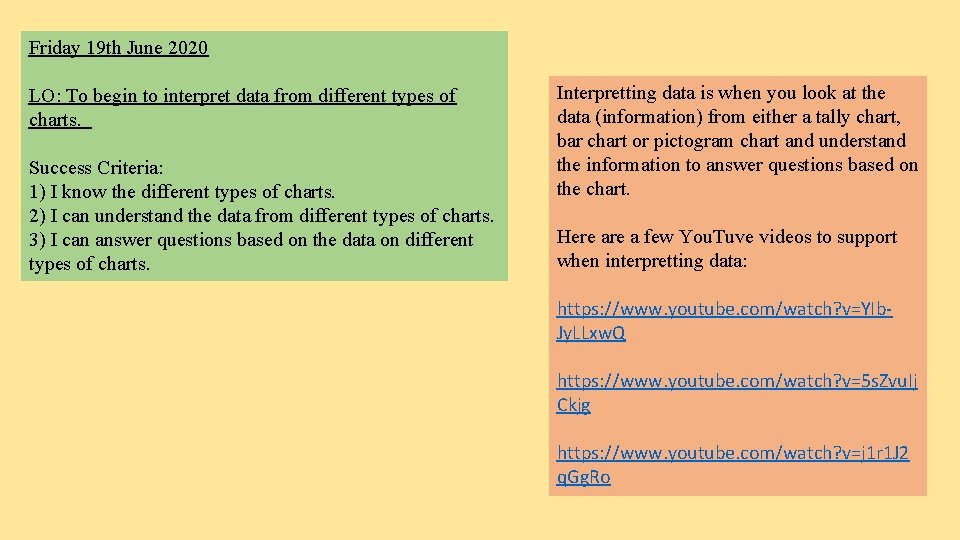
Friday 19 th June 2020 LO: To begin to interpret data from different types of charts. Success Criteria: 1) I know the different types of charts. 2) I can understand the data from different types of charts. 3) I can answer questions based on the data on different types of charts. Interpretting data is when you look at the data (information) from either a tally chart, bar chart or pictogram chart and understand the information to answer questions based on the chart. Here a few You. Tuve videos to support when interpretting data: https: //www. youtube. com/watch? v=YIb. Jy. LLxw. Q https: //www. youtube. com/watch? v=5 s. Zvu. Ij Ckjg https: //www. youtube. com/watch? v=j 1 r 1 J 2 q. Gg. Ro
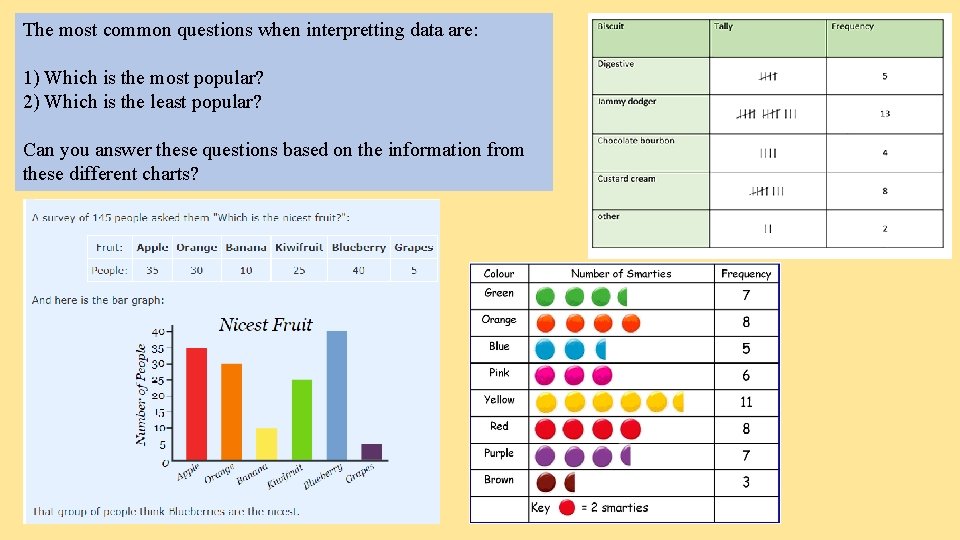
The most common questions when interpretting data are: 1) Which is the most popular? 2) Which is the least popular? Can you answer these questions based on the information from these different charts?