Indicators comparison Egypt Morocco Tunisia Civic participation and
- Slides: 12
Indicators comparison: Egypt, Morocco, Tunisia Civic participation and political changes. 2017
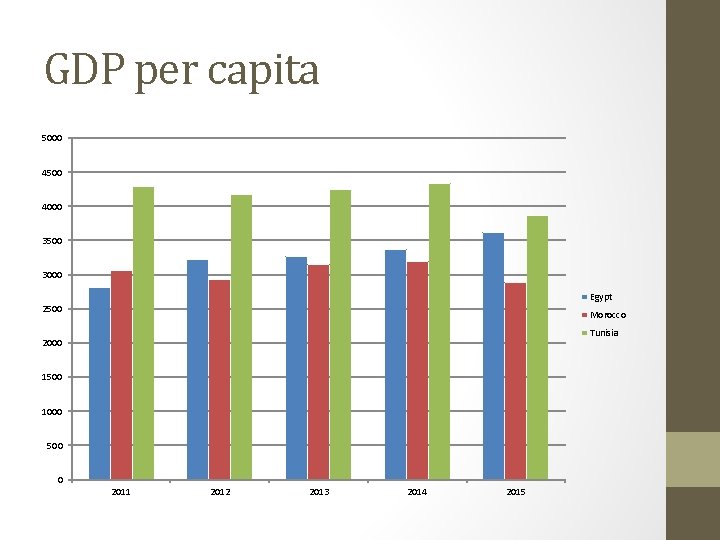
GDP per capita 5000 4500 4000 3500 3000 Egypt 2500 Morocco Tunisia 2000 1500 1000 500 0 2011 2012 2013 2014 2015
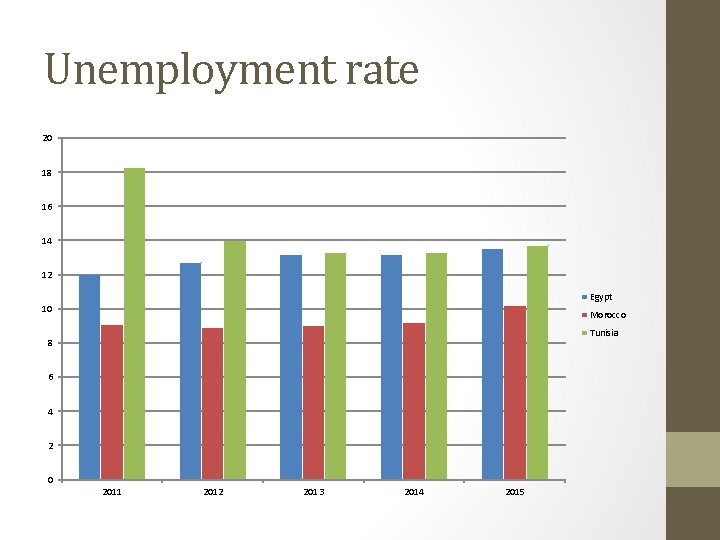
Unemployment rate 20 18 16 14 12 Egypt 10 Morocco Tunisia 8 6 4 2 0 2011 2012 2013 2014 2015
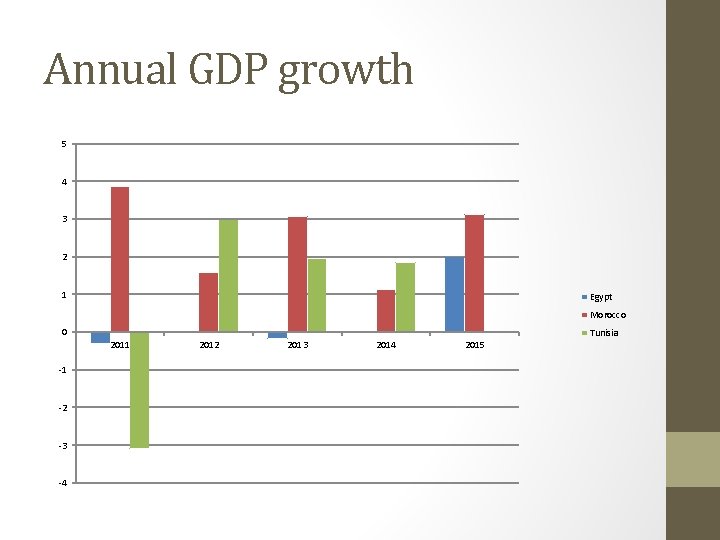
Annual GDP growth 5 4 3 2 1 Egypt Morocco 0 2011 -1 -2 -3 -4 2012 2013 2014 2015 Tunisia
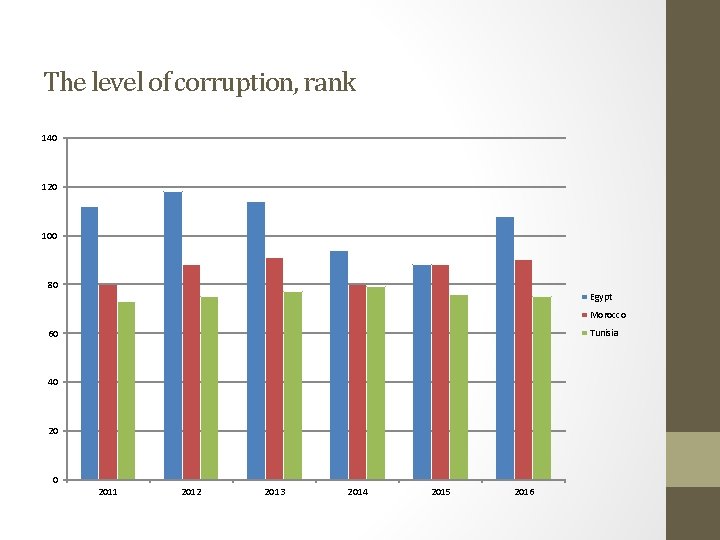
The level of corruption, rank 140 120 100 80 Egypt Morocco Tunisia 60 40 2011 2012 2013 2014 2015 2016
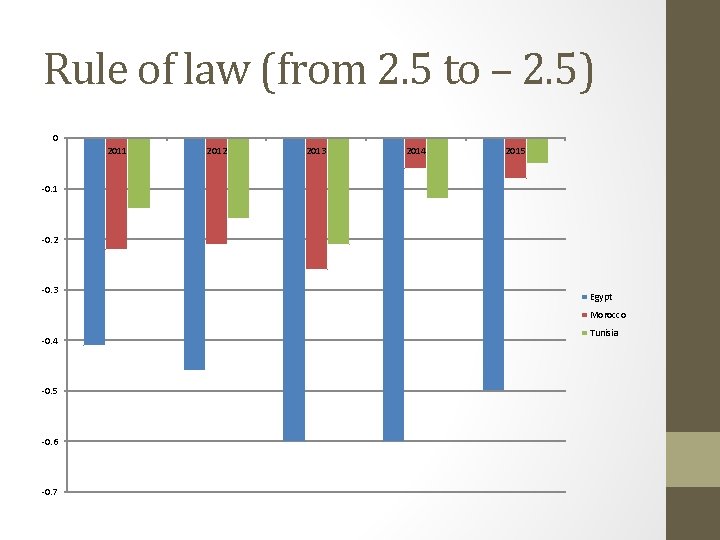
Rule of law (from 2. 5 to – 2. 5) 0 2011 2012 2013 2014 2015 -0. 1 -0. 2 -0. 3 Egypt Morocco -0. 4 -0. 5 -0. 6 -0. 7 Tunisia
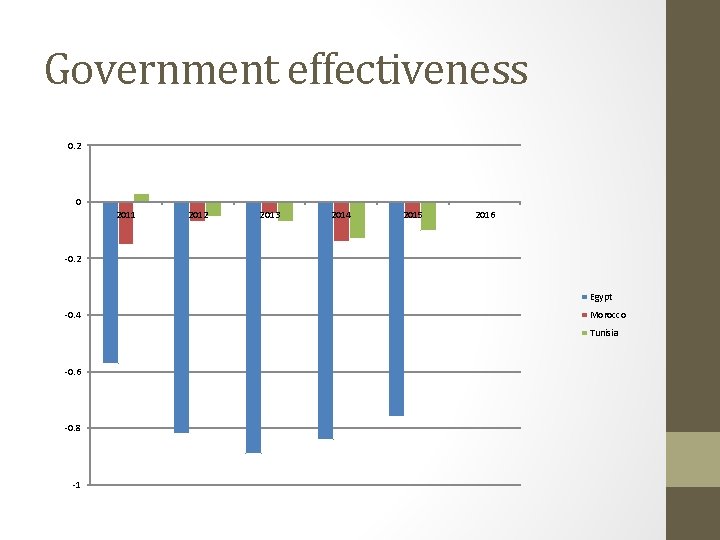
Government effectiveness 0. 2 0 2011 2012 2013 2014 2015 2016 -0. 2 Egypt -0. 4 Morocco Tunisia -0. 6 -0. 8 -1
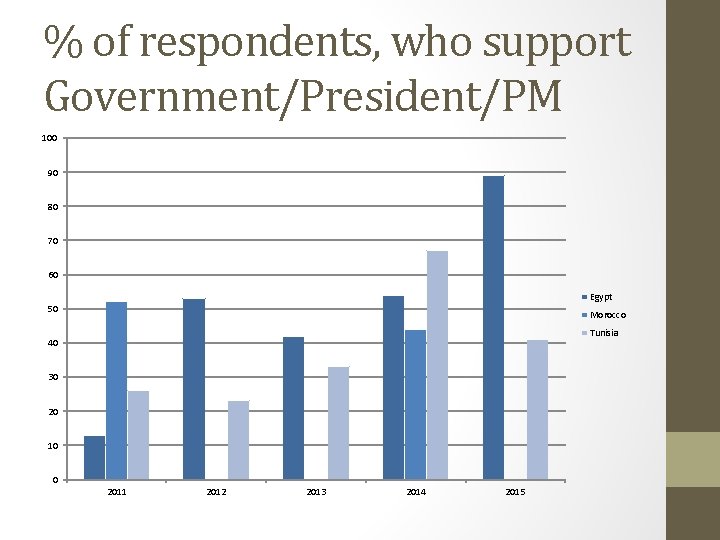
% of respondents, who support Government/President/PM 100 90 80 70 60 Egypt 50 Morocco Tunisia 40 30 20 10 0 2011 2012 2013 2014 2015
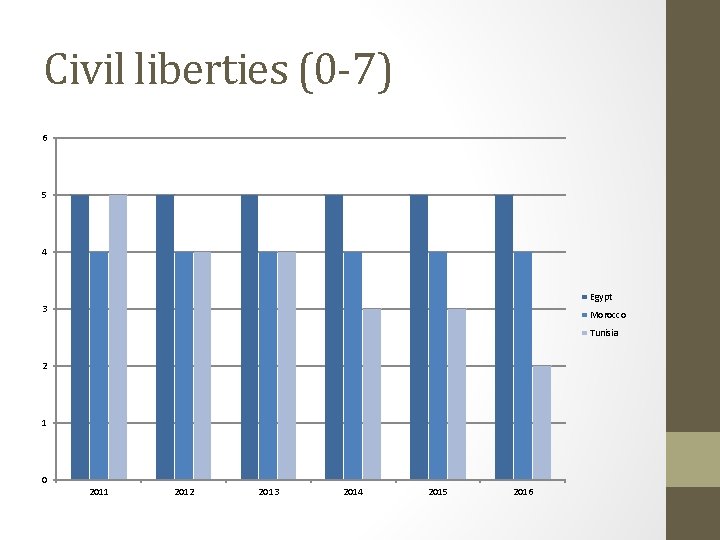
Civil liberties (0 -7) 6 5 4 Egypt 3 Morocco Tunisia 2 1 0 2011 2012 2013 2014 2015 2016
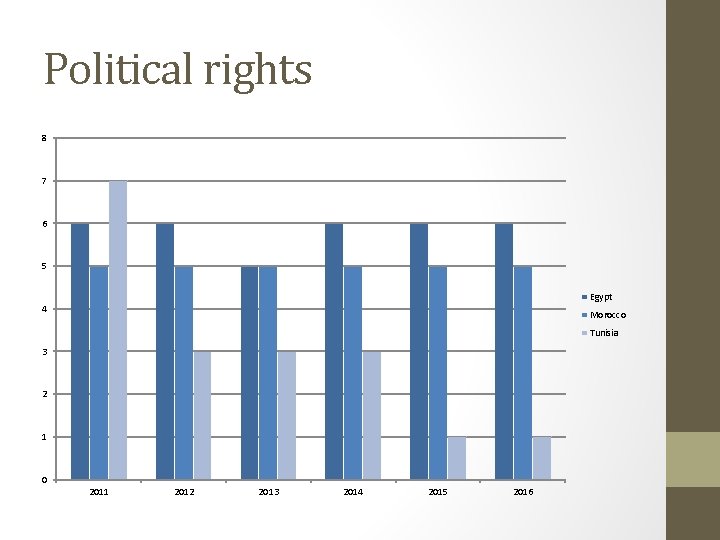
Political rights 8 7 6 5 Egypt 4 Morocco Tunisia 3 2 1 0 2011 2012 2013 2014 2015 2016
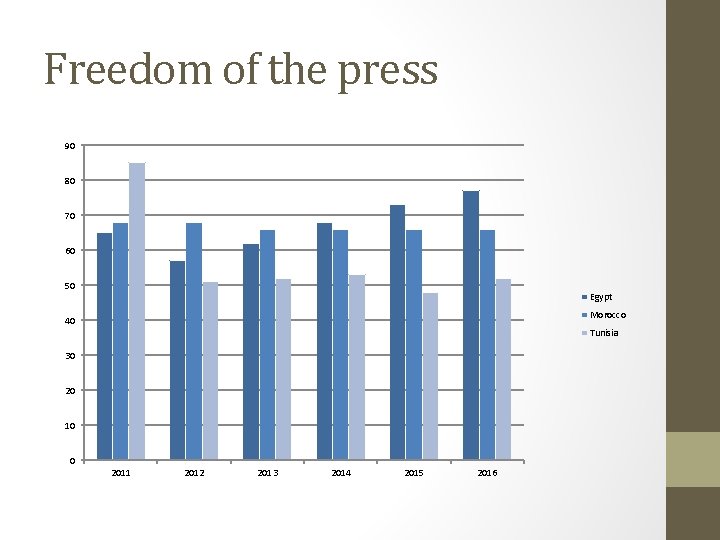
Freedom of the press 90 80 70 60 50 Egypt Morocco 40 Tunisia 30 20 10 0 2011 2012 2013 2014 2015 2016
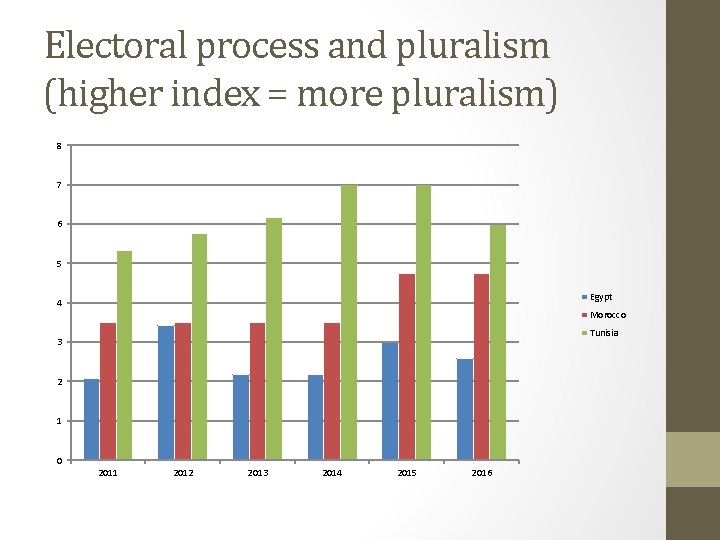
Electoral process and pluralism (higher index = more pluralism) 8 7 6 5 Egypt 4 Morocco Tunisia 3 2 1 0 2011 2012 2013 2014 2015 2016