Evaluating the Quick Fix Weight Loss Drugs and

- Slides: 17
Evaluating the Quick Fix: Weight Loss Drugs and Cellular Respiration Pamela L. Freeman, Jennifer A. Maki, Kara R. Thoemke, Monica H. Lamm, and Clark R. Coffman
Objectives § Explain how the energy from sugars is transformed into ATP via cellular respiration. § Predict an outcome if there is a perturbation in a cellular pathway. § State and evaluate a hypothesis. § Interpret data from a graph, and use that data to make inferences about the action of a drug. Please sit with your group, have your clicker ready, have your homework in hand, and pack your phone and computer away
[Prompt your students that today they will: § Work in groups to apply their knowledge of cellular respiration. § Interpret data from primary literature. § Evaluate and make a decision about the safety of a weight loss drug. and that it is expected they might feel challenged by the activities. ]
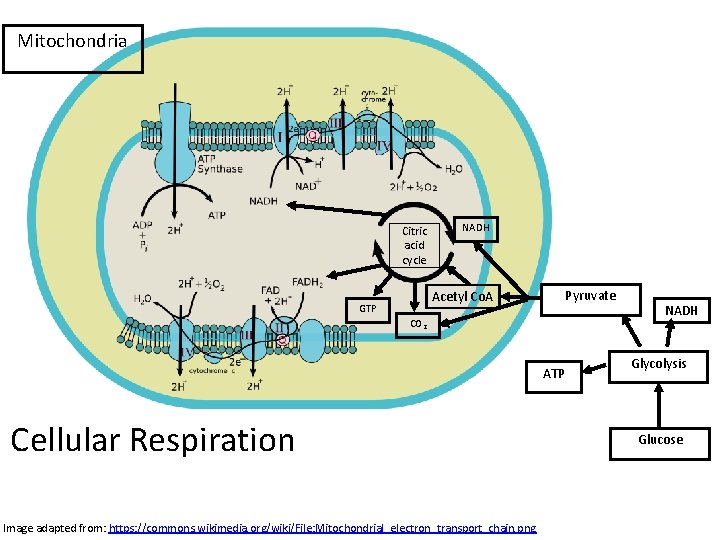
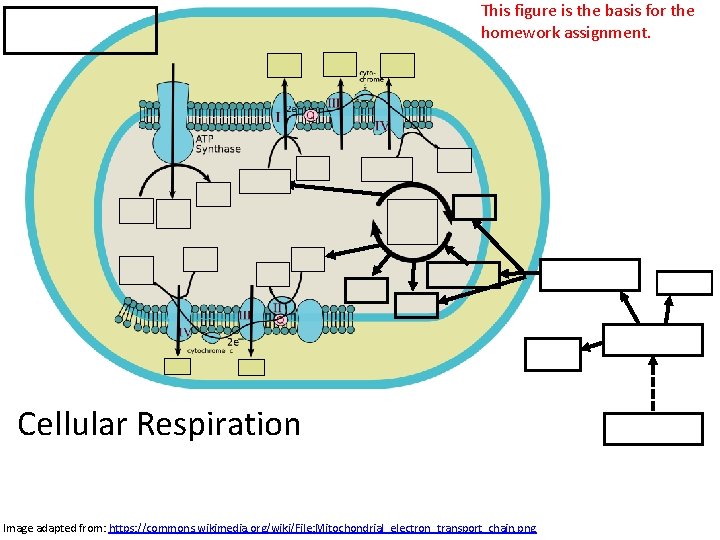
Mitochondria Citric acid cycle NADH Acetyl Co. A GTP Pyruvate CO 2 ATP Cellular Respiration Image adapted from: https: //commons. wikimedia. org/wiki/File: Mitochondrial_electron_transport_chain. png NADH Glycolysis Glucose
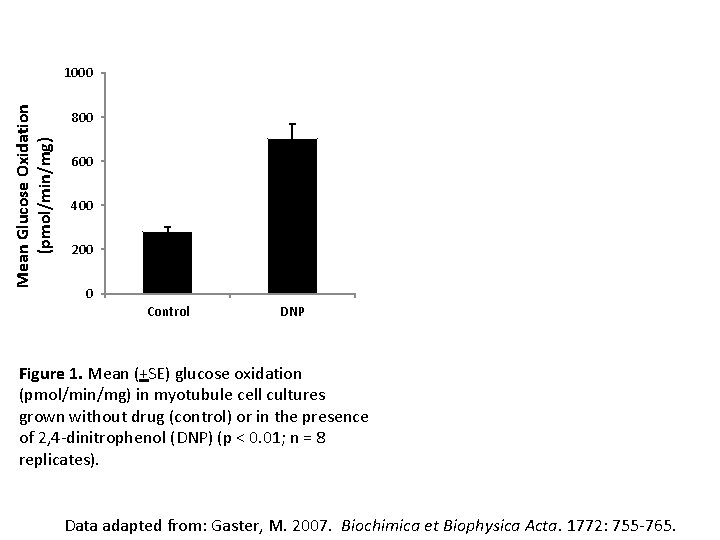
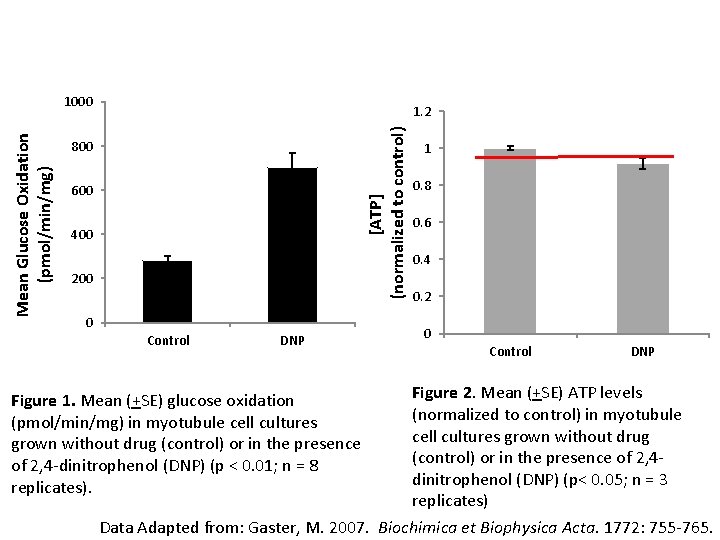
Mean Glucose Oxidation (pmol/min/mg) 1000 800 600 400 200 0 Control DNP Figure 1. Mean (+SE) glucose oxidation (pmol/min/mg) in myotubule cell cultures grown without drug (control) or in the presence of 2, 4 -dinitrophenol (DNP) (p < 0. 01; n = 8 replicates). Data adapted from: Gaster, M. 2007. Biochimica et Biophysica Acta. 1772: 755 -765.
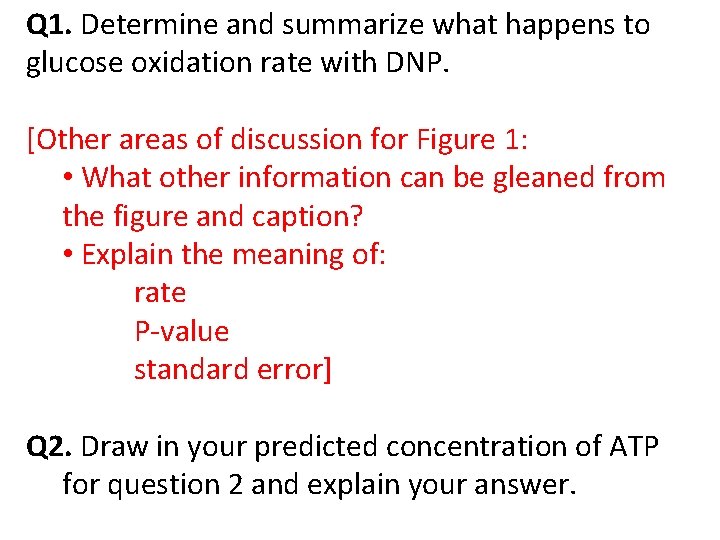
Q 1. Determine and summarize what happens to glucose oxidation rate with DNP. [Other areas of discussion for Figure 1: • What other information can be gleaned from the figure and caption? • Explain the meaning of: rate P-value standard error] Q 2. Draw in your predicted concentration of ATP for question 2 and explain your answer.
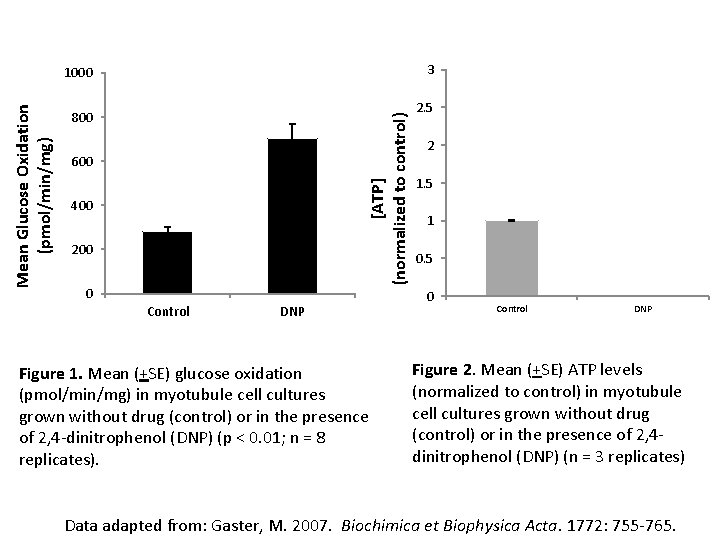
3 800 [ATP] (normalized to control) Mean Glucose Oxidation (pmol/min/mg) 1000 600 400 200 0 Control DNP Figure 1. Mean (+SE) glucose oxidation (pmol/min/mg) in myotubule cell cultures grown without drug (control) or in the presence of 2, 4 -dinitrophenol (DNP) (p < 0. 01; n = 8 replicates). 2. 5 2 1. 5 1 0. 5 0 Control DNP Figure 2. Mean (+SE) ATP levels (normalized to control) in myotubule cell cultures grown without drug (control) or in the presence of 2, 4 dinitrophenol (DNP) (n = 3 replicates) Data adapted from: Gaster, M. 2007. Biochimica et Biophysica Acta. 1772: 755 -765.
Q 2. What did you predict would happen to the ATP levels in the cells exposed to DNP? a. Stay the same b. Increase c. Decrease
33 1. 2 [ATP] (normalized to control) (normalized toto control) (normalized control) Mean Glucose Oxidation (pmol/min/mg) 1000 2. 5 1 800 600 22 0. 8 1. 5 0. 6 400 200 11 0. 4 0. 5 0. 2 0 Control DNP 000 Control DNP DNP Figure 2. Mean (+SE) ATP levels (normalized to control) in myotubule cell cultures grown without drug (control) or in the presence of 2, 4 dinitrophenol (DNP) (p< 0. 05; n = 3 replicates) Data Adapted from: Gaster, M. 2007. Biochimica et Biophysica Acta. 1772: 755 -765. Figure 1. Mean (+SE) glucose oxidation (pmol/min/mg) in myotubule cell cultures grown without drug (control) or in the presence of 2, 4 -dinitrophenol (DNP) (p < 0. 01; n = 8 replicates).
Q 3. What hypotheses explain the results in Figure 2? [List here or on the board all the different hypotheses generated by students. ]
[Before discussion of the mechanism of DNP, ask a question to make sure students are thinking. ] In which area of the mitochondria will the p. H be higher? a. Intermembrane space b. Matrix [Insert a textbook image of a mitochondrion with the electron transport chain, protons being pumped, etc. ]
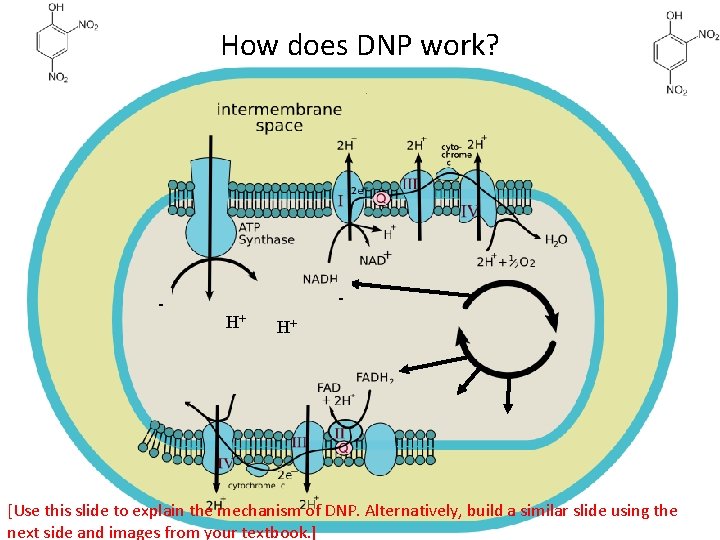
How does DNP work? - H+ H+ [Use this slide to explain the mechanism of DNP. Alternatively, build a similar slide using the next side and images from your textbook. ]
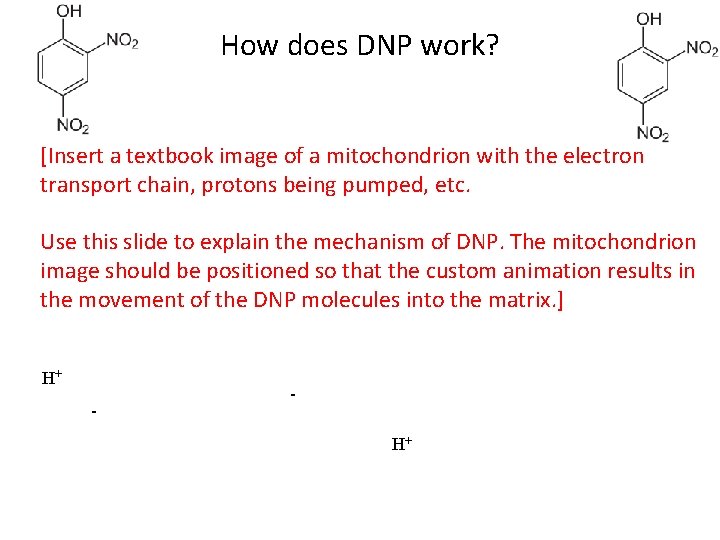
How does DNP work? [Insert a textbook image of a mitochondrion with the electron transport chain, protons being pumped, etc. Use this slide to explain the mechanism of DNP. The mitochondrion image should be positioned so that the custom animation results in the movement of the DNP molecules into the matrix. ] H+ - H+
Q 4. Given this data and what you’ve learned, what advice would you give Miguel? a. Take the DNP b. Don’t take the DNP
Q 5. Where does the weight go when someone loses weight?
This figure is the basis for the homework assignment. Cellular Respiration Image adapted from: https: //commons. wikimedia. org/wiki/File: Mitochondrial_electron_transport_chain. png