ECON 331 International Trade and Economics Introduction International


")


 collects trade")
: most aggregated, 0 - Food and")

- Slides: 25
ECON 331 International Trade and Economics Introduction
International Trade Exports—goods and services produced in one country and sold to other countries. Imports—goods and services consumed in a country but which have been purchased from other countries. Trade Deficit (Surplus)—a country has a trade deficit (surplus) if its imports (exports) exceeds its exports (imports).
World Exports and Output in Real Terms: 1950– 2007
Growth of World Exports What has caused the explosion of world trade? Reduction in trade barriers Advances in transportation, communication and technology Proliferation of trade agreements
TOP 10 EXPORTERS (2015)
SOME NOTES FROM GLOBAL TRADE The top ten merchandise traders accounted for 52% of the world’s total trade in 2015. Merchandise exports of WTO members totalled US$ 16. 2 trillion in 2015. The share of developing economies in merchandise exports increased from 33% in 2005 to 42% in 2015
SOME NOTES FROM GLOBAL TRADE Asia, Europe and North America have accounted for 88%in total merchandise trade of WTO members over the past ten years
Commodity Composition Top three most traded products Automobiles $1, 350 billion (Top Exporters – 1 -Germany ($150 billion) 2 – USA ($108 billion) 3 - Japan ($90 billion) Refined Petroleum 1 - USA ($62 bill. ) 2 -Russia ($45 bill. ) 3 -Singapore ($36 bill. ) Integrated Circuits
World Trade ın Major Products: 1994, 1999, 2003, 2006 (value ın bıllıons of $, percent share)
Geographic Trade Patterns Developed countries account for the bulk of world trade (largest exporters and importers). Developed countries trade primarily with each other. Developing countries rely on developed countries for their export markets. Countries trade mainly with neighbors.
Trading Partners of Selected Countries
Causes of Differences in Economic Growth of Countries Quantity and quality of resource endowments, particularly human capital Investment in plant and equipment (capital) Political and socioeconomic environment that is stable and conducive to competition
Index of Openness—a measure of how much a country participates in international trade; defined as the ratio of a country’s exports to its GDP (or GNP). Open Economy—a country with a high value of the index of openness. Closed Economy—a country with a relatively low index of openness.
Trade Openness Exports Plus Imports as a Percentage of GDP for Selected Countries Country Real Export plus Imports as a Percent of GDP Singapore 462. 9% Hong Kong 334. 4 Luxembourg 282. 0 Hungary 180. 0 Ireland 176. 7 Belgium 174. 0 Netherlands 146. 9 Taiwan 118. 1 Honduras 109. 7 Philippines 107. 7 Austria 103. 0 Costa Rica 96. 4 Korea 95. 5
TRADE OPENNESS Exports Plus Imports as a Percentage of GDP for Selected Countries Country Real Export plus Imports as a Percent of GDP Denmark 94. 5 Switzerland 90. 7 Sweden 88. 9 Canada 81. 8 Indonesia 81. 7 Portugal 79. 9 Nicaragua 79. 3 Iceland 78. 9 Israel 78. 3 Finland 77. 9 Ecuador 76. 9 Germany 76. 6 Norway 76. 4
Trade Openness Exports Plus Imports as a Percentage of GDP for Selected Countries Country Real Export plus Imports as a Percent of GDP Turkey 71. 2 Chile 71. 1 Poland 69. 5 Mexico 66. 8 Spain 65. 1 U. K. 59. 9 France 57. 5 Italy 54. 5 China 54. 4 South Africa 54. 4 Greece 54. 3 Australia 48. 9 U. S. 26. 6 Japan 23. 4
GLOBALIZATION Real World Exports of Goods as a Percentage of Real World GDP 25% – 20% – 15% – 10% – 5% – 0% – 1975 1980 1985 1990 1995 Exports as a Percent of GDP 2000 2005
GLOBALIZATION Globalization or the increasing openness of an economy, means changes that are not universally positive Globalization involves not only the goods and service but the movement of people and money as well International transactions occur because both parties expect the transaction to improve their welfare
GLOBALIZATION Globalization is the term used to convey the idea that international factors are becoming a more important part of the world economy The simplest measure of globalization is the ratio of exports to GDP Countries with a high ratio of exports to GDP are generally more open to the world economy than countries with a low ratio
Sources of Trade Data United Nation COMTRADE data base Internet access at http: //unstats. un. org/unsd/comtrade/ Other publications (e. g. UN Yearbook of International Trade Statistics, Country Profiles Commodity trade data bases for member countries World Trade Organisation (www. wto. org) IMF Direction of Trade: aggregate national trade flows (www. imf. org) OECD (www. oecd. org) European Statistical Agency: COMEXT data base International Trade Center Database INTRACEN (www. intracen. org)
Trade Data Collectıon United Nations Statistics Division (UNSD, http: //www. un. org/Depts/unsd/) collects trade data provided by UN member countries according to the Standard International Trade Classification (SITC) system The Standard International Trade Classification (SITC) Classifies trade flows into different product categories Product-based, not industry-based => each category involves some aggregation of products of different industries
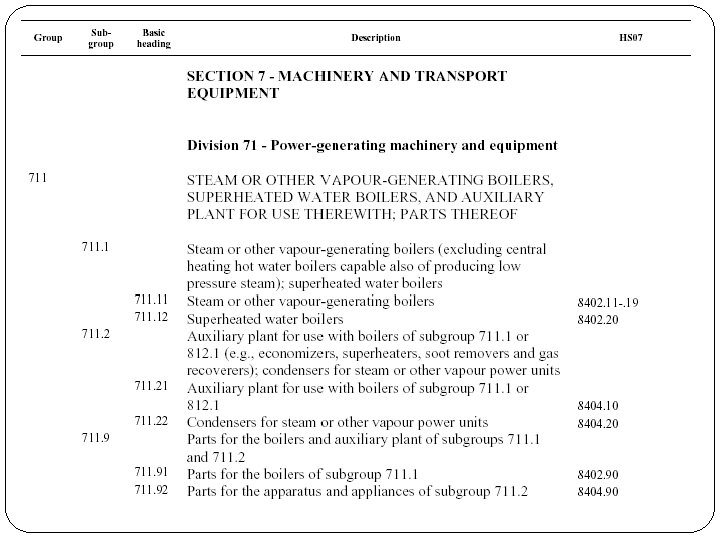
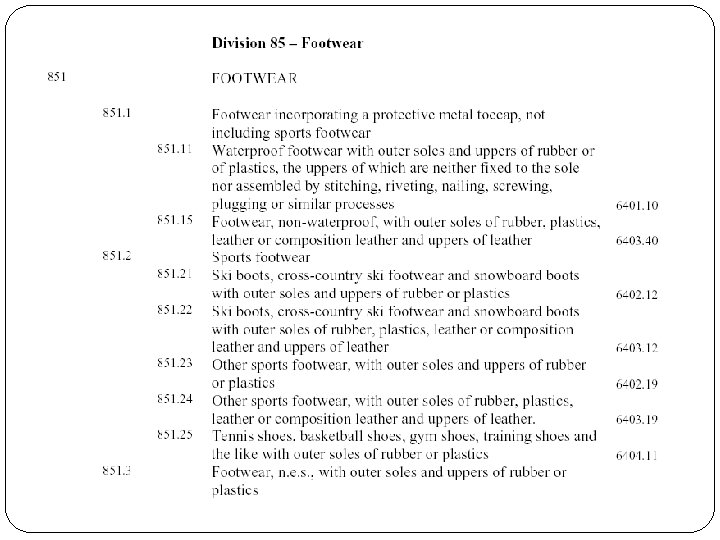
LEVELS OF AGGREGATION 10 sections (‘ 1 -digit’): most aggregated, 0 - Food and live animals 1 -Beverages and tobacco 2 -Crude materials, inedible, except fuels 3 -Mineral fuels, lubricants and related materials 4 -Animal and vegetable oils, fats and waxes 5 -Chemicals and related products, n. e. s 6 -Manufactured goods classified chiefly by material 7 - Machinery and transport equipment 8 -Miscellaneous manufactured articles 9 -Commodities and transactions not classified elsewhere in the SITC 67 divisions (‘ 2 -digit’), e. g. metalworking machinery (73) 262 groups (‘ 3 -digit’), e. g. ‘Machine tools working by removing metal or other material’ (731) 1023 subgroups (‘ 4 -digit’), 2970 items (‘ 5 -digit’)
Data on Country Characterıstıcs United Nations, Yearbook of National Account Statistics: national accounts data (GDP) International Labour Organization (ILO), Yearbook of International Labour Statistics: labour market data (labour force, wages, educational attainment …) UN Food and Agriculture Organization (FAO), Statistical Yearbook: data on food production, soil quality etc. World Bank, World Tables: mostly general macroeconomic series (GDP, industrial structure, population …) IMF, International Financial Statistics: focus on financial data (current account, exchange rates …) ILO, WB and IMF data all accessible via ESDS International