CFO Forum Annual Convention Eilat January 7 th
- Slides: 39
CFO Forum Annual Convention Eilat , January 7 th, 2014 Consumer Healthcare Nutritionals | Rx Pharmaceuticals
Forward – Looking Statements Certain statements in this presentation are forward-looking statements within the meaning of Section 21 E of the Securities Exchange Act of 1934, as amended, and are subject to the safe harbor created thereby. These statements relate to future events or the Company’s future financial performance and involve known and unknown risks, uncertainties and other factors that may cause the actual results, levels of activity, performance or achievements of the Company or its industry to be materially different from those expressed or implied by any forward-looking statements. In some cases, forward-looking statements can be identified by terminology such as “may, ” “will, ” “could, ” “would, ” “should, ” “expect, ” “plan, ” “anticipate, ” “intend, ” “believe, ” “estimate, ” “predict, ” “potential” or other comparable terminology. The Company has based these forward-looking statements on its current expectations, assumptions, estimates and projections. While the Company believes these expectations, assumptions, estimates and projections are reasonable, such forward-looking statements are only predictions and involve known and unknown risks and uncertainties, many of which are beyond the Company’s control. These and other important factors, including those discussed under “Risk Factors” in the Company’s Form 10 -K for the year ended June 29, 2013, as well as the Company’s subsequent filings with the Securities and Exchange Commission, may cause actual results, performance or achievements to differ materially from those expressed or implied by these forward-looking statements. The forward-looking statements in this presentation are made only as of the date hereof, and unless otherwise required by applicable securities laws, the Company disclaims any intention or obligation to update or revise any forward-looking statements, whether as a result of new information, future events or otherwise. 2 Quality Affordable Healthcare Products™
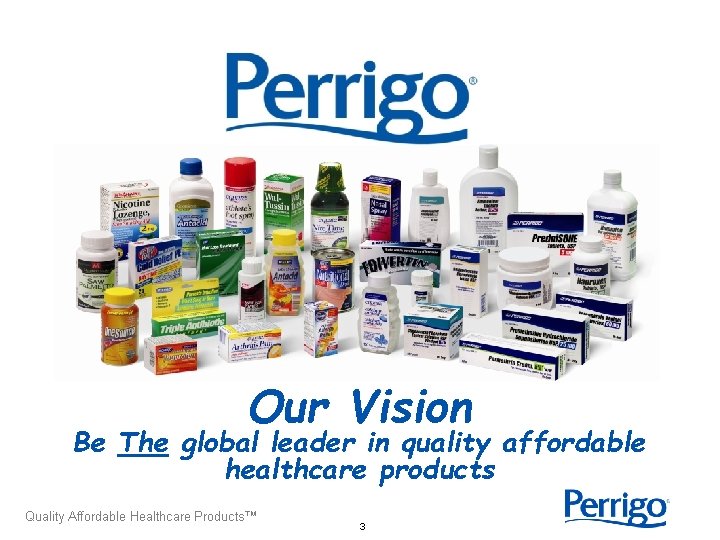
Our Vision Be The global leader in quality affordable healthcare products Quality Affordable Healthcare Products™ 3
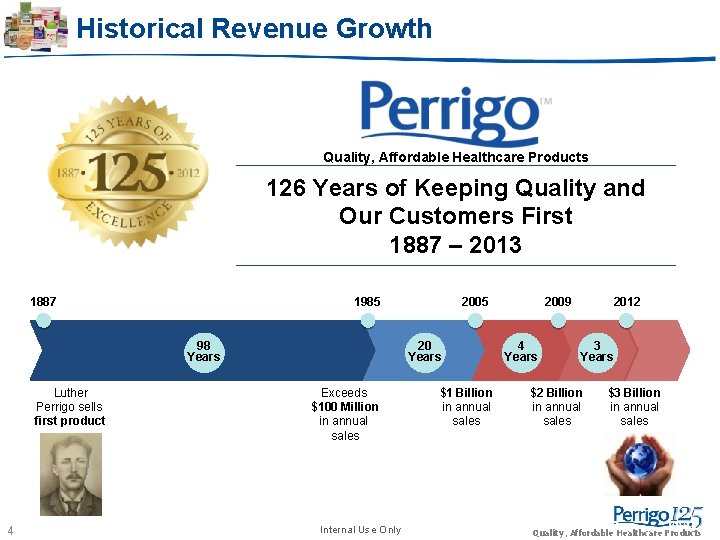
Historical Revenue Growth Quality, Affordable Healthcare Products 126 Years of Keeping Quality and Our Customers First 1887 – 2013 1887 1985 98 Years Luther Perrigo sells first product 4 2005 20 Years Exceeds $100 Million in annual sales Internal Use Only $1 Billion in annual sales 2009 4 Years 2012 3 Years $2 Billion in annual sales $3 Billion in annual sales Quality, Affordable Healthcare Products
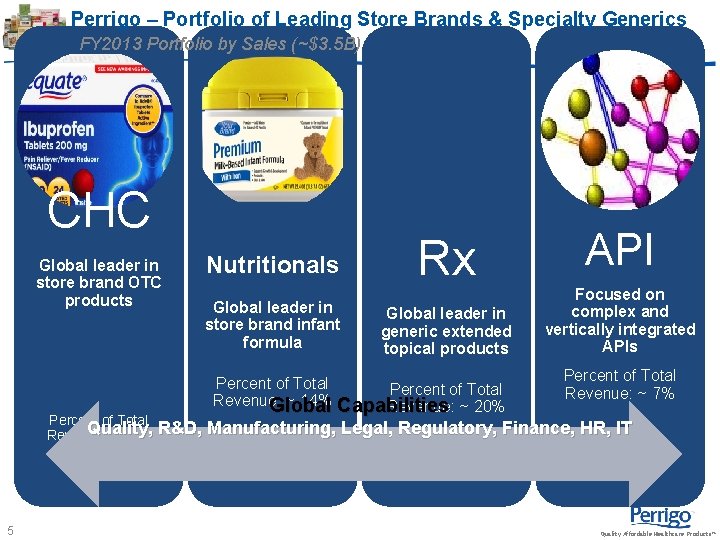
Perrigo – Portfolio of Leading Store Brands & Specialty Generics FY 2013 Portfolio by Sales (~$3. 5 B) CHC Global leader in store brand OTC products Nutritionals Global leader in store brand infant formula Rx Global leader in generic extended topical products API Focused on complex and vertically integrated APIs Percent of Total Revenue: ~ 7% Revenue: ~ 14% Global Capabilities Revenue: ~ 20% Percent of Total Quality, Revenue: ~ 59% R&D, Manufacturing, Legal, Regulatory, Finance, HR, IT 5 Quality Affordable Healthcare Products™
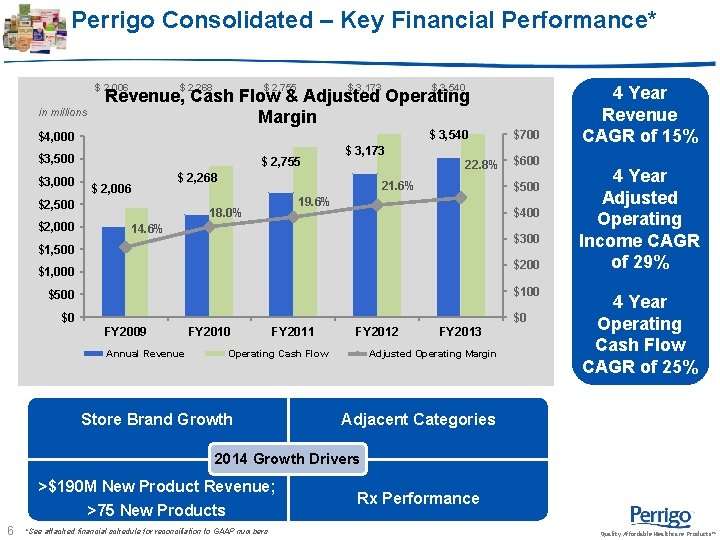
Perrigo Consolidated – Key Financial Performance* $ 2, 006 in millions $ 2, 755 $ 2, 268 $ 3, 173 $ 3, 540 Revenue, Cash Flow & Adjusted Operating Margin $ 3, 540 $4, 000 $3, 500 $3, 000 $ 2, 755 $ 2, 006 22. 8% $ 2, 268 $2, 500 $2, 000 $ 3, 173 21. 6% $600 $500 19. 6% 18. 0% $700 $400 14. 6% $300 $1, 500 $200 $1, 000 $100 $500 $0 $0 FY 2009 Annual Revenue FY 2010 FY 2011 FY 2012 Operating Cash Flow Store Brand Growth FY 2013 Adjusted Operating Margin 4 Year Revenue CAGR of 15% 4 Year Adjusted Operating Income CAGR of 29% 4 Year Operating Cash Flow CAGR of 25% Adjacent Categories 2014 Growth Drivers >$190 M New Product Revenue; >75 New Products *See attached financial schedule for reconciliation to GAAP numbers 6 *See financial schedule for reconciliation to GAAP numbers. Rx Performance Quality Affordable Healthcare Products™
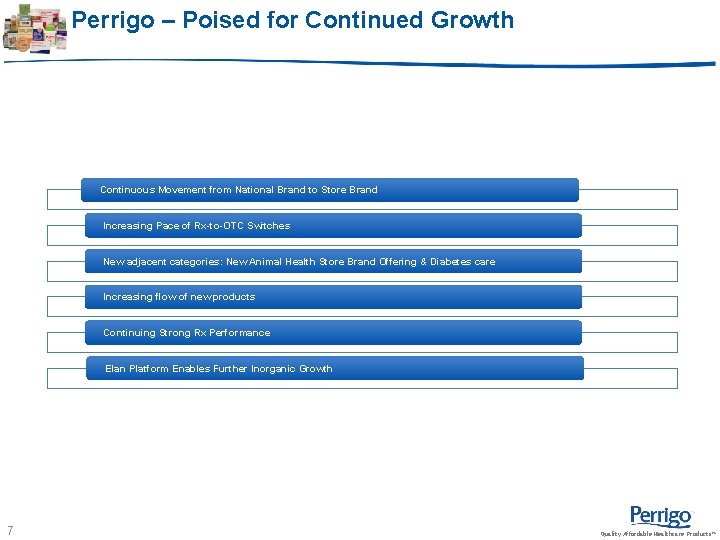
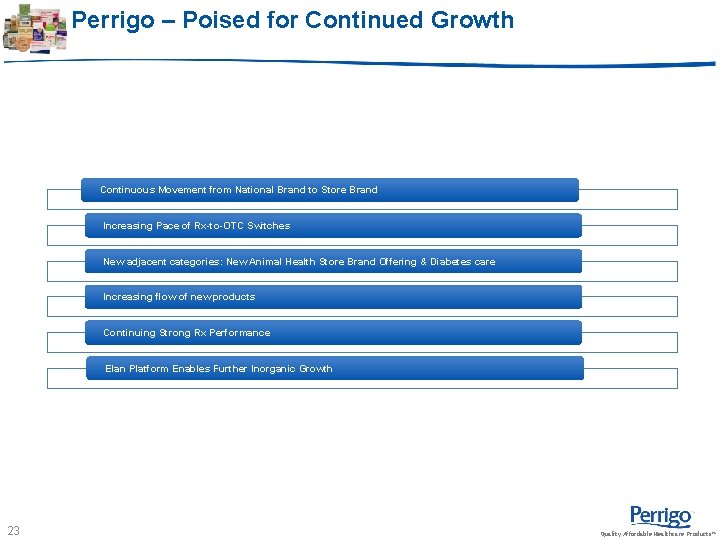
Perrigo – Poised for Continued Growth Continuous Movement from National Brand to Store Brand Increasing Pace of Rx-to-OTC Switches New adjacent categories: New Animal Health Store Brand Offering & Diabetes care Increasing flow of new products Continuing Strong Rx Performance Elan Platform Enables Further Inorganic Growth 7 Quality Affordable Healthcare Products™
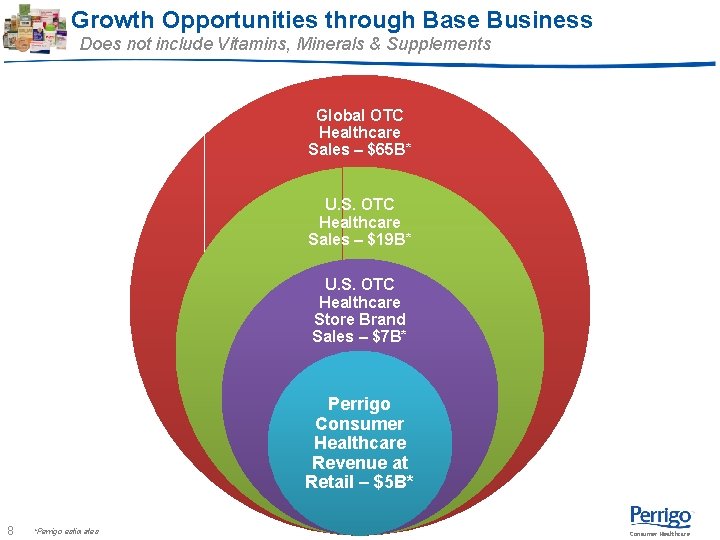
Growth Opportunities through Base Business Does not include Vitamins, Minerals & Supplements Global OTC Healthcare Sales – $65 B* U. S. OTC Healthcare Sales – $19 B* U. S. OTC Healthcare Store Brand Sales – $7 B* Perrigo Consumer Healthcare Revenue at Retail – $5 B* 8 *Perrigo estimates Consumer Healthcare
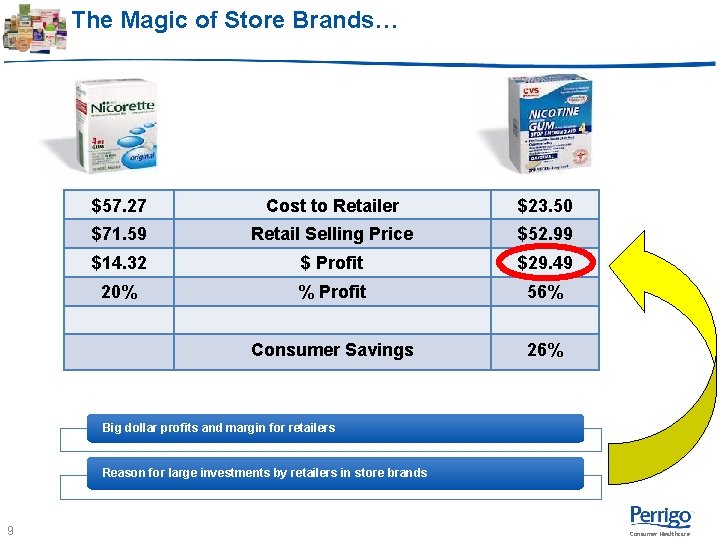
The Magic of Store Brands… $57. 27 Cost to Retailer $23. 50 $71. 59 Retail Selling Price $52. 99 $14. 32 $ Profit $29. 49 20% % Profit 56% Consumer Savings 26% Big dollar profits and margin for retailers Reason for large investments by retailers in store brands 9 Consumer Healthcare
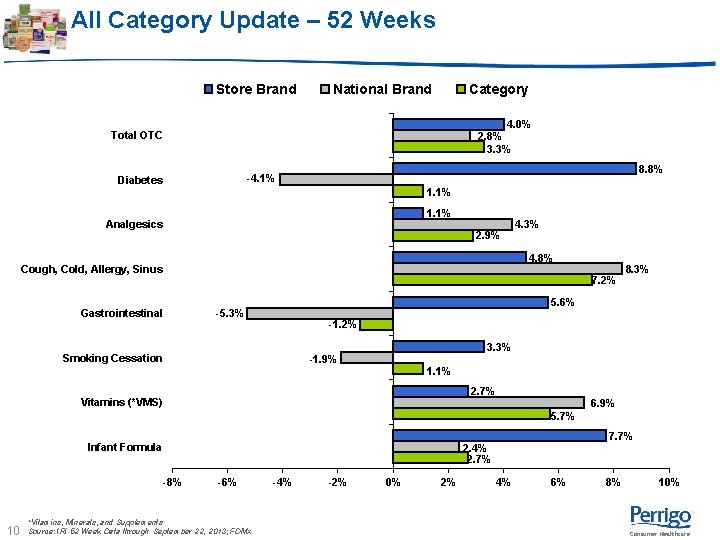
All Category Update – 52 Weeks Store Brand National Brand Category 4. 0% 2. 8% 3. 3% Total OTC 8. 8% -4. 1% Diabetes 1. 1% Analgesics 2. 9% 4. 3% 4. 8% Cough, Cold, Allergy, Sinus 7. 2% Gastrointestinal 8. 3% 5. 6% -5. 3% -1. 2% 3. 3% Smoking Cessation -1. 9% 1. 1% 2. 7% Vitamins (*VMS) 6. 9% 5. 7% 7. 7% Infant Formula 2. 4% 2. 7% -8% 10 -6% *Vitamins, Minerals, and Supplements Source: IRI 52 Week Data through September 22, 2013; FDMx -4% -2% 0% 2% 4% 6% 8% 10% Consumer Healthcare
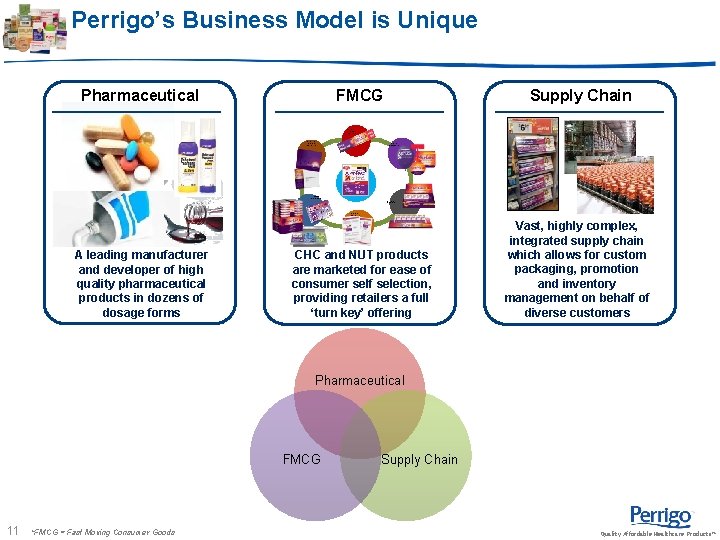
Perrigo’s Business Model is Unique Pharmaceutical FMCG Supply Chain At-Launch Web Banners Direct-to. Consumer Marketing At-Shelf Messaging In-Season Programs Off-Shelf Displays Pharmacy Marketing A leading manufacturer and developer of high quality pharmaceutical products in dozens of dosage forms CHC and NUT products are marketed for ease of consumer self selection, providing retailers a full ‘turn key’ offering Vast, highly complex, integrated supply chain which allows for custom packaging, promotion and inventory management on behalf of diverse customers Pharmaceutical FMCG 11 *FMCG = Fast Moving Consumer Goods Supply Chain Quality Affordable Healthcare Products™
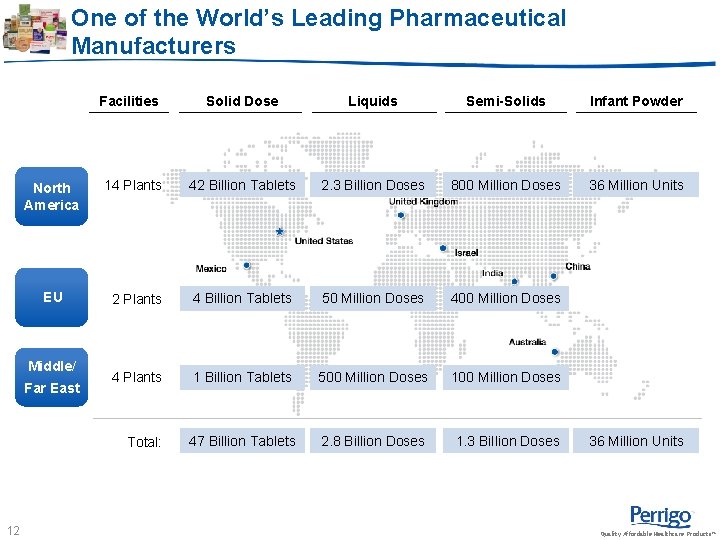
One of the World’s Leading Pharmaceutical Manufacturers Facilities Solid Dose Liquids Semi-Solids Infant Powder North America 14 Plants 42 Billion Tablets 2. 3 Billion Doses 800 Million Doses 36 Million Units EU 2 Plants 4 Billion Tablets 50 Million Doses 400 Million Doses 4 Plants 1 Billion Tablets 500 Million Doses 100 Million Doses Total: 47 Billion Tablets 2. 8 Billion Doses 1. 3 Billion Doses Middle/ Far East 12 36 Million Units Quality Affordable Healthcare Products™
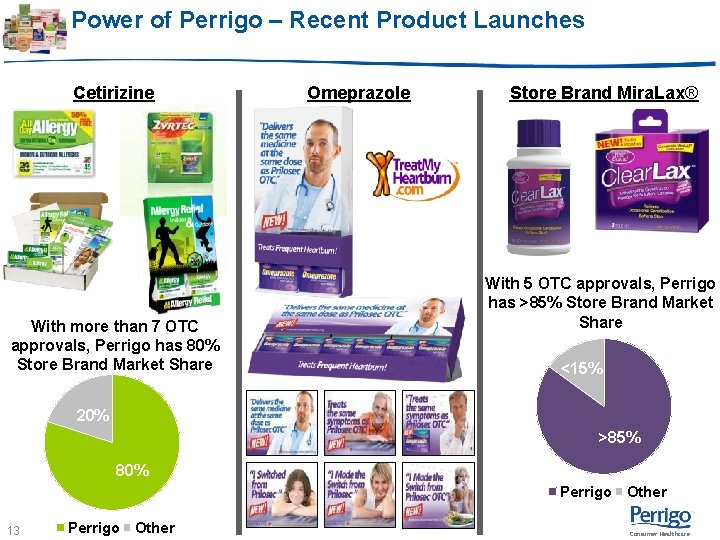
Power of Perrigo – Recent Product Launches Cetirizine With more than 7 OTC approvals, Perrigo has 80% Store Brand Market Share Omeprazole Store Brand Mira. Lax® With 5 OTC approvals, Perrigo has >85% Store Brand Market Share <15% 20% >85% 80% Perrigo 13 Perrigo Other Consumer Healthcare
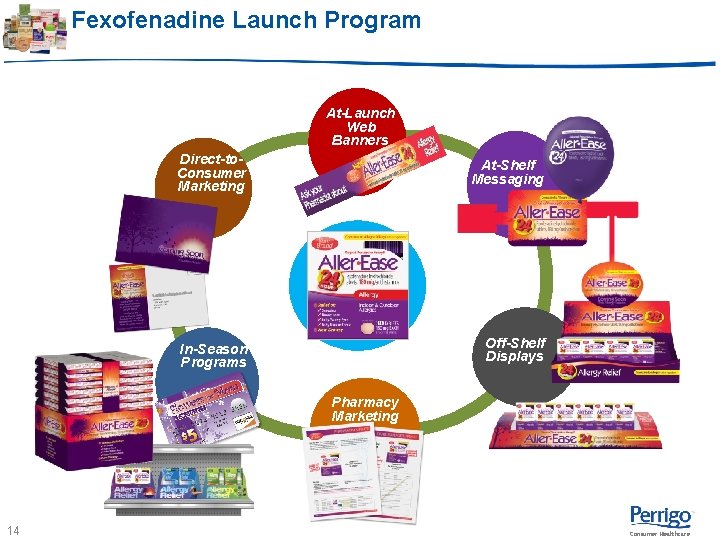
Fexofenadine Launch Program At-Launch Web Banners Direct-to. Consumer Marketing At-Shelf Messaging In-Season Programs Off-Shelf Displays Pharmacy Marketing 14 Consumer Healthcare
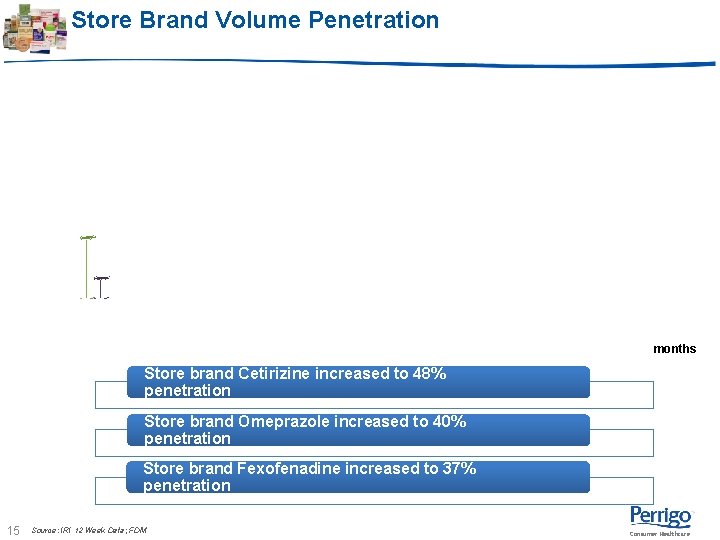
Store Brand Volume Penetration months Store brand Cetirizine increased to 48% penetration Store brand Omeprazole increased to 40% penetration Store brand Fexofenadine increased to 37% penetration 15 Source: IRI 12 Week Data; FDM Consumer Healthcare
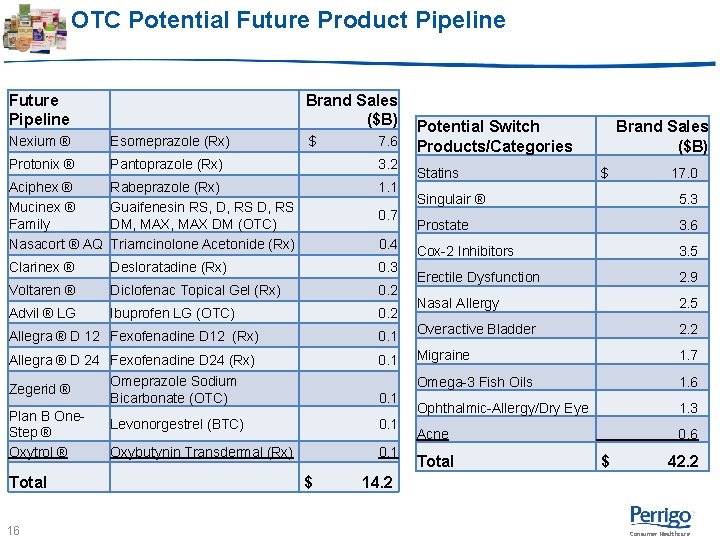
OTC Potential Future Product Pipeline Future Pipeline Brand Sales ($B) Potential Switch $ 7. 6 Products/Categories Nexium ® Esomeprazole (Rx) Protonix ® Pantoprazole (Rx) 3. 2 Aciphex ® Mucinex ® Family Nasacort ® AQ Rabeprazole (Rx) Guaifenesin RS, D, RS DM, MAX DM (OTC) Triamcinolone Acetonide (Rx) 1. 1 Clarinex ® Desloratadine (Rx) 0. 3 Voltaren ® Diclofenac Topical Gel (Rx) 0. 2 Advil ® LG Ibuprofen LG (OTC) 0. 2 0. 7 0. 4 Statins Brand Sales ($B) $ 17. 0 Singulair ® 5. 3 Prostate 3. 6 Cox-2 Inhibitors 3. 5 Erectile Dysfunction 2. 9 Nasal Allergy 2. 5 Allegra ® D 12 Fexofenadine D 12 (Rx) 0. 1 Overactive Bladder 2. 2 Allegra ® D 24 Fexofenadine D 24 (Rx) 0. 1 Migraine 1. 7 Omega-3 Fish Oils 1. 6 Ophthalmic-Allergy/Dry Eye 1. 3 Acne 0. 6 Zegerid ® Plan B One. Step ® Oxytrol ® Total 16 Omeprazole Sodium Bicarbonate (OTC) 0. 1 Levonorgestrel (BTC) 0. 1 Oxybutynin Transdermal (Rx) 0. 1 Total $ 42. 2 $ 14. 2 Consumer Healthcare
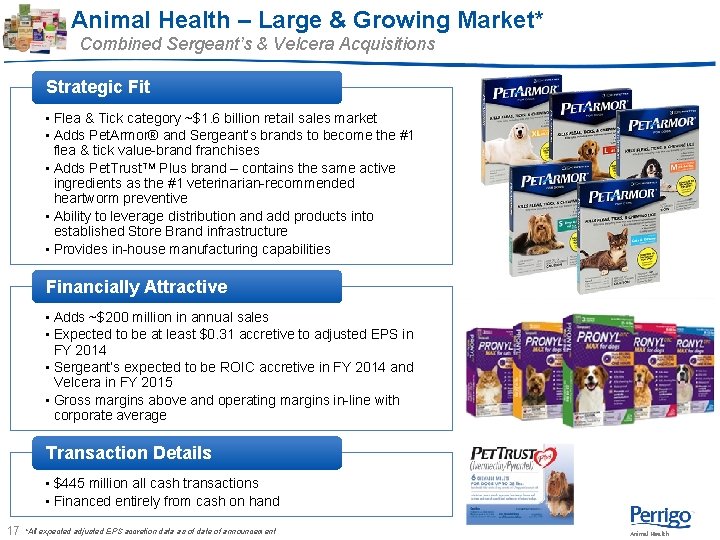
Animal Health – Large & Growing Market* Combined Sergeant’s & Velcera Acquisitions Strategic Fit • Flea & Tick category ~$1. 6 billion retail sales market • Adds Pet. Armor® and Sergeant’s brands to become the #1 flea & tick value-brand franchises • Adds Pet. Trust. TM Plus brand – contains the same active ingredients as the #1 veterinarian-recommended heartworm preventive • Ability to leverage distribution and add products into established Store Brand infrastructure • Provides in-house manufacturing capabilities Financially Attractive • Adds ~$200 million in annual sales • Expected to be at least $0. 31 accretive to adjusted EPS in FY 2014 • Sergeant’s expected to be ROIC accretive in FY 2014 and Velcera in FY 2015 • Gross margins above and operating margins in-line with corporate average Transaction Details • $445 million all cash transactions • Financed entirely from cash on hand 17 *All expected adjusted EPS accretion data as of date of announcement Animal Health
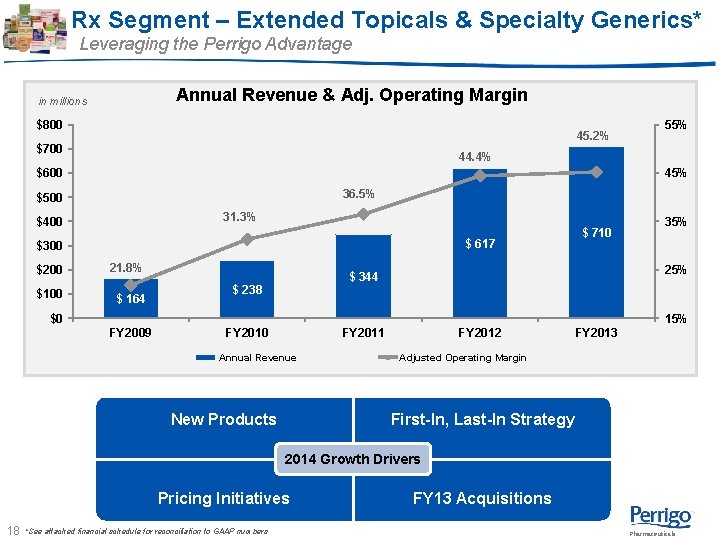
Rx Segment – Extended Topicals & Specialty Generics* Leveraging the Perrigo Advantage Annual Revenue & Adj. Operating Margin in millions $800 45. 2% $700 55% 44. 4% $600 45% 36. 5% $500 31. 3% $400 $ 617 $300 $200 21. 8% $100 $ 164 $ 710 25% $ 344 $ 238 35% $0 15% FY 2009 FY 2010 FY 2011 Annual Revenue New Products FY 2012 FY 2013 Adjusted Operating Margin First-In, Last-In Strategy 2014 Growth Drivers Pricing Initiatives 18 *See attached financial schedule for reconciliation to GAAP numbers FY 13 Acquisitions Pharmaceuticals
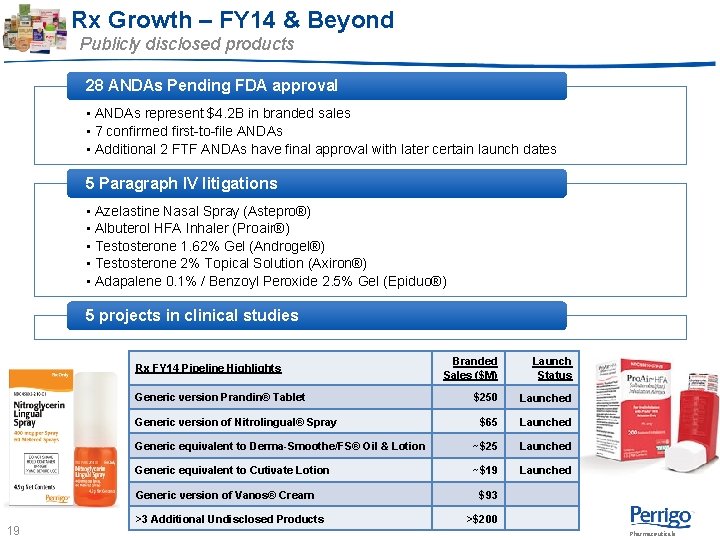
Rx Growth – FY 14 & Beyond Publicly disclosed products 28 ANDAs Pending FDA approval • ANDAs represent $4. 2 B in branded sales • 7 confirmed first-to-file ANDAs • Additional 2 FTF ANDAs have final approval with later certain launch dates 5 Paragraph IV litigations • Azelastine Nasal Spray (Astepro®) • Albuterol HFA Inhaler (Proair®) • Testosterone 1. 62% Gel (Androgel®) • Testosterone 2% Topical Solution (Axiron®) • Adapalene 0. 1% / Benzoyl Peroxide 2. 5% Gel (Epiduo®) 5 projects in clinical studies Branded Sales ($M) Launch Status $250 Launched $65 Launched Generic equivalent to Derma-Smoothe/FS® Oil & Lotion ~$25 Launched Generic equivalent to Cutivate Lotion ~$19 Launched Rx FY 14 Pipeline Highlights Generic version Prandin® Tablet Generic version of Nitrolingual® Spray Generic version of Vanos® Cream 19 >3 Additional Undisclosed Products $93 >$200 Pharmaceuticals
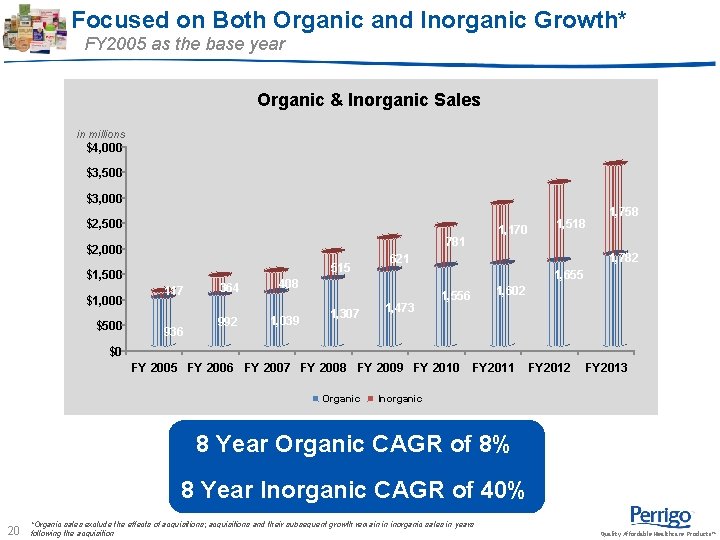
Focused on Both Organic and Inorganic Growth* FY 2005 as the base year Organic & Inorganic Sales in millions $4, 000 $3, 500 $3, 000 $2, 500 515 $1, 500 $1, 000 $500 1, 170 781 $2, 000 117 936 364 992 1, 039 1, 758 1, 782 621 1, 655 408 1, 307 1, 518 1, 473 1, 602 1, 556 $0 FY 2005 FY 2006 FY 2007 FY 2008 FY 2009 FY 2010 Organic FY 2011 FY 2012 FY 2013 Inorganic 8 Year Organic CAGR of 8% 8 Year Inorganic CAGR of 40% 20 *Organic sales exclude the effects of acquisitions; acquisitions and their subsequent growth remain in inorganic sales in years following the acquisition Quality Affordable Healthcare Products™
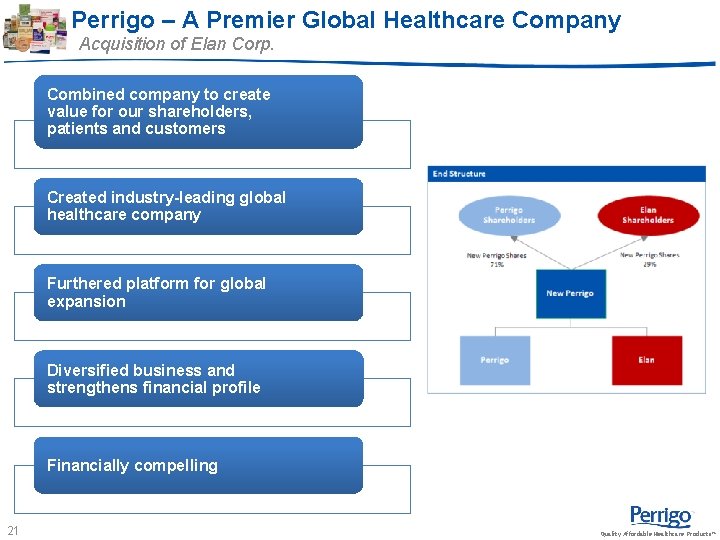
Perrigo – A Premier Global Healthcare Company Acquisition of Elan Corp. Combined company to create value for our shareholders, patients and customers Created industry-leading global healthcare company Furthered platform for global expansion Diversified business and strengthens financial profile Financially compelling 21 Quality Affordable Healthcare Products™
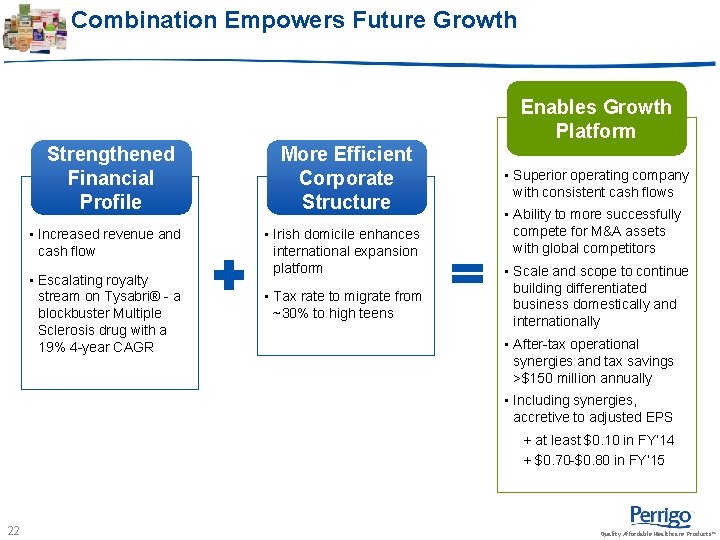
Combination Empowers Future Growth Enables Growth Platform Strengthened Financial Profile More Efficient Corporate Structure • Increased revenue and cash flow • Irish domicile enhances international expansion platform • Escalating royalty stream on Tysabri® - a blockbuster Multiple Sclerosis drug with a 19% 4 -year CAGR • Tax rate to migrate from ~30% to high teens • Superior operating company with consistent cash flows • Ability to more successfully compete for M&A assets with global competitors • Scale and scope to continue building differentiated business domestically and internationally • After-tax operational synergies and tax savings >$150 million annually • Including synergies, accretive to adjusted EPS + at least $0. 10 in FY’ 14 + $0. 70 -$0. 80 in FY’ 15 22 Quality Affordable Healthcare Products™
Perrigo – Poised for Continued Growth Continuous Movement from National Brand to Store Brand Increasing Pace of Rx-to-OTC Switches New adjacent categories: New Animal Health Store Brand Offering & Diabetes care Increasing flow of new products Continuing Strong Rx Performance Elan Platform Enables Further Inorganic Growth 23 Quality Affordable Healthcare Products™
Q&A 24 Quality Affordable Healthcare Products™
Appendix 25 Quality Affordable Healthcare Products™
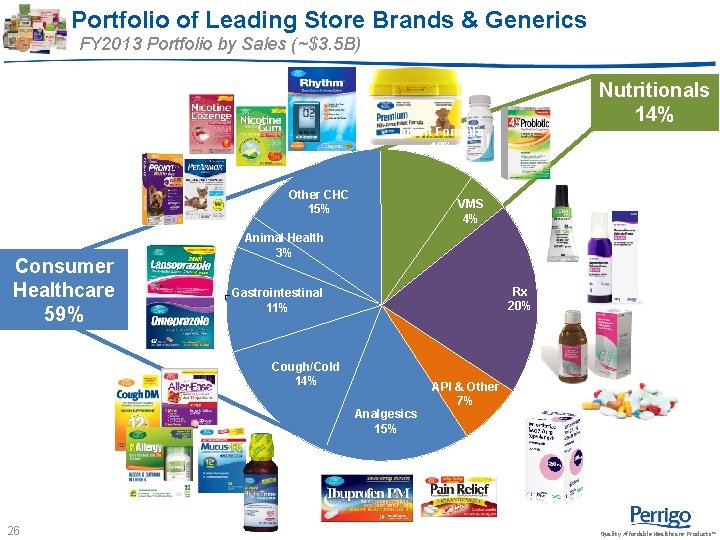
Portfolio of Leading Store Brands & Generics FY 2013 Portfolio by Sales (~$3. 5 B) Nutritionals 14% Infant Formula 10% Other CHC 15% Consumer Healthcare 59% VMS 4% Animal Health 3% Rx 20% Gastrointestinal 11% Cough/Cold 14% Analgesics 15% 26 API & Other 7% Quality Affordable Healthcare Products™
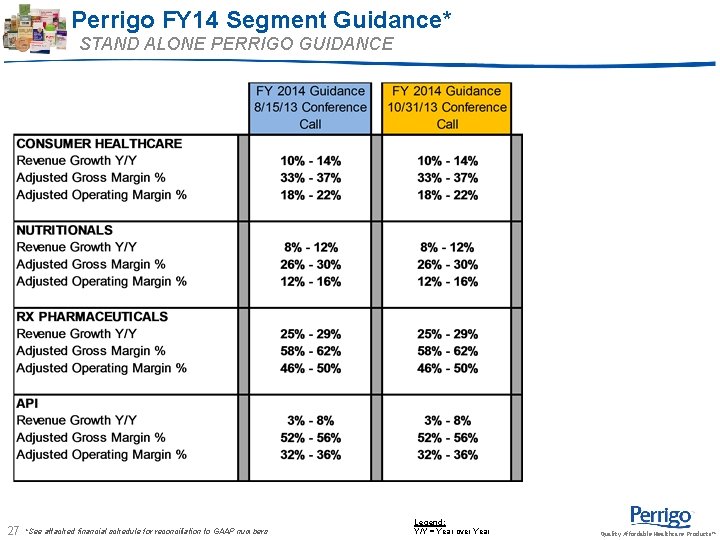
Perrigo FY 14 Segment Guidance* STAND ALONE PERRIGO GUIDANCE 27 *See attached financial schedule for reconciliation to GAAP numbers Legend: Y/Y = Year over Year Quality Affordable Healthcare Products™
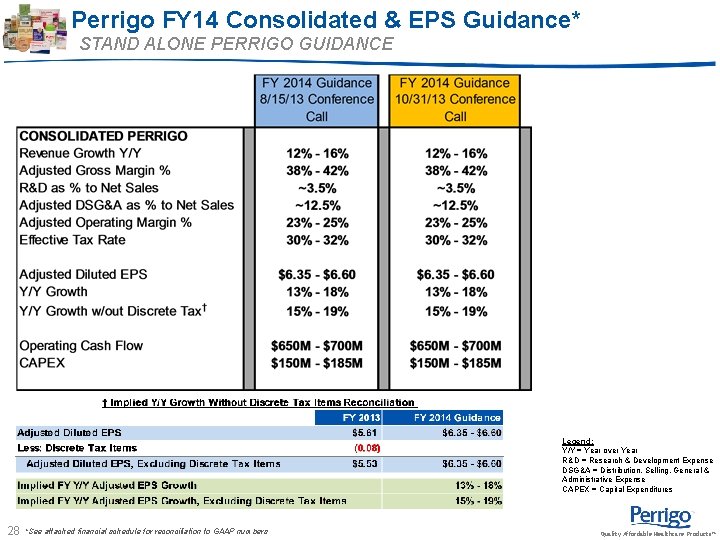
Perrigo FY 14 Consolidated & EPS Guidance* STAND ALONE PERRIGO GUIDANCE Legend: Y/Y = Year over Year R&D = Research & Development Expense DSG&A = Distribution, Selling, General & Administrative Expense CAPEX = Capital Expenditures 28 *See attached financial schedule for reconciliation to GAAP numbers Quality Affordable Healthcare Products™
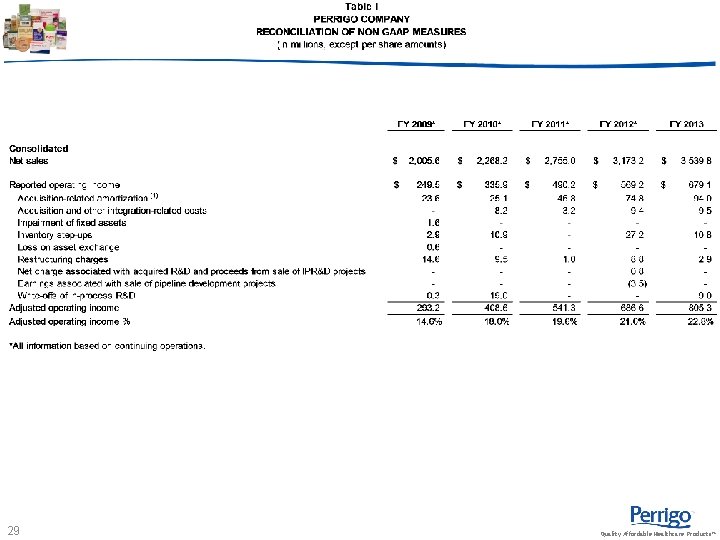
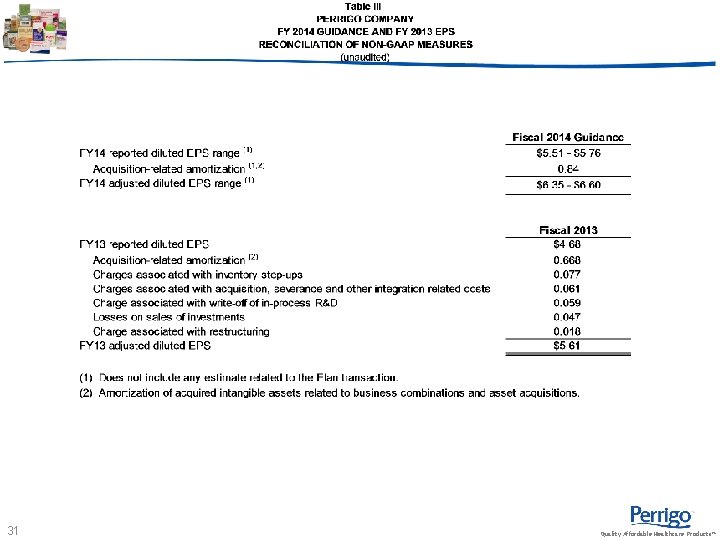
29 Quality Affordable Healthcare Products™
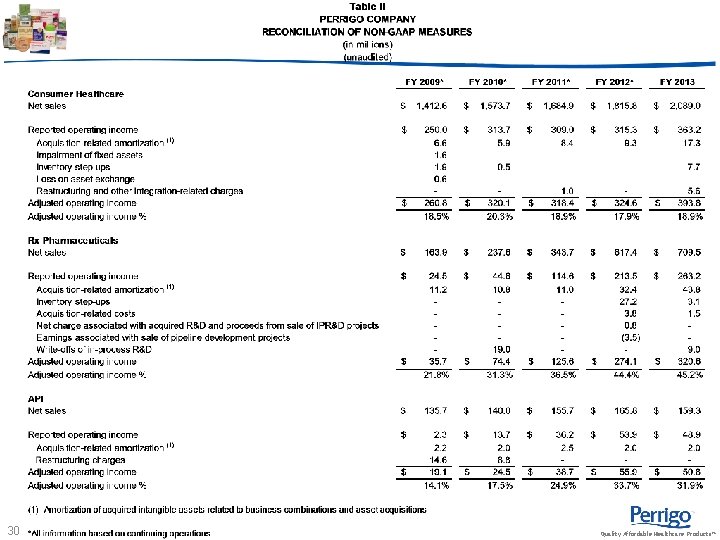
30 Quality Affordable Healthcare Products™
31 Quality Affordable Healthcare Products™
32 Quality Affordable Healthcare Products™
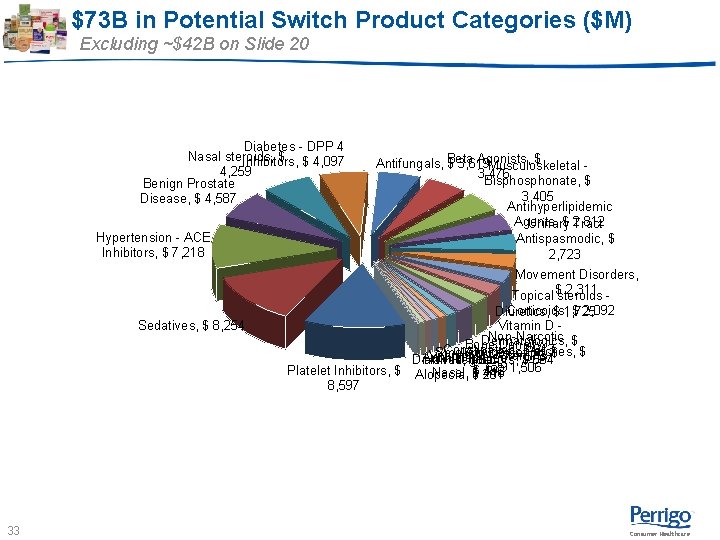
$73 B in Potential Switch Product Categories ($M) Excluding ~$42 B on Slide 20 Diabetes - DPP 4 Nasal steroids, $ $ 4, 097 Inhibitors, 4, 259 Benign Prostate Disease, $ 4, 587 Hypertension - ACE Inhibitors, $ 7, 218 Agonists, $ Antifungals, Beta $ 3, 619 Musculoskeletal 3, 476 Bisphonate, $ 3, 405 Antihyperlipidemic Agents, $ 2, 812 Urinary Tract Antispasmodic, $ 2, 723 Movement Disorders, 2, 311 Topical $steroids Sedatives, $ 8, 254 33 Corticoids, $ 2, 092 Diuretics, $ 1, 725 Vitamin D Non-Narcotic Dermatologics, $ Bone Density Constipation, $Patches, 613$ Analgesic $ Smoking cessation, Vitamin D Vitamins, Antihistamines Diarrhea, Hair Related $ 51 -1, 573 Regulators, $ 864 1, 506 529 Platelet Inhibitors, $ Alopecia, 492 Nasal, $$ 201 446 8, 597 Consumer Healthcare
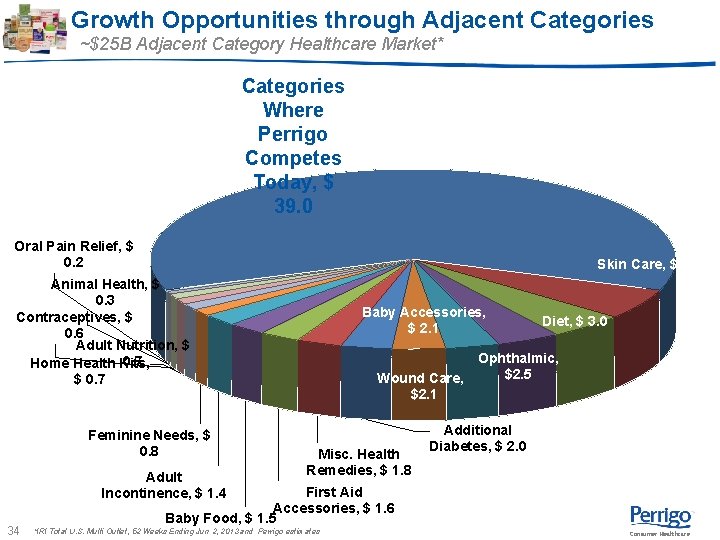
Growth Opportunities through Adjacent Categories ~$25 B Adjacent Category Healthcare Market* Categories Where Perrigo Competes Today, $ 39. 0 Oral Pain Relief, $ 0. 2 Skin Care, $ 3. 5 Animal Health, $ 0. 3 Contraceptives, $ 0. 6 Adult Nutrition, $ 0. 7 Home Health Kits, $ 0. 7 Feminine Needs, $ 0. 8 Adult Incontinence, $ 1. 4 34 Baby Accessories, $ 2. 1 Wound Care, $2. 1 Misc. Health Remedies, $ 1. 8 Diet, $ 3. 0 Ophthalmic, $2. 5 Additional Diabetes, $ 2. 0 First Aid Accessories, $ 1. 6 Baby Food, $ 1. 5 *IRI Total U. S. Multi Outlet, 52 Weeks Ending Jun 2, 2013 and Perrigo estimates Consumer Healthcare
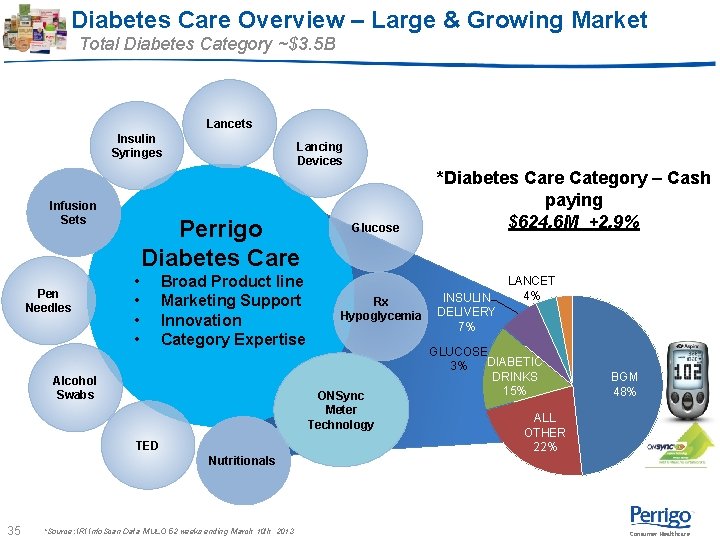
Diabetes Care Overview – Large & Growing Market Total Diabetes Category ~$3. 5 B Lancets Insulin Syringes Infusion Sets Pen Needles Lancing Devices Perrigo Diabetes Care • • Broad Product line Marketing Support Innovation Category Expertise Alcohol Swabs Glucose Rx Hypoglycemia ONSync Meter Technology TED *Diabetes Care Category – Cash paying $624. 6 M +2. 9% INSULIN DELIVERY 7% LANCET 4% GLUCOSE DIABETIC 3% DRINKS 15% BGM 48% ALL OTHER 22% Nutritionals 35 *Source: IRI Info. Scan Data MULO 52 weeks ending March 10 th 2013 Consumer Healthcare
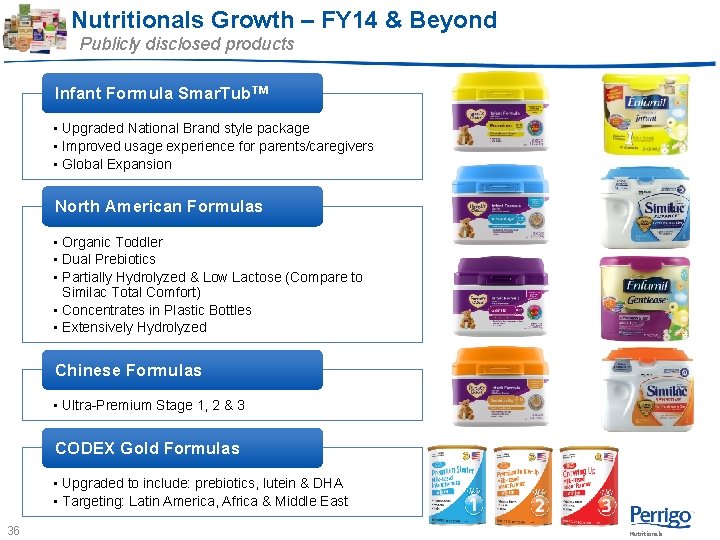
Nutritionals Growth – FY 14 & Beyond Publicly disclosed products Infant Formula Smar. Tub. TM • Upgraded National Brand style package • Improved usage experience for parents/caregivers • Global Expansion North American Formulas • Organic Toddler • Dual Prebiotics • Partially Hydrolyzed & Low Lactose (Compare to Similac Total Comfort) • Concentrates in Plastic Bottles • Extensively Hydrolyzed Chinese Formulas • Ultra-Premium Stage 1, 2 & 3 CODEX Gold Formulas • Upgraded to include: prebiotics, lutein & DHA • Targeting: Latin America, Africa & Middle East 36 Nutritionals
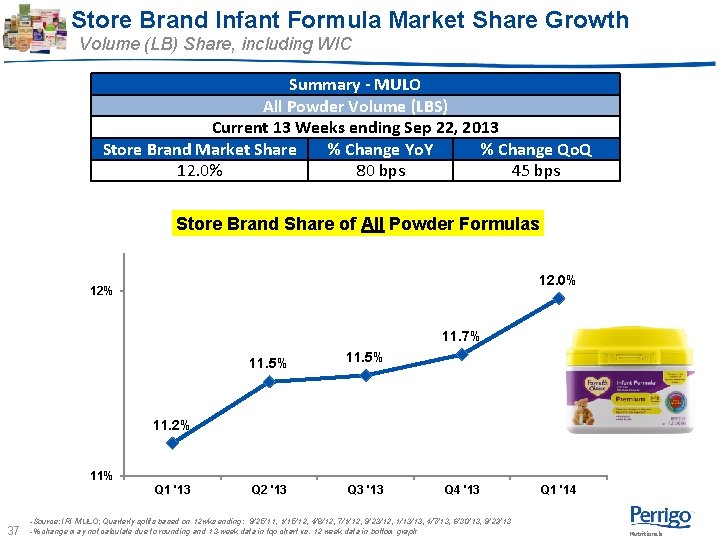
Store Brand Infant Formula Market Share Growth Volume (LB) Share, including WIC Summary - MULO All Powder Volume (LBS) Current 13 Weeks ending Sep 22, 2013 Store Brand Market Share % Change Yo. Y % Change Qo. Q 12. 0% 80 bps 45 bps Store Brand Share of All Powder Formulas 12. 0% 12% 11. 7% 11. 5% 11. 2% 11% Q 1 '13 37 Q 2 '13 Q 3 '13 Q 4 '13 -Source: IRI MULO; Quarterly splits based on 12 wks ending: 9/25/11, 1/15/12, 4/8/12, 7/1/12, 9/23/12, 1/13/13, 4/7/13, 6/30/13, 9/22/13 -% change may not calculate due to rounding and 13 -week data in top chart vs. 12 week data in bottom graph Q 1 '14 Nutritionals
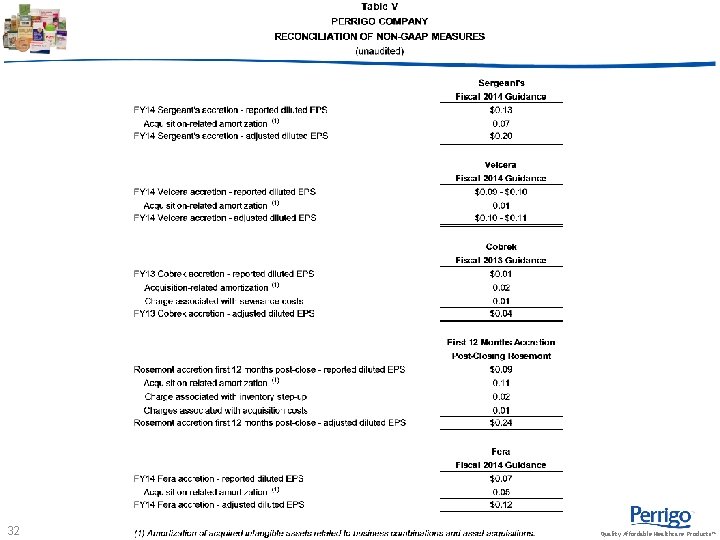
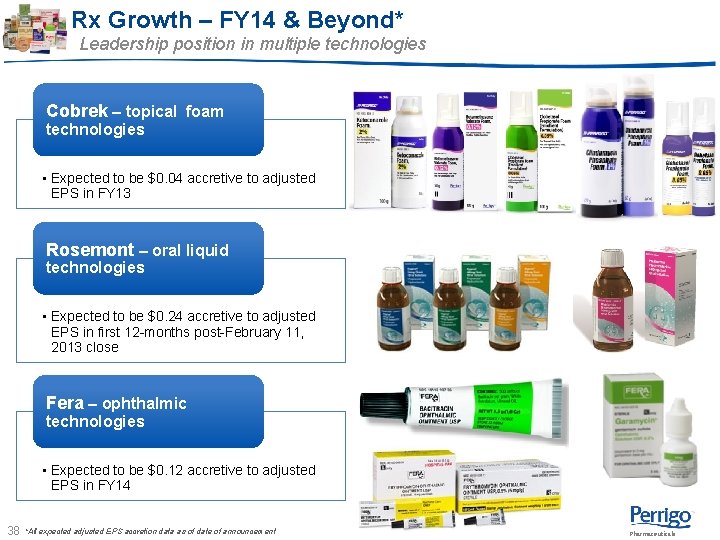
Rx Growth – FY 14 & Beyond* Leadership position in multiple technologies Cobrek – topical foam technologies • Expected to be $0. 04 accretive to adjusted EPS in FY 13 Rosemont – oral liquid technologies • Expected to be $0. 24 accretive to adjusted EPS in first 12 -months post-February 11, 2013 close Fera – ophthalmic technologies • Expected to be $0. 12 accretive to adjusted EPS in FY 14 38 *All expected adjusted EPS accretion data as of date of announcement Pharmaceuticals
Table VI PERRIGO COMPANY PERRIGO’S S-4 PROJECTIONS ELAN (1) Non-GAAP measure. For this purpose, Operating Profit represents net income before interest, tax and amortization. (2) Non-GAAP measure. For this purpose, Non-GAAP Net Income represents GAAP net income adjusted for the after-tax effects of amortization. (3) Non-GAAP measure. For this purpose, Non-GAAP Net Income per Share represents GAAP net income adjusted for the after-tax effects of amortization, divided by the number of outstanding shares of Perrigo and Elan, respectively, on a fully diluted basis. 39 (4) Non-GAAP measure. For this purpose, free cash flow represents Adjusted EBITDA less cash taxes, capital expenditures and less the amount of any increase or plus the amount of any decrease in net working capital. Quality Affordable Healthcare Products™