California Water Projections More Extreme Julie Kalansky David






- Slides: 16
California Water Projections: More Extreme Julie Kalansky, David Pierce, Dan Cayan, Laurel Dehaan, Alexander Gershunov, Mike Dettinger* Scripps Institution of Oceanography, *USGS August 28, 2018 CA Adaptation Forum Shasta Dam, 2015 O. Alexandrov
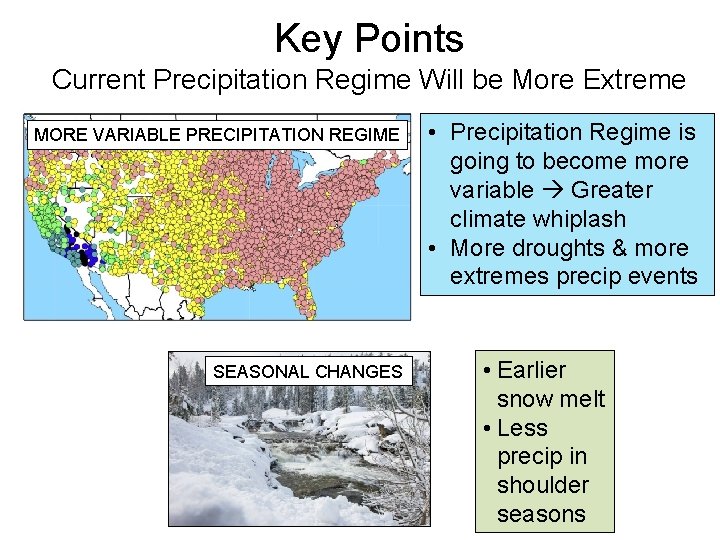
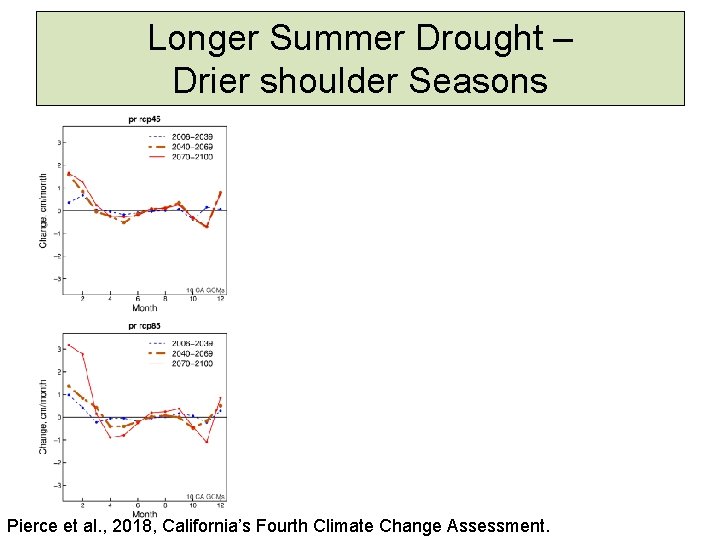
Key Points Current Precipitation Regime Will be More Extreme MORE VARIABLE PRECIPITATION REGIME SEASONAL CHANGES • Precipitation Regime is going to become more variable Greater climate whiplash • More droughts & more extremes precip events • Earlier snow melt • Less precip in shoulder seasons
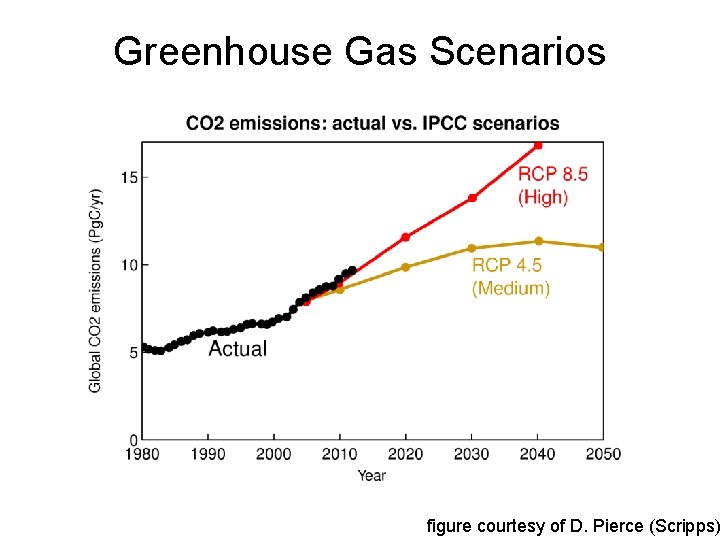
Greenhouse Gas Scenarios figure courtesy of D. Pierce (Scripps)
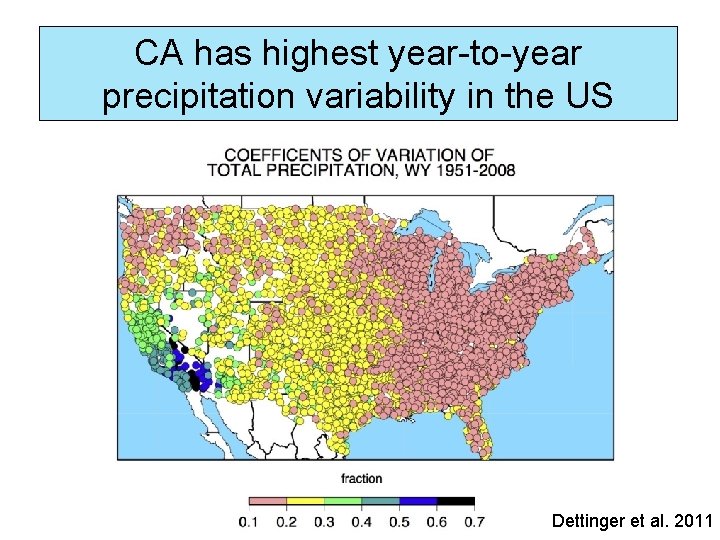
CA has highest year-to-year precipitation variability in the US Dettinger et al. 2011
Extreme Precipitation Events Explain Year-to-Year Variability 85% of the year-to-year variability is explained by 95 th percentile storms Dettinger and Cayan, 2014
Atmospheric Rivers (ARs) drive most extremes in CA Precipitable Water; March 20, 2018 UW-CIMSS
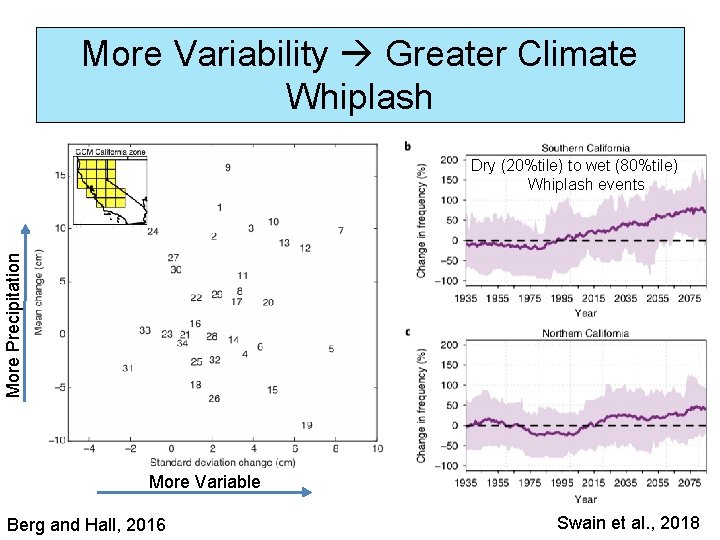
More Precipitation More Variability Greater Climate Whiplash More Variable Berg and Hall 2016
More Variability Greater Climate Whiplash More Precipitation Dry (20%tile) to wet (80%tile) Whiplash events More Variable Berg and Hall, 2016 Swain et al. , 2018
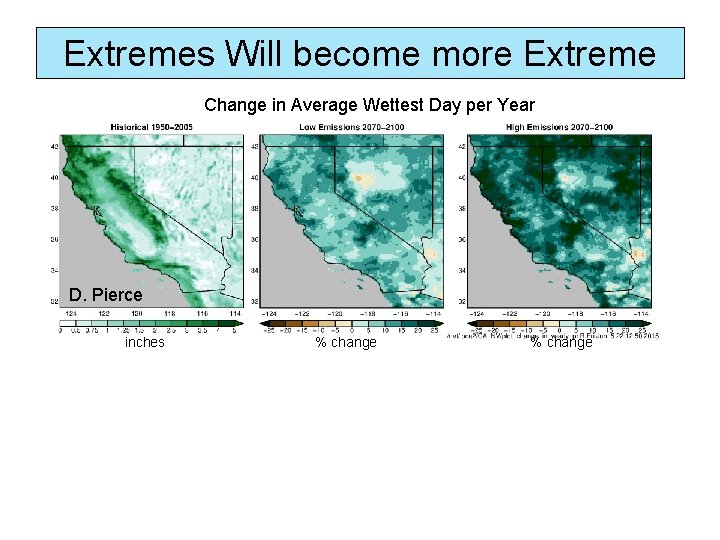
Extremes Will become more Extreme Change in Average Wettest Day per Year D. Pierce inches % change
Extremes Will become more Extreme Change in Average Wettest Day per Year D. Pierce inches Ø The changes in the most extreme precipitation is due to increase atmospheric river intensity. Russian River basin % change in precipitation frequency by intensity bin % change Figure courtesy of A. Gershunov and T. Shulgina
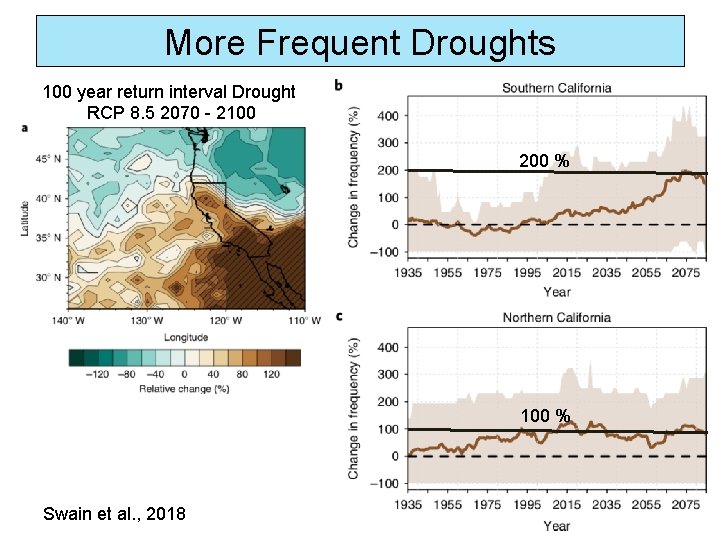
More Frequent Droughts 100 year return interval Drought RCP 8. 5 2070 - 2100 200 % 100 % Swain et al. , 2018
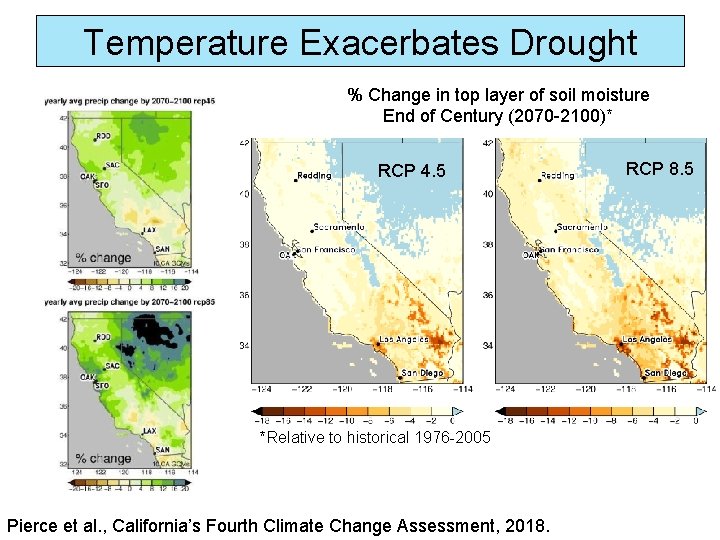
Temperature Exacerbates Drought % Change in top layer of soil moisture End of Century (2070 -2100)* RCP 4. 5 *Relative to historical 1976 -2005 Pierce et al. , California’s Fourth Climate Change Assessment, 2018. RCP 8. 5
Temperature Exacerbates Drought % Change in top layer of soil moisture End of Century (2070 -2100)* Temperature Impacts • Reduced Stream Flows RCP 4. 5 • Warmer water temperatures • Reduced Run-off • Reduced Recharge • Less snow, more rain (snow-drought) *Relative to historical 1976 -2005 Pierce et al. , 2018, California’s Fourth Climate Change Assessment. RCP 8. 5
Longer Summer Drought – Drier shoulder Seasons Pierce et al. , 2018, California’s Fourth Climate Change Assessment.
Longer Summer Drought – Less Snow & Earlier Melt D. Pierce et al. , 2018, California’s Fourth Climate Change Assessment.
Key Points Current Precipitation Regime Will be More Extreme MORE VARIABLE PRECIPITATION REGIME SEASONAL CHANGES Questions? jkalansky@ucsd. edu • Precipitation Regime is going to become more variable Greater climate whiplash • More droughts & more extremes precip events • Earlier snow melt • Less precip in shoulder seasons