Assessment in Transition SOLO Taxonomy Rosemary Feasey Primary

- Slides: 19
Assessment in Transition: SOLO Taxonomy Rosemary Feasey Primary Science Consultant E: rosemary. feasey@goolemail. com 19/05/2021 David Bailey Regional Network Lead STEM Learning e: d. bailey@stem. org. uk t: @Class_Leading TES: classleading © Class Leading 2014 Used with permission 1
Something to think about… • Watch the following video clip https: //www. youtube. com/watch? v=Vr. SUe_m 19 FY • Consider what it might represent in the classroom. 19/05/2021 © Class Leading 2014 Used with permission
Meta-analysis • In a educational study the results are analysed; • In a meta-analysis, the analyses from several studies are combined to consider the average over a large number of subjects in the sample; • Although there are issues with meta-analysis as a technique, the larger sample is often considered more reliable; • To carry out a meta-analysis, it is important that each individual study can be compared on a likefor like basis. 19/05/2021 © Class Leading 2014 Used with permission 3
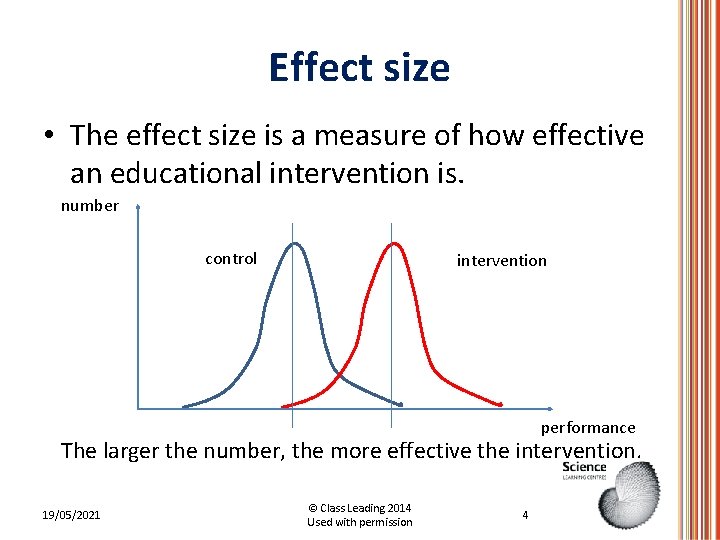
Effect size • The effect size is a measure of how effective an educational intervention is. number control intervention performance The larger the number, the more effective the intervention. 19/05/2021 © Class Leading 2014 Used with permission 4
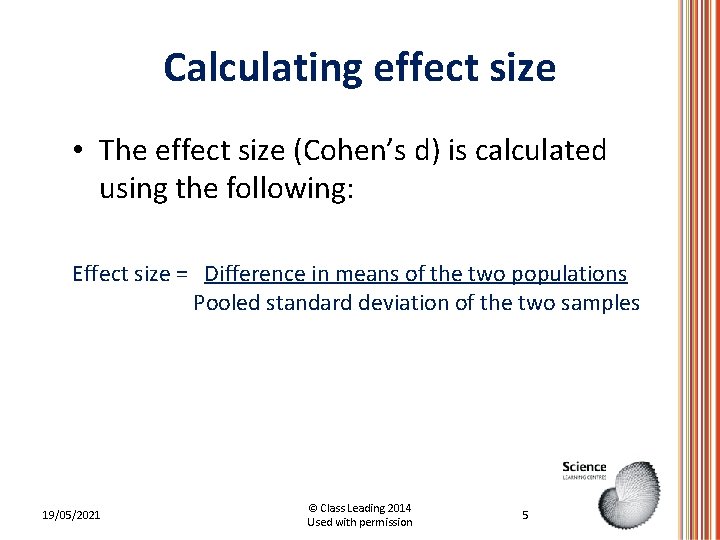
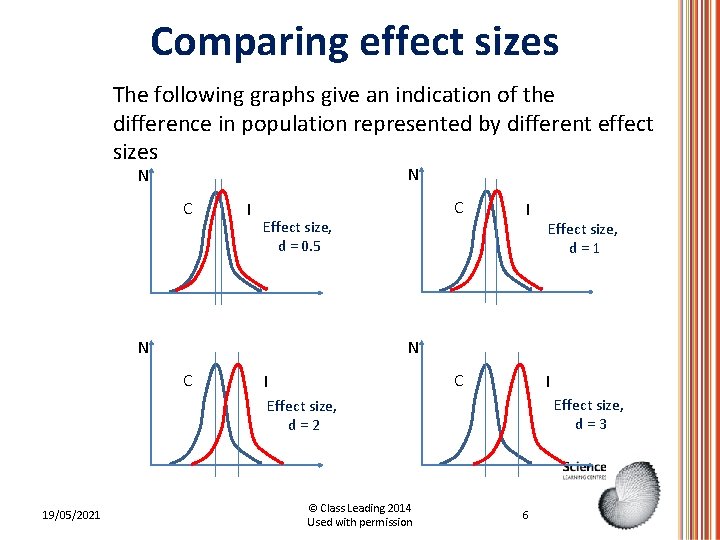
Calculating effect size • The effect size (Cohen’s d) is calculated using the following: Effect size = Difference in means of the two populations Pooled standard deviation of the two samples 19/05/2021 © Class Leading 2014 Used with permission 5
Comparing effect sizes The following graphs give an indication of the difference in population represented by different effect sizes N N C I C Effect size, d = 0. 5 N I N C C I I Effect size, d=3 Effect size, d=2 19/05/2021 Effect size, d=1 © Class Leading 2014 Used with permission 6
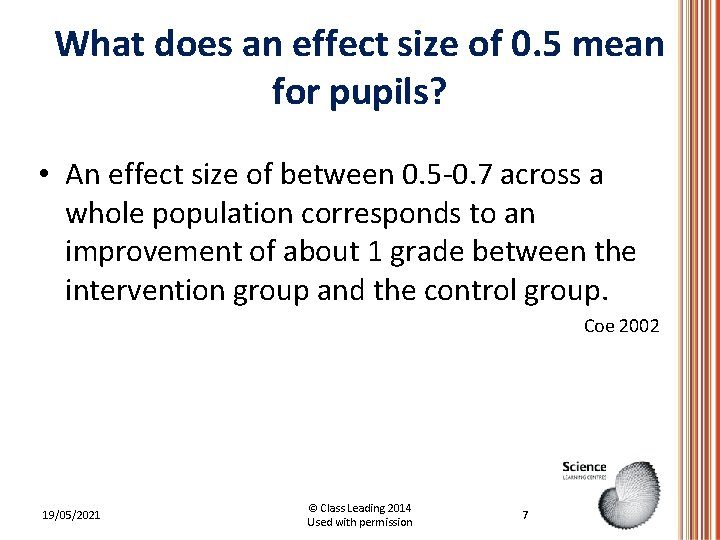
What does an effect size of 0. 5 mean for pupils? • An effect size of between 0. 5 -0. 7 across a whole population corresponds to an improvement of about 1 grade between the intervention group and the control group. Coe 2002 19/05/2021 © Class Leading 2014 Used with permission 7
What do you know about SOLO Taxonomy? • Using your SOLO taxonomy placemat, lay a marker (such as a pen) on the placemat in a position that shows what you already know about SOLO taxonomy. 19/05/2021 © Class Leading 2014 Used with permission
SOLO Taxonomy • SOLO stands for: Structure of Observed Learning Outcomes; • It was developed by Australian researchers Biggs and Collis around 30 years ago; • It is used extensively in New Zealand (which is one of the most successful education systems in the world). © Class Leading 2014 Used with permission
In summary • Watch this final video clip about SOLO taxonomy, explained using LEGO. https: //www. youtube. com/watch? v=u. DXXV-m. CLPg 19/05/2021 © Class Leading 2014 Used with permission
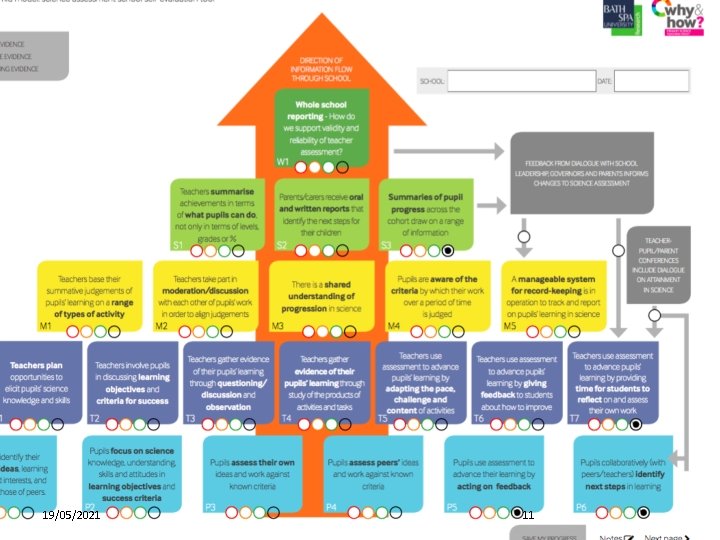
19/05/2021 11
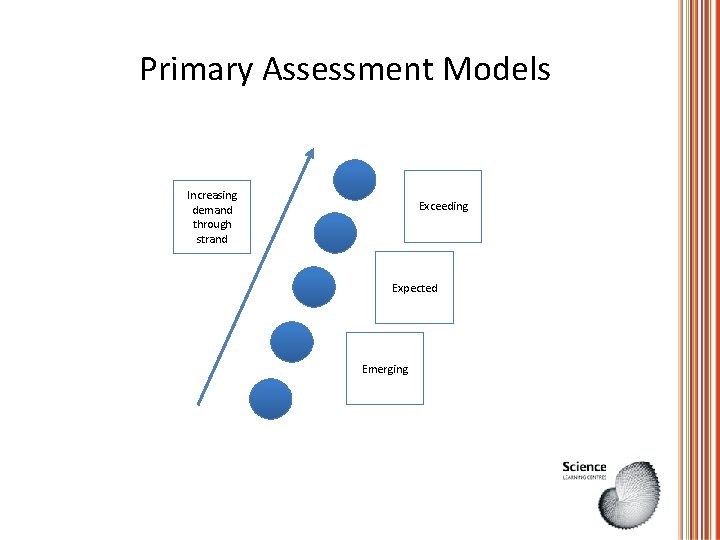
Primary Assessment Models Increasing demand through strand Exceeding Expected Emerging
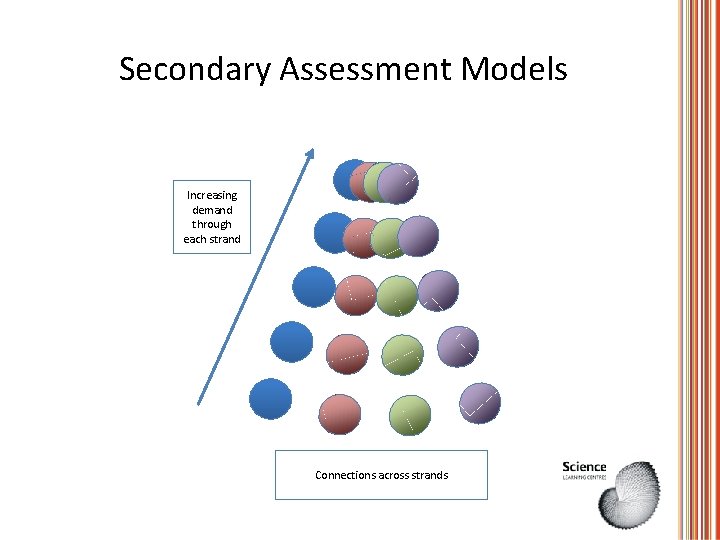
Secondary Assessment Models Increasing demand through each strand Connections across strands
What impact do pre and post unit 'Solo Taxonomy Hexagon Assessments' have on children's learning?
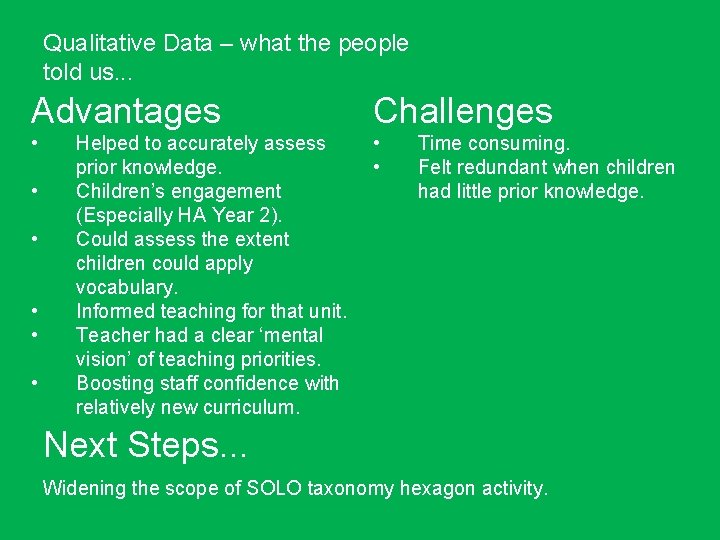
Qualitative Data – what the people told us. . . Advantages Challenges • • Helped to accurately assess prior knowledge. Children’s engagement (Especially HA Year 2). Could assess the extent children could apply vocabulary. Informed teaching for that unit. Teacher had a clear ‘mental vision’ of teaching priorities. Boosting staff confidence with relatively new curriculum. Time consuming. Felt redundant when children had little prior knowledge. Next Steps. . . Widening the scope of SOLO taxonomy hexagon activity.
Any questions?
SOLO Hexagons (II) • Watch the following video clip to show hexagons can be used in the classroom - https: //www. youtube. com/watch? v=Ixmmr-nnc. F 4; • After watching the video, think of aspects of this that you thought were useful; • Were there any parts of this that might have been done differently? © Class Leading 2014 Used with permission
What do children make of SOLO? • Watch the following video clip https: //www. youtube. com/watch? v=0 r. Dazx. Cj 7 F 0 • Reflect on the understanding that these primary children have about their own learning. 19/05/2021 © Class Leading 2014 Used with permission
Action Research… • The next phase of development will include extending the approach. • This will allow for better evidence to be generated. • We will use the EEF DIY Self-evaluation guide to support us through this process. 19/05/2021 © Class Leading 2014 Used with permission 19