All organisms vary from one another even within
- Slides: 15
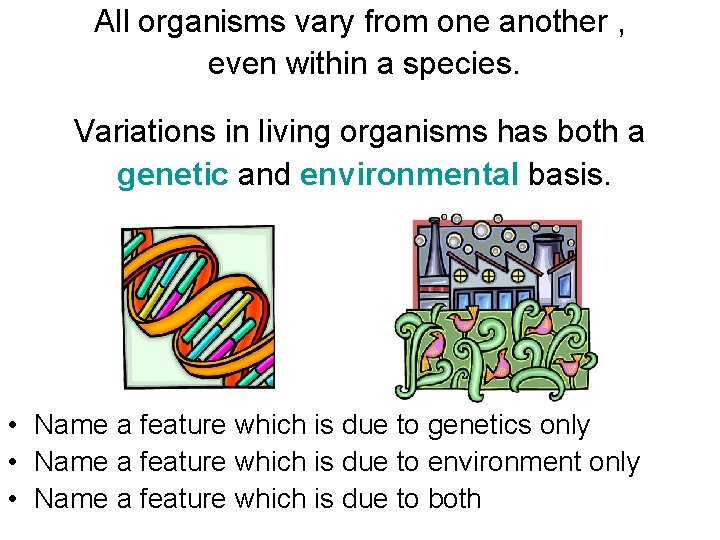
All organisms vary from one another , even within a species. Variations in living organisms has both a genetic and environmental basis. • Name a feature which is due to genetics only • Name a feature which is due to environment only • Name a feature which is due to both
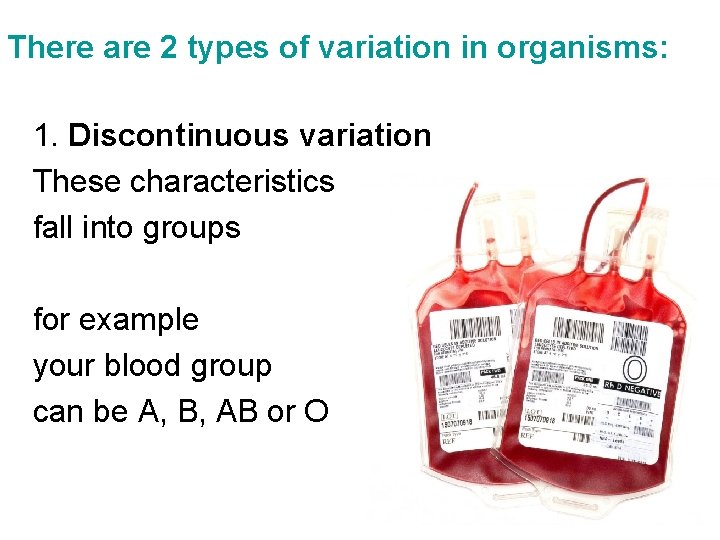
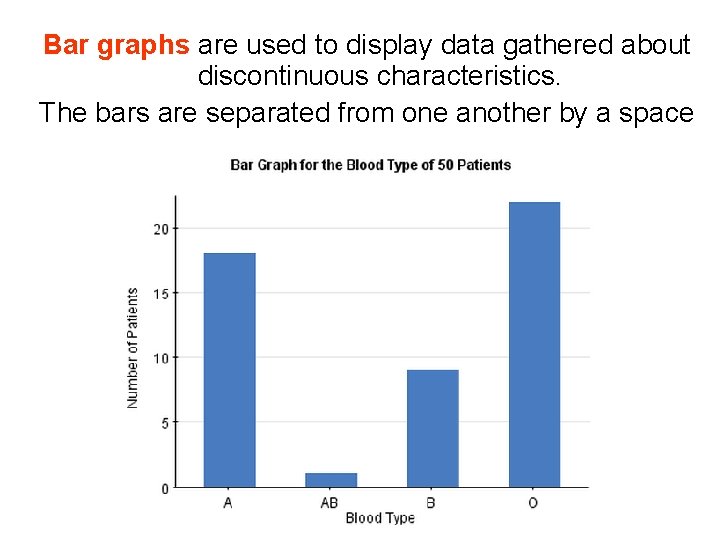
There are 2 types of variation in organisms: 1. Discontinuous variation These characteristics fall into groups for example your blood group can be A, B, AB or O
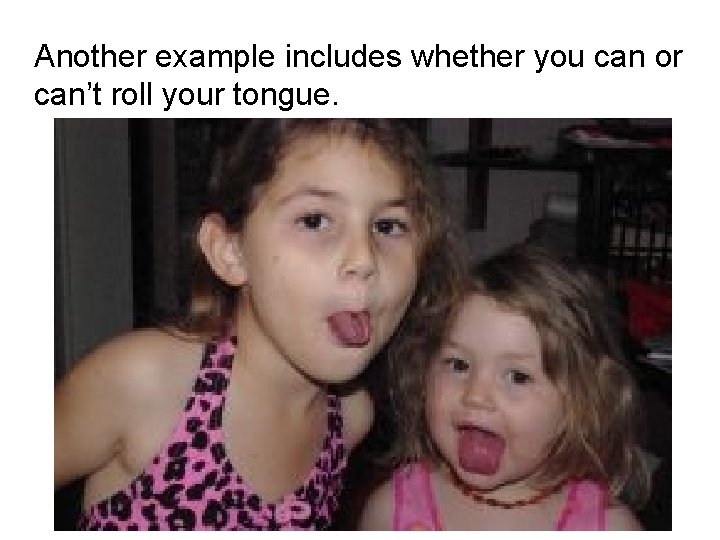
Another example includes whether you can or can’t roll your tongue.
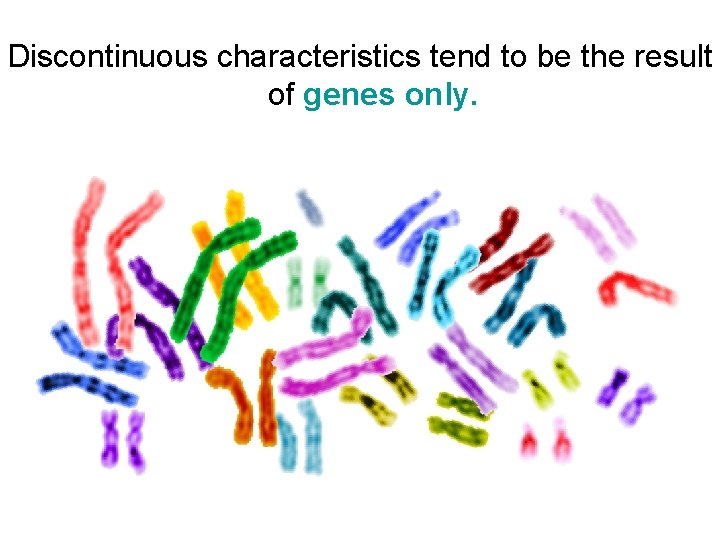
Discontinuous characteristics tend to be the result of genes only.
Bar graphs are used to display data gathered about discontinuous characteristics. The bars are separated from one another by a space
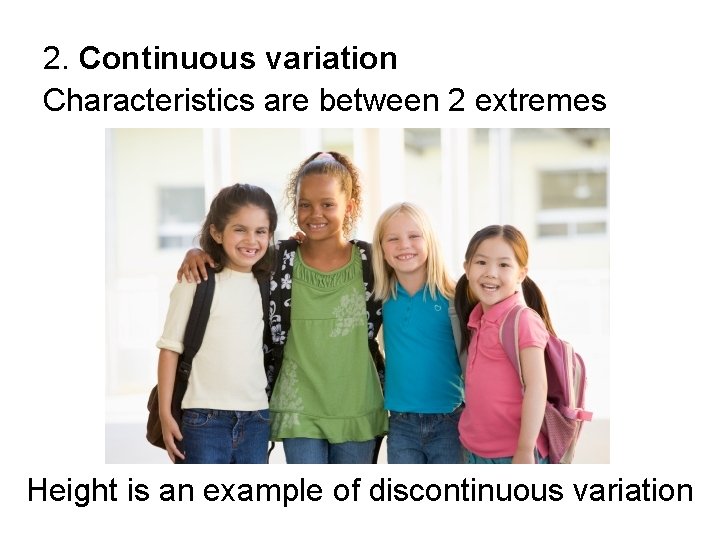
2. Continuous variation Characteristics are between 2 extremes Height is an example of discontinuous variation
Continuous characteristics tend to be the result of both genes and the environment. Factors such as the availability of food, water, and disease will affect the eventual height a person is able to grow to.
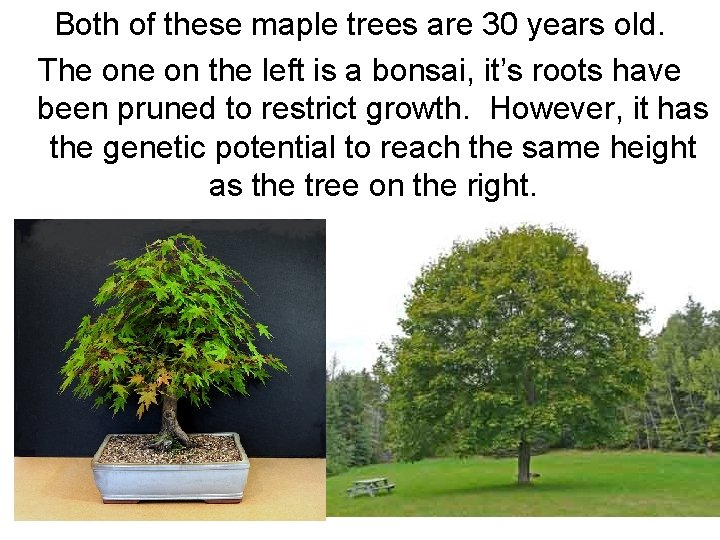
Both of these maple trees are 30 years old. The on the left is a bonsai, it’s roots have been pruned to restrict growth. However, it has the genetic potential to reach the same height as the tree on the right.
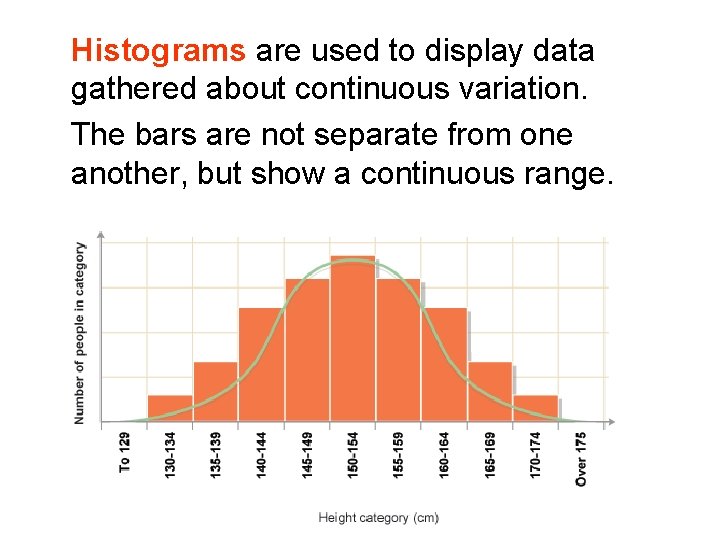
Histograms are used to display data gathered about continuous variation. The bars are not separate from one another, but show a continuous range.
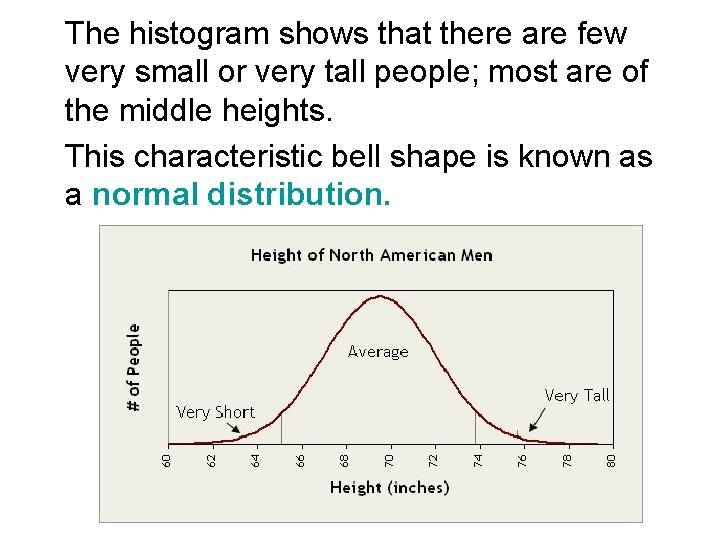
The histogram shows that there are few very small or very tall people; most are of the middle heights. This characteristic bell shape is known as a normal distribution.
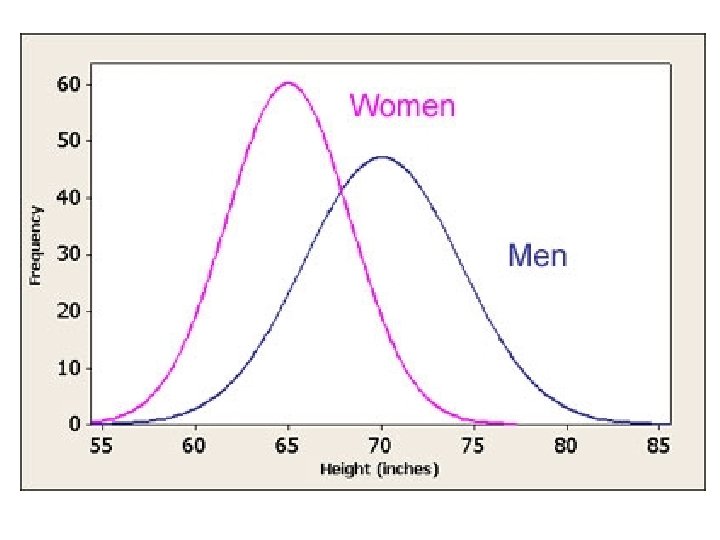
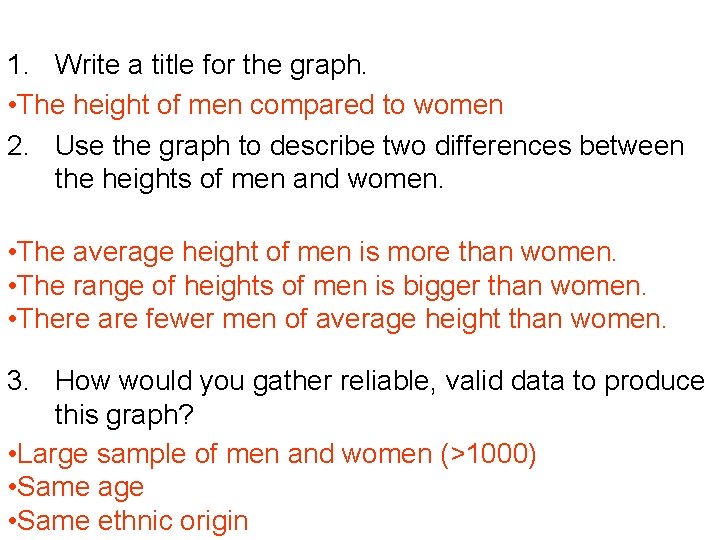
1. Write a title for the graph. • The height of men compared to women 2. Use the graph to describe two differences between the heights of men and women. • The average height of men is more than women. • The range of heights of men is bigger than women. • There are fewer men of average height than women. 3. How would you gather reliable, valid data to produce this graph? • Large sample of men and women (>1000) • Same age • Same ethnic origin
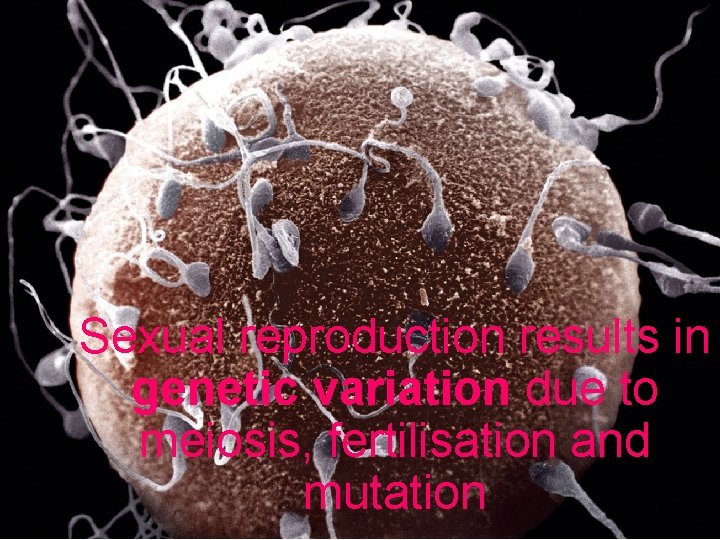
Sexual reproduction results in genetic variation due to meiosis, fertilisation and mutation
Variation and selection may lead to evolution or extinction. Organisms that can adapt to a changing environment evolve, those that don’t become extinct.