Activity 2 Activity 1 Index Section 1 Rolling

- Slides: 15
Activity 2 Activity 1 Index Section 1: Rolling a die Section 2: Master table 00: 05
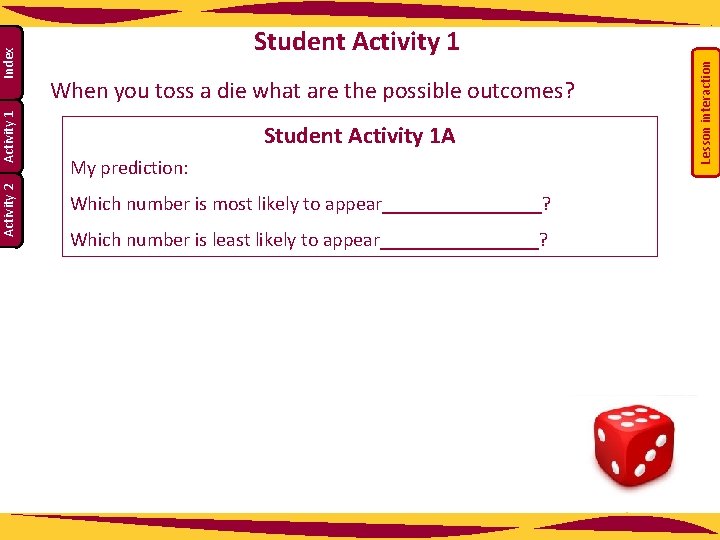
When you toss a die what are the possible outcomes? Student Activity 1 A My prediction: Which number is most likely to appear________? Which number is least likely to appear________? Lesson interaction Index Activity 1 Activity 2 Student Activity 1
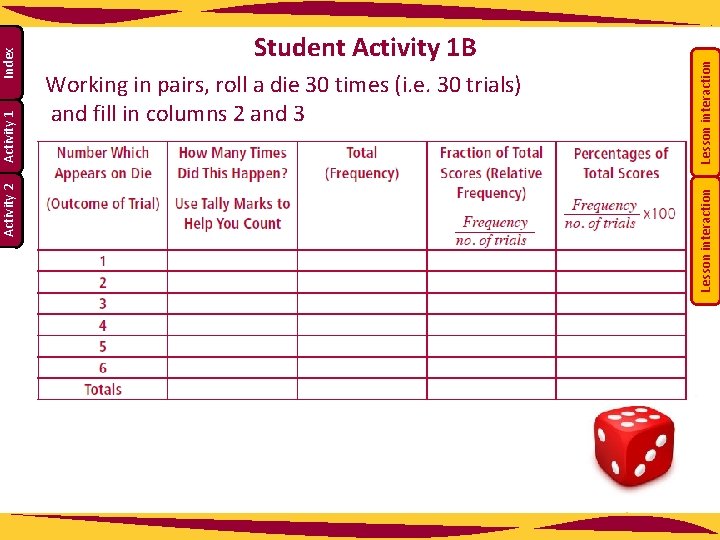
Lesson interaction Working in pairs, roll a die 30 times (i. e. 30 trials) and fill in columns 2 and 3 Lesson interaction Index Activity 1 Activity 2 Student Activity 1 B
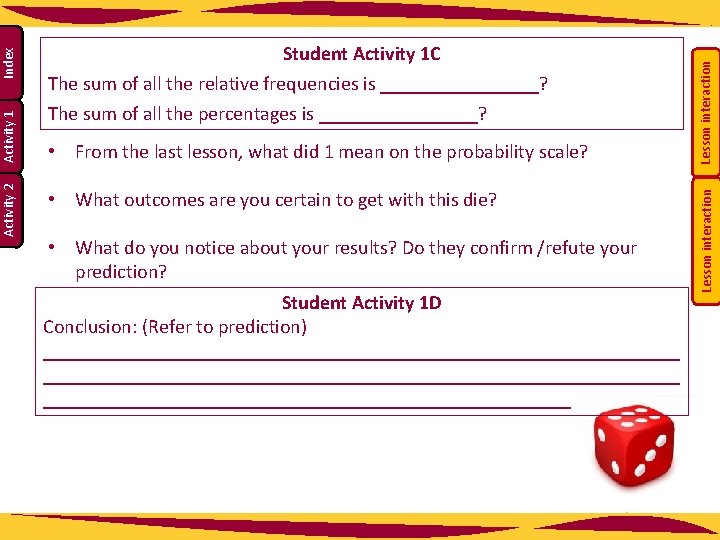
• From the last lesson, what did 1 mean on the probability scale? • What outcomes are you certain to get with this die? • What do you notice about your results? Do they confirm /refute your prediction? Student Activity 1 D Conclusion: (Refer to prediction) ________________________________________________________________ Lesson interaction The sum of all the relative frequencies is ________? The sum of all the percentages is ________? Lesson interaction Index Activity 1 Activity 2 Student Activity 1 C
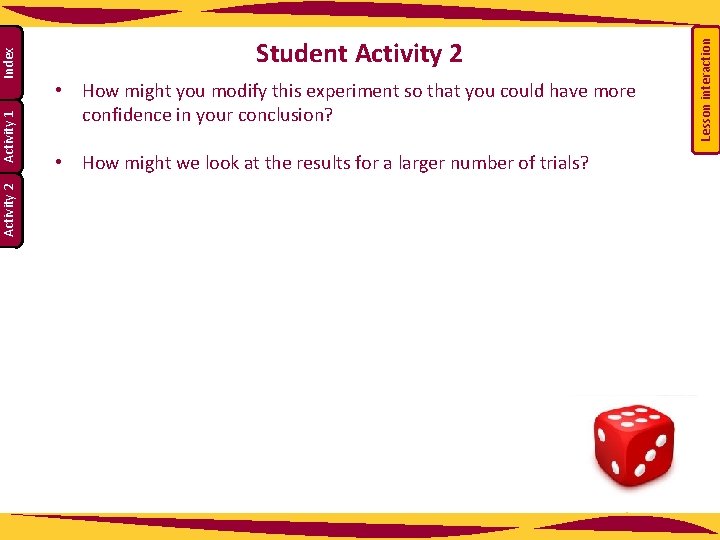
• How might you modify this experiment so that you could have more confidence in your conclusion? • How might we look at the results for a larger number of trials? Lesson interaction Index Activity 1 Activity 2 Student Activity 2
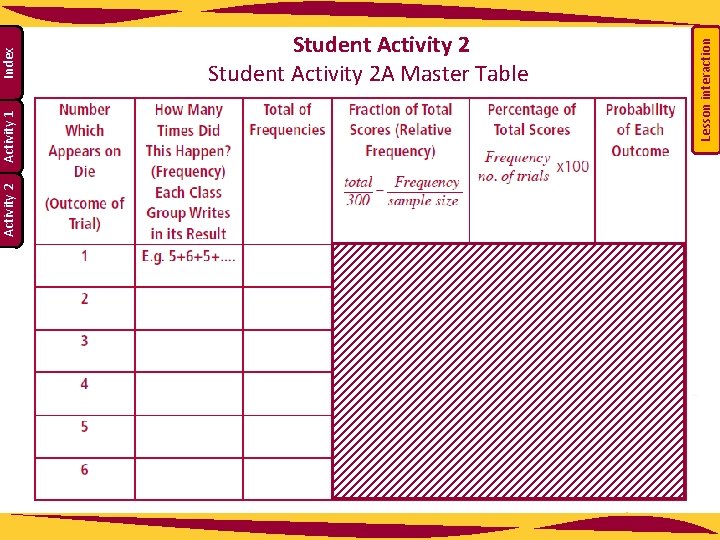
Lesson interaction Index Activity 1 Activity 2 Student Activity 2 A Master Table
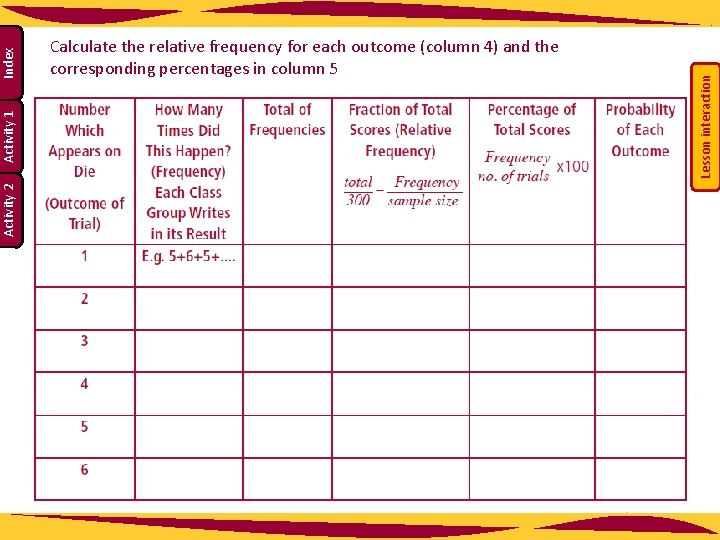
Calculate the relative frequency for each outcome (column 4) and the corresponding percentages in column 5 Lesson interaction Index Activity 1 Activity 2 Did every group get the same number of 1’s or 2’s etc. for 30 trials? Is there a trend appearing?
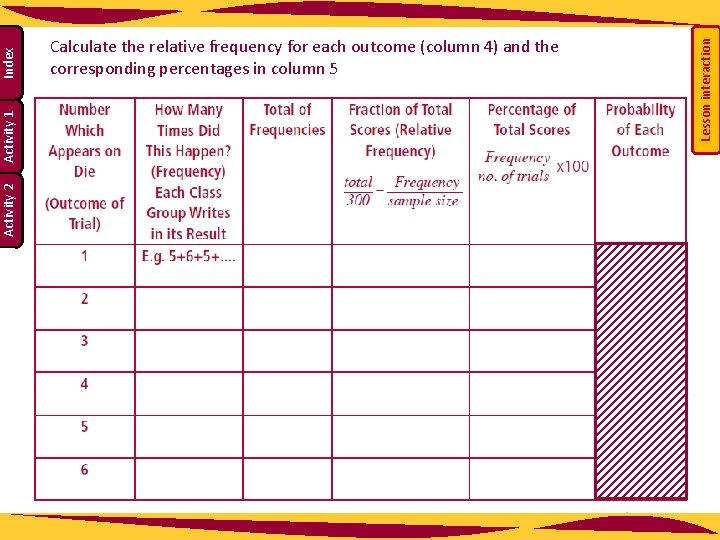
Lesson interaction Index Activity 1 Activity 2 Calculate the relative frequency for each outcome (column 4) and the corresponding percentages in column 5
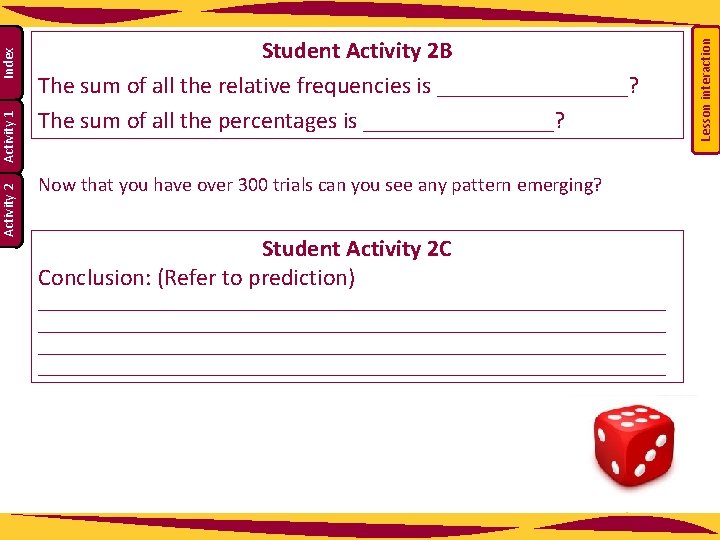
Now that you have over 300 trials can you see any pattern emerging? Student Activity 2 C Conclusion: (Refer to prediction) ______________________________________________________________________ Lesson interaction Index Activity 1 Activity 2 Student Activity 2 B The sum of all the relative frequencies is ________? The sum of all the percentages is ________?
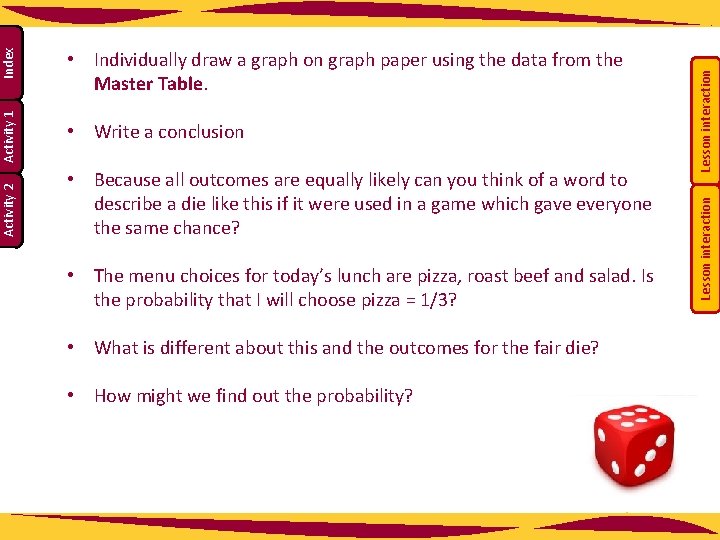
• Because all outcomes are equally likely can you think of a word to describe a die like this if it were used in a game which gave everyone the same chance? • The menu choices for today’s lunch are pizza, roast beef and salad. Is the probability that I will choose pizza = 1/3? • What is different about this and the outcomes for the fair die? • How might we find out the probability? Lesson interaction • Write a conclusion Lesson interaction Index Activity 1 Activity 2 • Individually draw a graph on graph paper using the data from the Master Table.
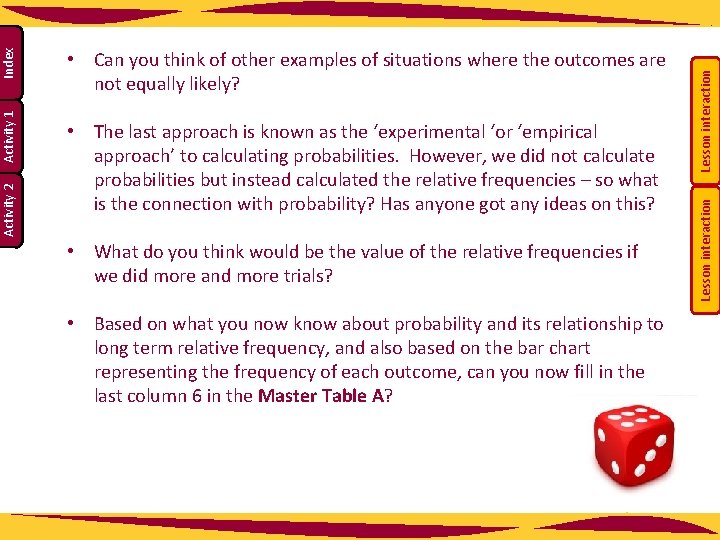
• What do you think would be the value of the relative frequencies if we did more and more trials? • Based on what you now know about probability and its relationship to long term relative frequency, and also based on the bar chart representing the frequency of each outcome, can you now fill in the last column 6 in the Master Table A? Lesson interaction • The last approach is known as the ‘experimental ‘or ‘empirical approach’ to calculating probabilities. However, we did not calculate probabilities but instead calculated the relative frequencies – so what is the connection with probability? Has anyone got any ideas on this? Lesson interaction Index Activity 1 Activity 2 • Can you think of other examples of situations where the outcomes are not equally likely?
Lesson interaction Index Activity 1 Activity 2 Calculate the relative frequency for each outcome (column 4) and the corresponding percentages in column 5
• Write down 3 items you learned about probability today. • Write down anything you found difficult. • Write down any question you may have. Lesson interaction Index Activity 1 Activity 2 Reflection