Accel Precalc Unit 6 Graphs and Inverses of


")


- Slides: 16
Accel Precalc Unit #6: Graphs and Inverses of Trig Functions Lesson 9: Modeling Real World Data & Simple Harmonic Motion EQ 1: How can you create trig models to represent real world data?
Modeling Data Using Trig Functions:
Objective: Create a model in the form Define the variables in the model: A = amplitude B= new period t = time h = phase shift k = vertical shift
The table below lists the normal average high temperatures for Charlotte, NC. Month Temp °F January 1 51. 3 July 7 90. 1 February 2 55. 9 August 8 88. 4 March 3 64. 1 September 9 82. 3 April 4 72. 8 October 10 72. 6 May 5 79. 7 November 11 62. 8 June 6 86 December 12 54 Use your graphing calculator to create a scatterplot of the data. What VIEWING WINDOW could you use? WHY? ?
Unlike the Sinusoids, the horizontal axis of symmetry IS NOT the x-axis!! 2. a) What is the period of the function? _____ 12 months b) Find B (in radians). ____ 3. a) What are the minimum and maximum temperatures? 90. 1 51. 3 Min = _______ Max = _______ 19. 4 b) Use these values to find the amplitude. A = _______ c) How can you use the amplitude and the max or min to find the horizontal axis of symmetry? 70. 7 k = _______
4. Place the value for k in Y 1 and graph the horizontal axis of symmetry through your data set. Trace along this line to estimate the closest zero. This value represents the horizontal shift. What is an estimated value for h for this periodic function? h = ______
5. Put your values for A, B, h, and k into the model equation. Graph this with your data by placing your model equation in Y 2. How well does it seem to fit? Model for Normal High Temperature in Charlotte, NC: y = ____________
Practice Problems: Modeling Data Work on Inverse Trig Worksheets
Day 61 Agenda: • DG 25 --- 25 minutes • Complete Lesson U 6 L 9
Part II: Simple Harmonic Motion
Simple Harmonic Motion Models: RECALL: Equilibrium --- object is at rest; zero point |A| = amplitude Maximum displacement from point of equilibrium
Ex. 1 A buoy marking a channel in the harbor bobs up and down as the waves move past. Suppose the buoy moves a total of 6 feet from its high point to its low point and returns to its high point every 10 seconds. Assuming that at t = 0 the buoy is at its high point and the middle height of the buoy’s path is d = 0, write an equation to describe its motion. Should the equation be in terms of sine or cosine? Buoy starts here. A=3 Cosine 10 NP = _____ To find c, we must use a given point (t, cos(t)) and solve. Use (0, 3). WHY?
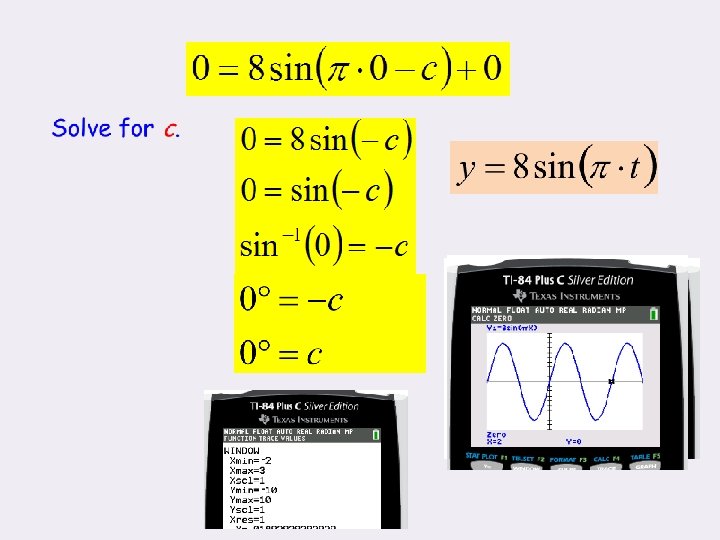
Solve for c.
Ex. 2 A weight on a spring bounces a maximum of 8 inches above and below its equilibrium (zero) point. The time for one complete cycle is 2 seconds. Write an equation to describe the motion of this weight, assume the weight is at equilibrium when t = 0. Sine 2 NP = _____ t=0 8 8 To find we must use a given Initial c, point (t, sin(t)) and solve. Use (0, 0). WHY?
Assignment: MODELING DATA & HARMONIC MOTION: Practice Problems: Modeling Data Worksheet: Harmonic Motion