9 L 2 Maths Week of 2906 Monday


 Make notes")


 Research something called the product moment correlation coefficient. This gives a")


- Slides: 17
9 L 2 Maths Week of 29/06
Monday 29/06 Scatter Diagrams Continued To be able to draw and use lines of best fit
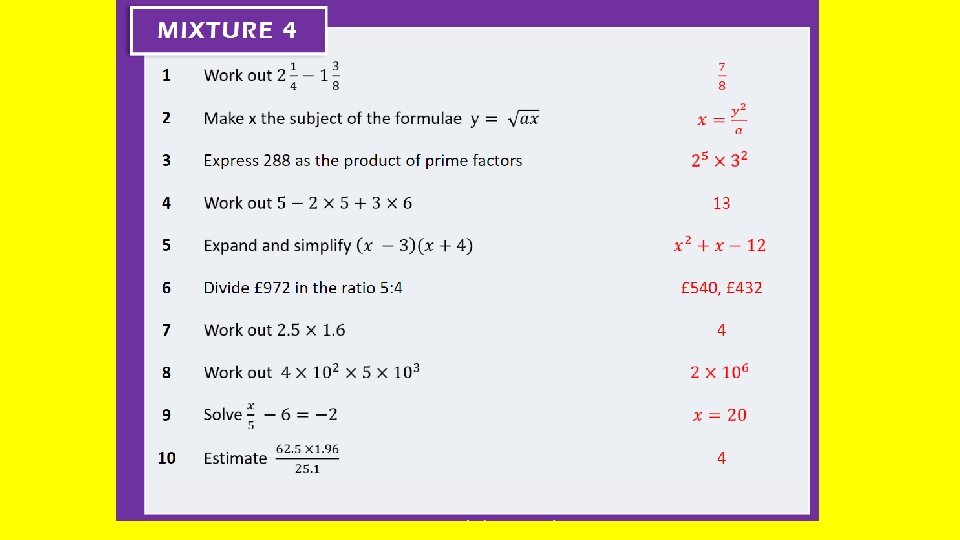
Quick 10 – no calculator Answers on next slide
Go to the link below and have a play around with the scatter diagram tool. You can see how things like wealth of different countries or population have changed over the last 100 years or choose your own data to look at. Email me any facts you found interesting or send me a screenshot. https: //www. gapminder. org/tools/#$chart-type=bubbles
Watch the video below. (you watched the first 2 minutes last lesson) Make notes on anything you didn’t already know. https: //corbettmaths. com/2012/08/10/scatter-graphs/ Continued on next slide
Complete these questions. There are templates you can use to avoid copying out the entire graph again at https: //corbettmaths. com/wp-content/uploads/2019/01/Scatter-Graphs-1. pdf
Complete these questions
Complete these questions
Extension Task (optional) Research something called the product moment correlation coefficient. This gives a correlation a number so you can compare the strength of a correlation more easily. Email me what you find out!
Answers Go to the link below and find the questions you did. https: //corbettmaths. com/wpcontent/uploads/2019/01/Scatter-Graphs-Answers. pdf
Friday 03/07 and Monday 06/07 Scatter Diagram Investigation Part 1 and 2 To find some of your own data and put it into a scatter diagram.
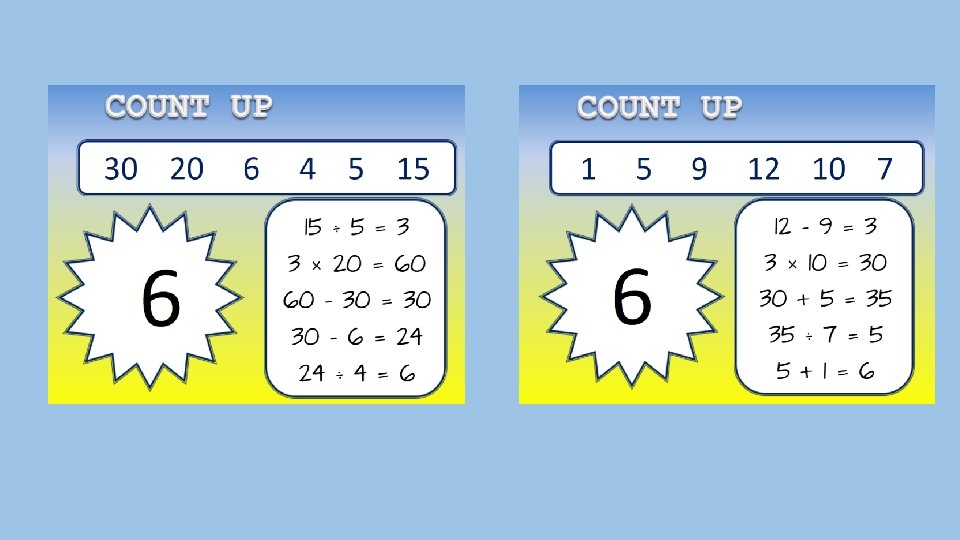
Use all the numbers and a mixture of plus, subtract, divide, multiply to make the number 6. A possible answer is on the next slide
Read ALL the instructions first. Over the next two lessons you are going to carry out an investigation into a topic of your choice. You are going to need to be able to collect at least 10 pieces of data. Here are some possible examples: · Number of steps taken vs length (in minutes) of walk · Number of pages in a book vs length of the author’s name · Height vs hand/paw length (if you have at least 10 people and animals in your household) · Length of movie vs star rating (imdb. com) 1. First you need to make a plan for your investigation. It needs to include: · The two variables being measured. · The equipment needed (ruler, tape measure, timer, computer, etc) · When you will do this if it can’t be done in the lesson time. · What type of correlation you think your results will show.
2. If you have any squared paper, now is the time to use it. You may need to remove a page from one of your maths books. If this isn’t possible you can google ‘squared paper’ and then print some out. Create axes (that is x-axis and y-axis) long enough to include the largest piece of data from the two variables and choose a scale wisely. As usual with graphs you need a title and labels on each axis. 3. Plot your points. 4. If possible (if there is actually a correlation) draw a line of best fit.
5. Create a poster to show your findings. You could answer the following questions: • What type of correlation can you see? • Do you think one variable causes the other? Why? • Were there any issues with your investigation? • What would you do differently if you had to carry it out again? • Are your results useful in any way? Would you be able to use your line of best fit to answer questions about the data? • Can you extrapolate (you may have to look this word up) your scatter diagram? 6. Take a photo of your poster and email it to me.