4 1 The Super Project Cash Flow Estimation

- Slides: 15
4 - 1 The Super Project Cash Flow Estimation for Capital Budgeting
4 - 2 Investment Criteria w Project ranking according to Payback period è Accounting rate of return è w Are certain costs being ignored? w What are the relevant project costs and cash flows? Test-market expenses è Use of excess agglomerator and building capacity è Overhead costs è Lost contribution margin on Jell-O è
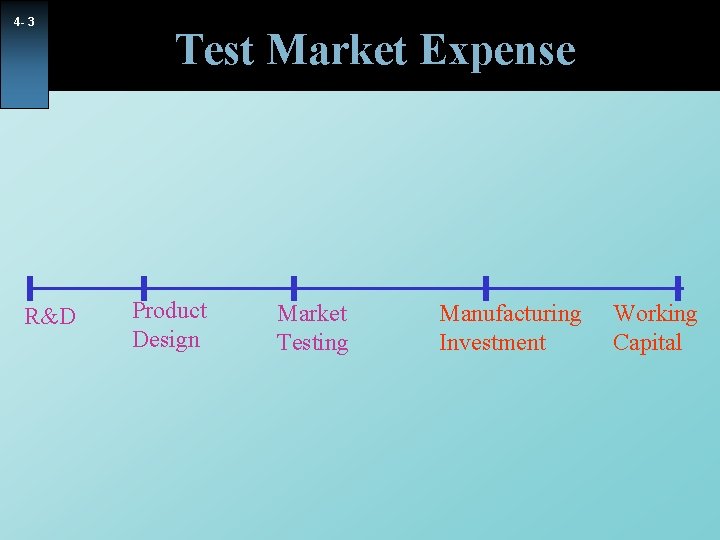
4 - 3 R&D Test Market Expense Product Design Market Testing Manufacturing Investment Working Capital
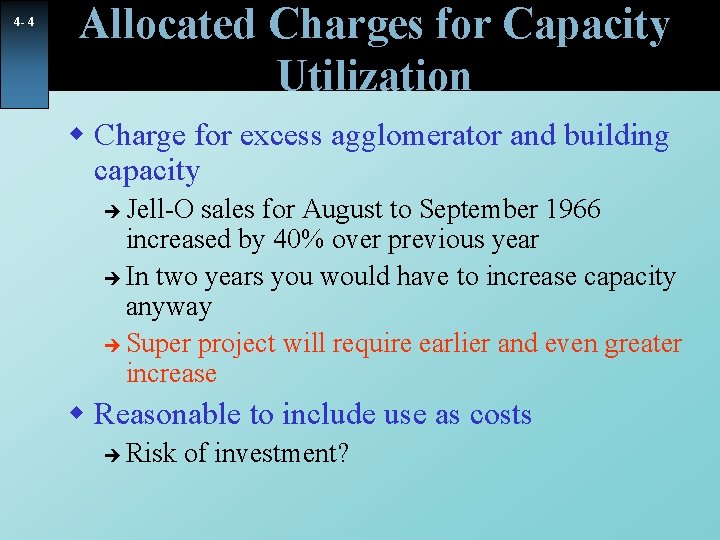
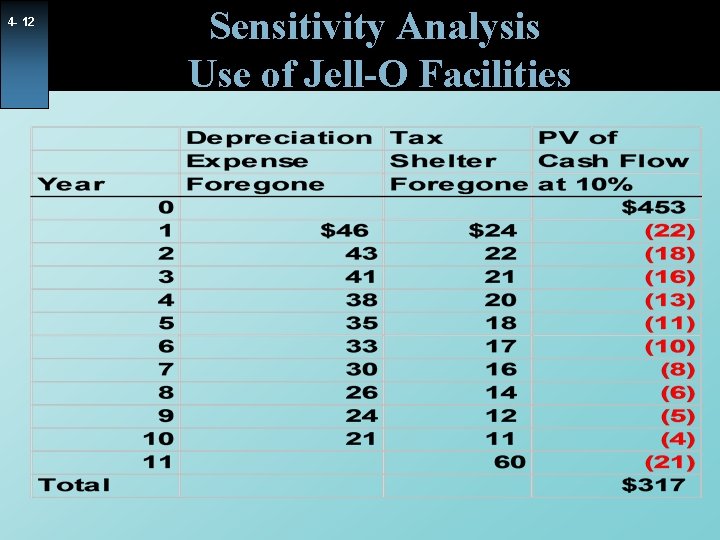
4 - 4 Allocated Charges for Capacity Utilization w Charge for excess agglomerator and building capacity Jell-O sales for August to September 1966 increased by 40% over previous year è In two years you would have to increase capacity anyway è Super project will require earlier and even greater increase è w Reasonable to include use as costs è Risk of investment?
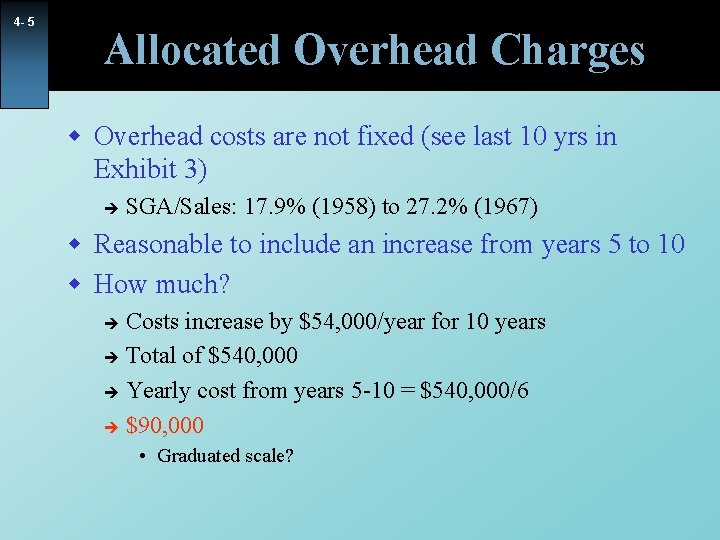
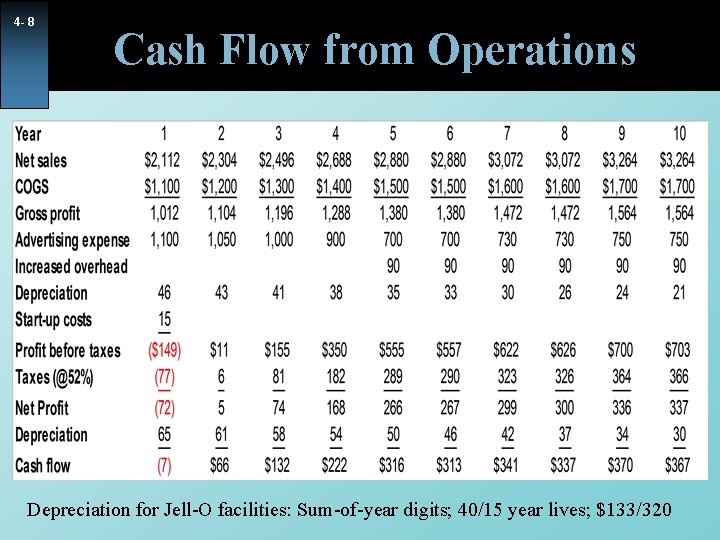
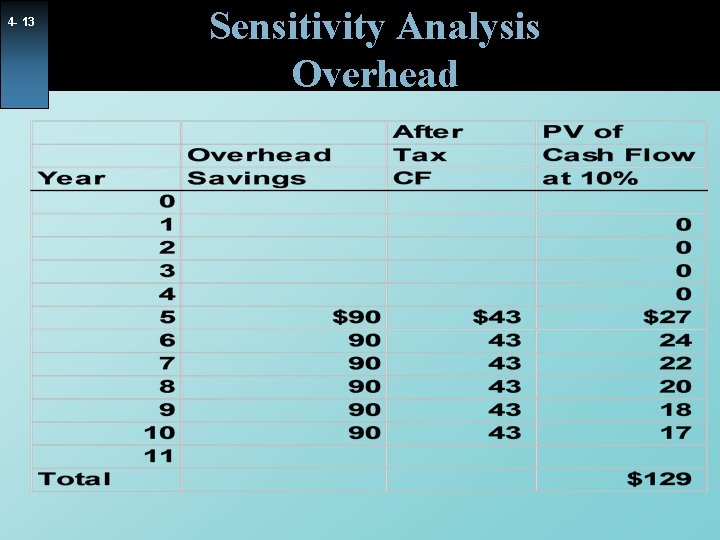
4 - 5 Allocated Overhead Charges w Overhead costs are not fixed (see last 10 yrs in Exhibit 3) è SGA/Sales: 17. 9% (1958) to 27. 2% (1967) w Reasonable to include an increase from years 5 to 10 w How much? Costs increase by $54, 000/year for 10 years è Total of $540, 000 è Yearly cost from years 5 -10 = $540, 000/6 è $90, 000 è • Graduated scale?
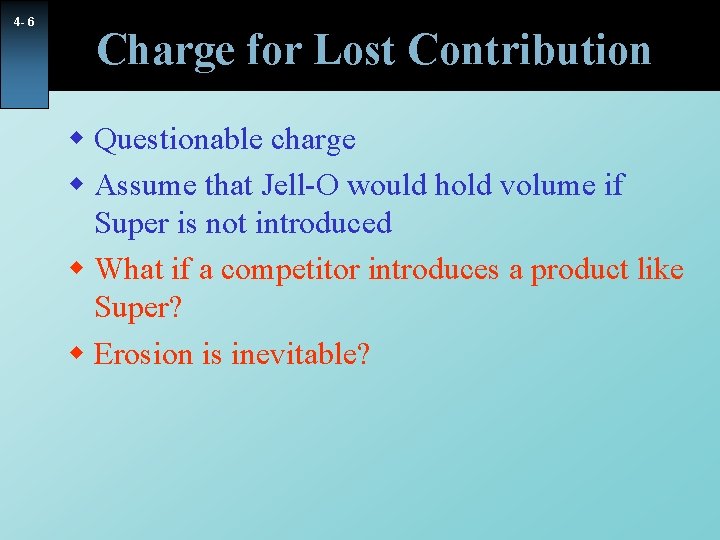
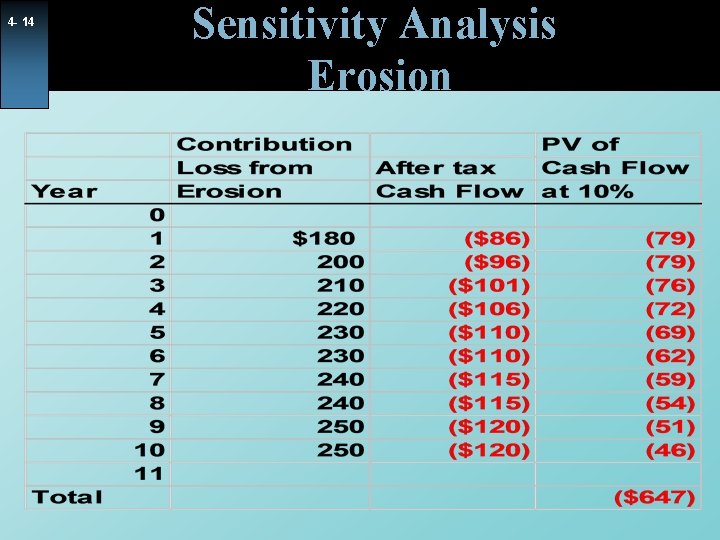
4 - 6 Charge for Lost Contribution w Questionable charge w Assume that Jell-O would hold volume if Super is not introduced w What if a competitor introduces a product like Super? w Erosion is inevitable?
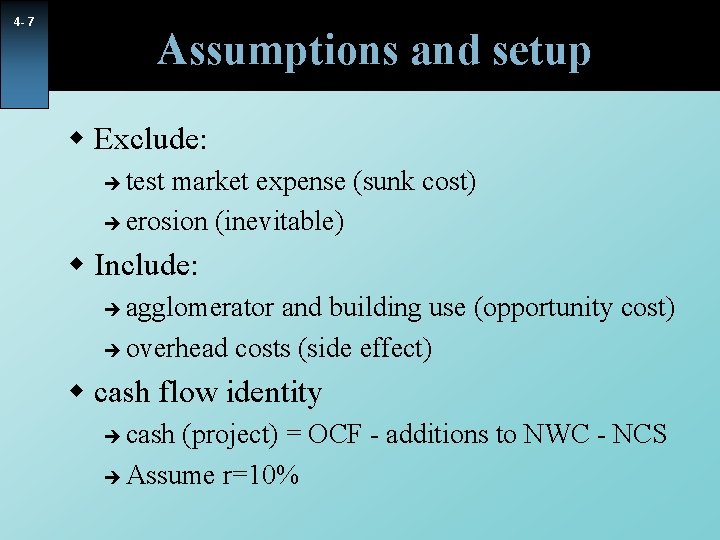
4 - 7 Assumptions and setup w Exclude: test market expense (sunk cost) è erosion (inevitable) è w Include: agglomerator and building use (opportunity cost) è overhead costs (side effect) è w cash flow identity cash (project) = OCF - additions to NWC - NCS è Assume r=10% è
4 - 8 Cash Flow from Operations Depreciation for Jell-O facilities: Sum-of-year digits; 40/15 year lives; $133/320
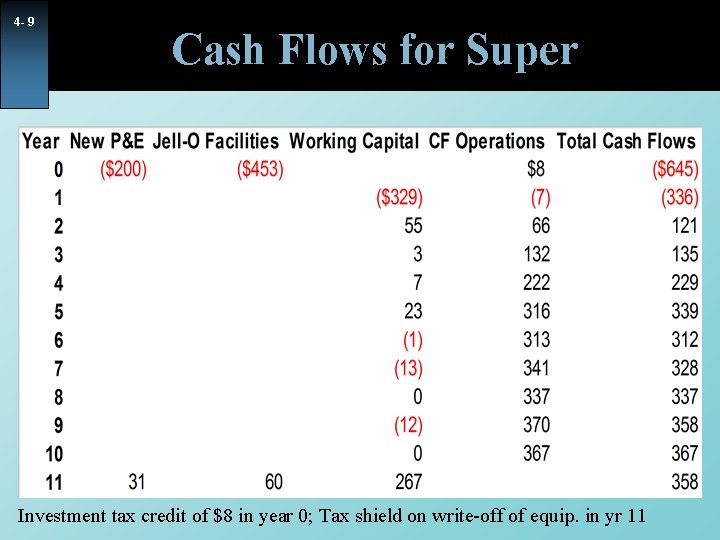
4 - 9 Cash Flows for Super Investment tax credit of $8 in year 0; Tax shield on write-off of equip. in yr 11
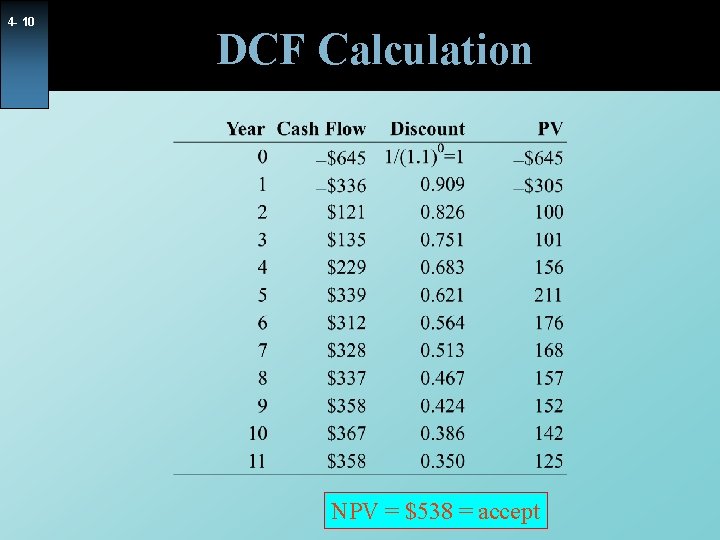
4 - 10 DCF Calculation NPV = $538 = accept
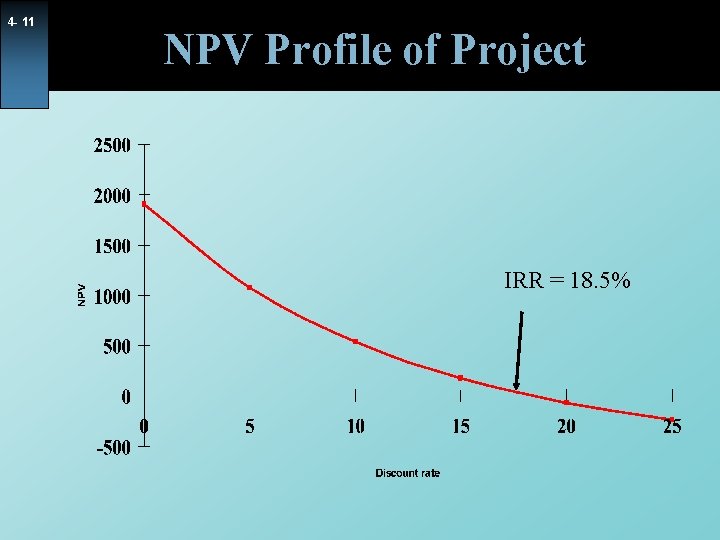
4 - 11 NPV Profile of Project IRR = 18. 5%
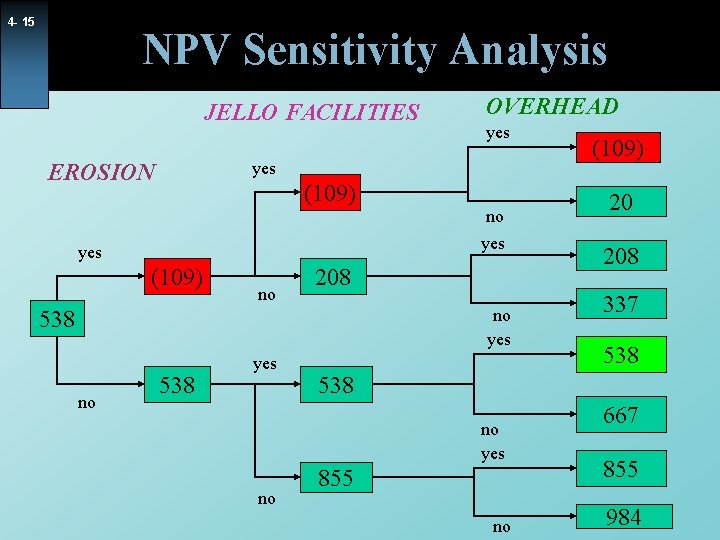
4 - 12 Sensitivity Analysis Use of Jell-O Facilities
4 - 13 Sensitivity Analysis Overhead
4 - 14 Sensitivity Analysis Erosion
4 - 15 NPV Sensitivity Analysis JELLO FACILITIES OVERHEAD yes EROSION (109) yes (109) no no yes 208 no yes 538 no 538 yes 20 208 337 538 no yes no (109) 855 no 667 855 984