1 MEMPHIS DISTRICT PROCUREMENT OPPORTUNITIES 255 255 237
- Slides: 9
1 MEMPHIS DISTRICT PROCUREMENT OPPORTUNITIES 255 255 237 237 217 217 200 200 0 163 163 131 132 122 239 65 53 80 119 27 252 174. 59 110 135 120 112 92 56 Thomas Mercer Deputy, Small Business Programs 62 102 130 102 56 48 130 120 111
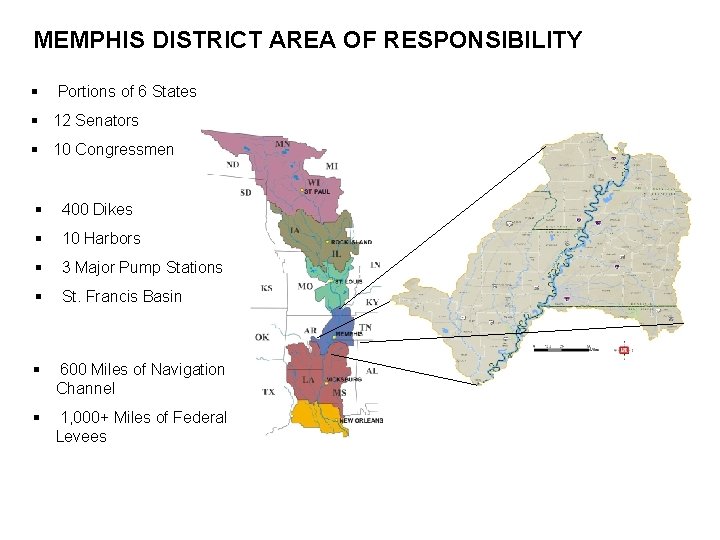
MEMPHIS DISTRICT AREA OF RESPONSIBILITY § Portions of 6 States § 12 Senators § 10 Congressmen § 400 Dikes § 10 Harbors § 3 Major Pump Stations § St. Francis Basin § 600 Miles of Navigation Channel § 1, 000+ Miles of Federal Levees
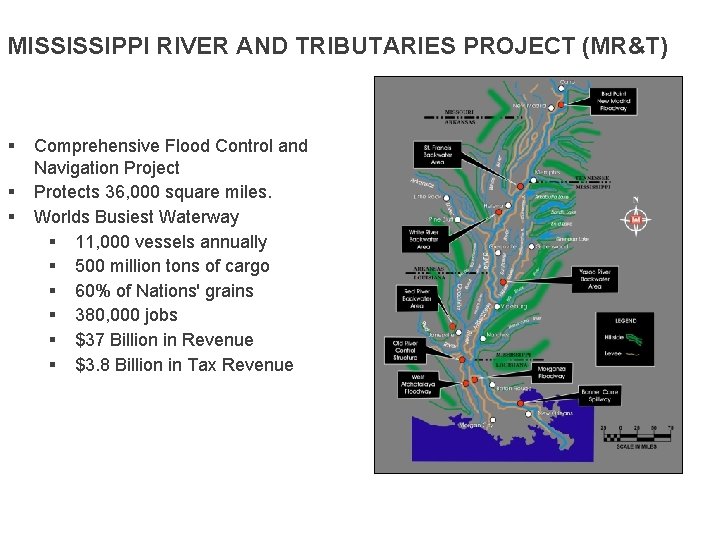
MISSISSIPPI RIVER AND TRIBUTARIES PROJECT (MR&T) § § § Comprehensive Flood Control and Navigation Project Protects 36, 000 square miles. Worlds Busiest Waterway § 11, 000 vessels annually § 500 million tons of cargo § 60% of Nations' grains § 380, 000 jobs § $37 Billion in Revenue § $3. 8 Billion in Tax Revenue
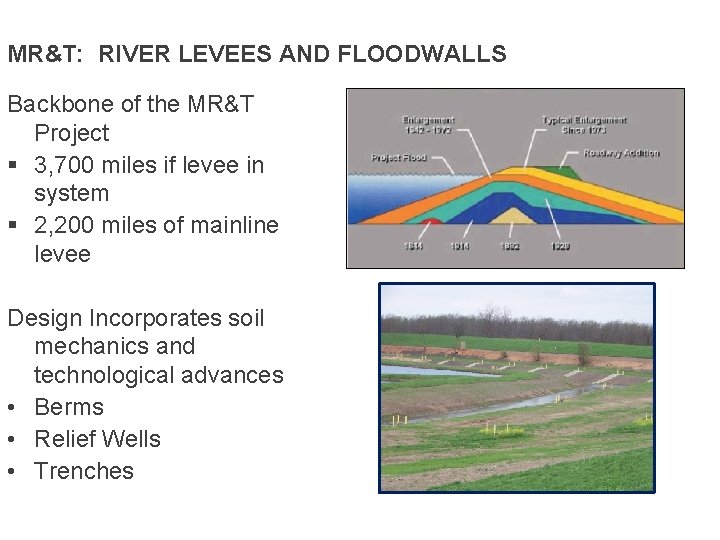
MR&T: RIVER LEVEES AND FLOODWALLS Backbone of the MR&T Project § 3, 700 miles if levee in system § 2, 200 miles of mainline levee Design Incorporates soil mechanics and technological advances • Berms • Relief Wells • Trenches
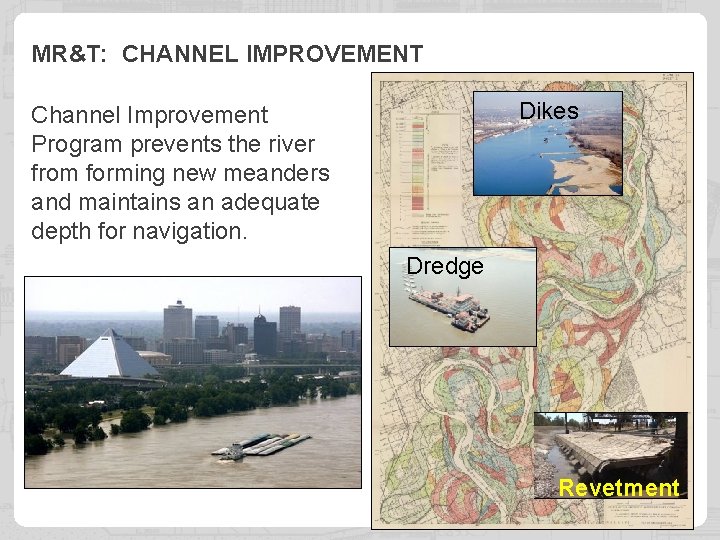
MR&T: CHANNEL IMPROVEMENT Dikes Channel Improvement Program prevents the river from forming new meanders and maintains an adequate depth for navigation. Dredge Revetment
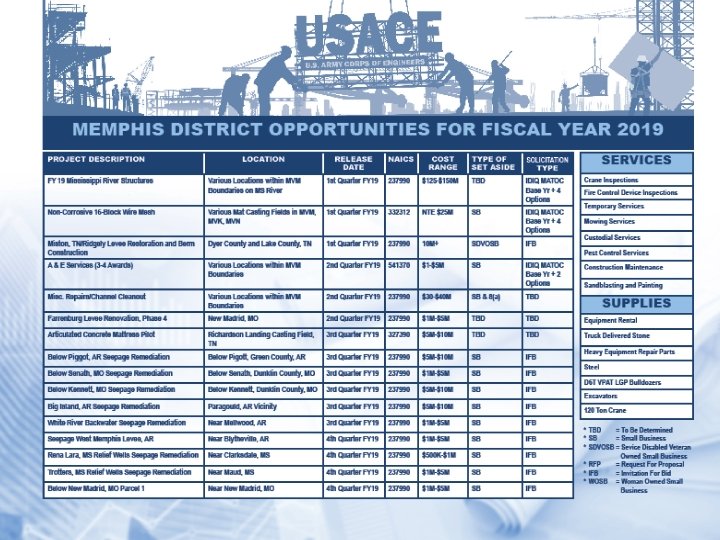
SUPPLY AND SERVICES OPPORTUNITIES § SERVICES - Crane Inspections - Fire Control Device Inspections - Temporary Services Mowing Services - Custodial Services Pest Control Services - Construction Maintenance - Propeller Refurbishing - Propeller Fabrication - Sandblasting and Painting § SUPPLIES - Equipment Rental - Truck Delivered Stone - Heavy Equipment Repair Parts - Steel - D 6 T VPAT LGP Bulldozers - Excavators - 120 Ton Crane - Welding Supplies
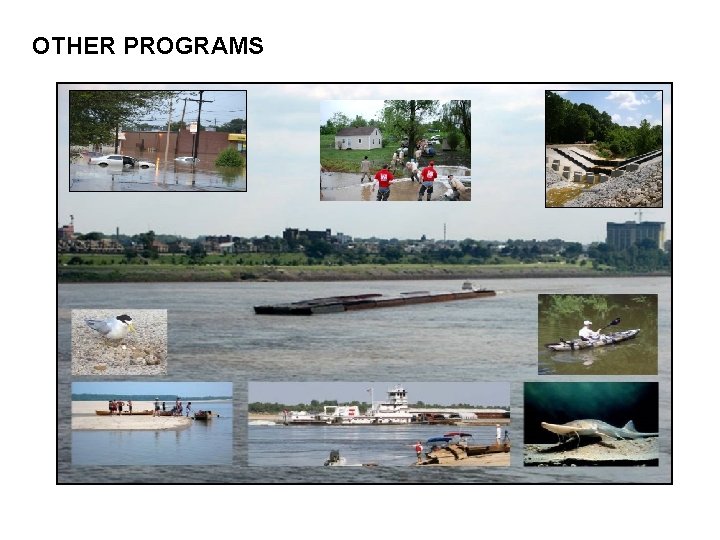
OTHER PROGRAMS
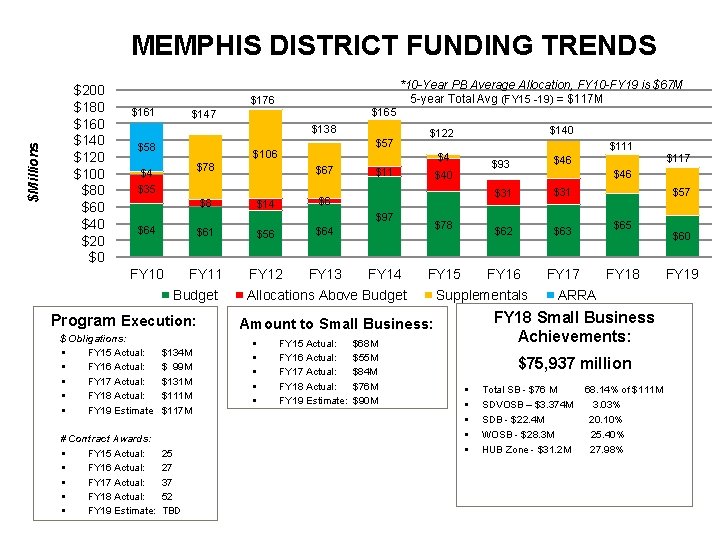
$Millions MEMPHIS DISTRICT FUNDING TRENDS $200 $180 $160 $140 $120 $100 $80 $60 $40 $20 $0 $176 $161 $165 $147 *10 -Year PB Average Allocation, FY 10 -FY 19 is $67 M 5 -year Total Avg (FY 15 -19) = $117 M $138 $57 $106 $4 $35 $78 $67 $8 $14 $6 $61 $56 $64 FY 10 FY 11 FY 12 FY 13 Program Execution: $ Obligations: § FY 15 Actual: $134 M § FY 16 Actual: $ 99 M § FY 17 Actual: $131 M § FY 18 Actual: $111 M § FY 19 Estimate $117 M # Contract Awards: § FY 15 Actual: 25 § FY 16 Actual: 27 § FY 17 Actual: 37 § FY 18 Actual: 52 § FY 19 Estimate: TBD $140 $4 $93 $46 $31 $62 $63 FY 16 FY 17 $11 FY 14 $111 $40 $97 $64 Budget $122 $78 FY 15 Allocations Above Budget § § § FY 15 Actual: $68 M FY 16 Actual: $55 M FY 17 Actual: $84 M FY 18 Actual: $76 M FY 19 Estimate: $90 M $46 Supplementals $57 $65 FY 18 ARRA FY 18 Small Business Achievements: Amount to Small Business: $75, 937 million § § § $117 Total SB - $76 M 68. 14% of $111 M SDVOSB – $3. 374 M 3. 03% SDB - $22. 4 M 20. 10% WOSB - $28. 3 M 25. 40% HUB Zone - $31. 2 M 27. 98% $60 FY 19
9 File Name