Zscores P MGT 630 Statistical analysis We know


 returns the z-score for a value")


 Complaints against Complaints z-score (C)")
 Complaints against Complaints (reversed) z-score")
 Complaints against Complaints Equally (reversed)")


- Slides: 27
Z-scores P MGT 630 Statistical analysis
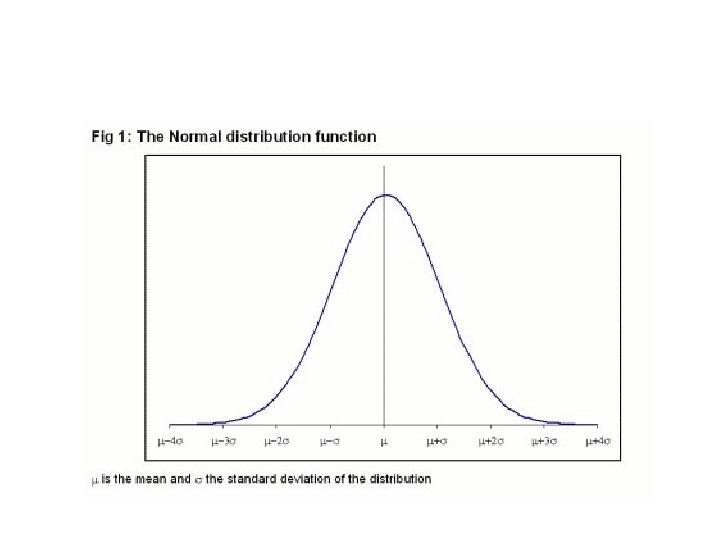
• We know everything about the distribution of a normally distributed variable if we know the mean and the standard deviation. • Using these two values, we can figure out how likely we are to observe any value. • This is very useful when we need to standardize decisionmaking
• Let’s call a one standard deviation distance from the mean “z”. • When we count distances from the mean in “z, ” this is called a z-score or a standard normal score.
• You can figure out how many “z”s away from the mean any number is.
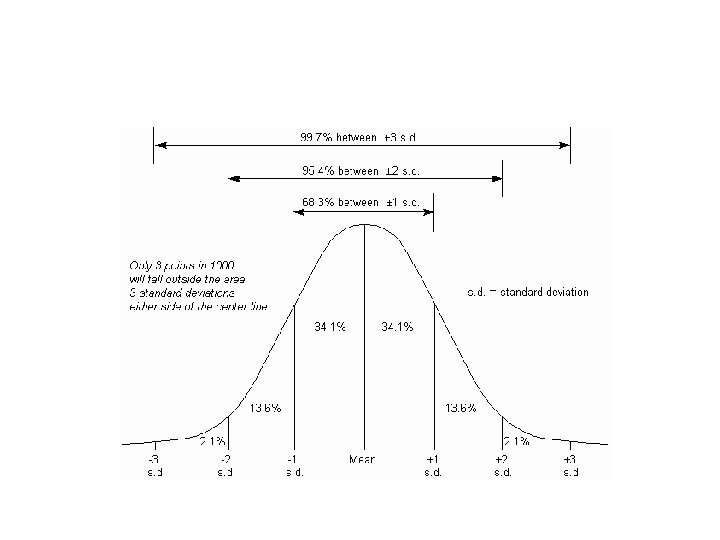
• A negative z-score indicates a value below the mean. • A positive z-score indicates a value above the mean. • The normal curve is symmetric, so a z-score of –z has the same probability of occurring as a score of z.
Application of z-scores to your data • Option 1: Create an index variable (weighted or unweighted) • Option 2: Identify a cutoff point based on a probability • Option 3: Identify a probability associated with a cutoff point (or points)
Excel Functions • =standardize (x, mean, standard deviation) returns the z-score for a value in your distribution • =normdist (x, mean, standard deviation, TRUE) returns the probability of returning any number up to and including x • =norminv(probability, mean, standard deviation) returns the value associated with a particular cumulative probability • =normsdist(z) returns the cumulative probability associated with a particular z-score • =normsinv(probability) returns a z-score associated with a particular cumulative probability
Creating an index: Combined scores using z-scores • Step 1: Calculate the mean and standard deviation for each variable you want to include in your composite score. • Step 2. Convert each of the raw scores into z-scores using the standardization formula (z=(scoremean)/standard deviation) or Excel (=standardize(score, mean, standard deviation)) • Step 3: Weight the individual subscores, if desired. • Step 4: Add the z-scores for the (weighted) variables you want to include in the composite index score.
Example problem: Garbage collection Crew Tons collected Complaints against A 127 6 B 132 8 C 118 4 D 170 9 E 123 3 Step 1: Calculate mean and standard deviation
Example problem: Garbage collection Crew Tons collected Complaints against A 127 6 B 132 8 C 118 4 D 170 9 E 123 3 Mean 134 6 Standard deviation 18. 6 2. 3 Step 2: Calculate z-scores
Example problem: Garbage collection Crew Tons collected zscore (T) Complaints against Complaints z-score (C) A 127 -. 38 6 0 B 132 -. 11 8 . 87 C 118 -. 86 4 -. 87 D 170 1. 94 9 1. 30 E 123 -. 59 3 -1. 30 Mean 134 6 Standard deviation 18. 6 2. 3 Step 3: Add weights, if desired
Example problem: Garbage collection Crew Tons collected zscore (T) Complaints against Complaints (reversed) z-score (C) A 127 -. 38 6 0 B 132 -. 11 8 -. 87 C 118 -. 86 4 . 87 D 170 1. 94 9 -1. 30 E 123 -. 59 3 1. 30 Mean 134 6 Standard deviation 18. 6 2. 3 Step 4: Add the z-scores to create a composite index
Example problem: Garbage collection Crew Tons collected zscore (T) Complaints against Complaints Equally (reversed) weighted z-score (C) performance score (T+C) A 127 -. 38 6 0 -. 38 B 132 -. 11 8 -. 87 -. 98 C 118 -. 86 4 . 87 . 01 D 170 1. 94 9 -1. 30 . 64 E 123 -. 59 3 1. 30 . 71 Mean 134 6 Standard deviation 18. 6 2. 3 Ta-da! Use these scores to evaluate
Creating a cutoff point: Using z-scores to create evaluation criteria • Step 1: Calculate the mean and standard deviation of the population or sample • Step 2: Define the problem in terms of cutoff points and probabilities. • Step 3: Identify the probability associated with the desired cutoff point. • Step 4: Use Excel to identify the raw score associated with the desired cutoff point.
Example: MPA Admissions • There are 268 applicants to the MPA program. I can only admit 80 students to the program, or about 30 percent of all applicants. I can offer scholarships to the top 5 percent of applicants. • Step 1: Calculate the mean and standard deviation of the population or sample.
Example: MPA Admissions • There are 268 applicants to the MPA program. I can only admit 80 students to the program, or about 30 percent of all applicants. I can offer scholarships to the top 5 percent of applicants. The mean GRE score is 320 with a standard deviation of 15. 2. • Step 2: Define the problem in terms of cutoff points and probabilities.
• There are 268 applicants to the MPA program. I can only admit 80 students to the program, or about 30 percent of all applicants. I can offer scholarships to the top 5 percent of applicants. The mean GRE score is 320 with a standard deviation of 15. 2. – What GRE score must a person have to be in the top 30 percent of applicants? – What GRE score must a person have to be in the top 5 percent of applicants? • Step 3: Identify the probability associated with the desired cutoff point.
• There are 268 applicants to the MPA program. I can only admit 80 students to the program, or about 30 percent of all applicants. I can offer scholarships to the top 5 percent of applicants. The mean GRE score is 320 with a standard deviation of 15. 2. – What GRE score must a person have to be in the top 30 percent of applicants, or to have 70 percent of applicants below his/her score? – What GRE score must a person have to be in the top 5 percent of applicants, or to have 95 percent of applicants below his/her score? • Step 3: Use Excel to identify the raw score associated with the desired cutoff point.
• The mean GRE score is 1120. 56 with a standard deviation of 158. 36. – What GRE score must a person have to be in the top 30 percent of applicants, or to have 70 percent of applicants below his/her score? • =NORMINV(0. 7, 320, 15. 2) • =327. 97 – What GRE score must a person have to be in the top 5 percent of applicants, or to have 95 percent of applicants below his/her score? • =NORMINV(0. 95, 320, 15. 2) • =345 • We can admit students with GRE scores above 328 and offer scholarships to students with GRE scores above 345.
Converting a score to a probability: Figuring out what a raw score means • Step 1: Calculate the mean and standard deviation of the population or sample • Step 2: Identify the score of interest • Step 3: Use Excel to identify the z-score associated with the raw score of interest. • Step 4: Use Excel to determine what percent of observations in the sample or population have scores below the score of interest
Example: The Applicant • I am an MPA applicant and have a GRE score of 330. I want to know how that compares with other applicant’s scores. • Step 1: Calculate the mean and standard deviation of the population or sample
• I am an MPA applicant and have a GRE score of 330. I want to know how that compares with other applicant’s scores. I discover that among applicants, the mean GRE score is 320 with a standard deviation of 15. 2. • Step 2: Identify the score of interest
• I am an MPA applicant and have a GRE score of 330. I want to know how that compares with other applicant’s scores. I discover that among applicants, the mean GRE score is 320 with a standard deviation of 15. 2. • Step 3: Use Excel to identify the z-score associated with the raw score of interest.
• I am an MPA applicant and have a GRE score of 330. I want to know how that compares with other applicant’s scores. I discover that among applicants, the mean GRE score is 320 with a standard deviation of 15. 2. =STANDARDIZE(330, 320, 15. 2) =0. 6579 • My score is a little more than one standard deviation above the mean. • Step 4: Use Excel to determine what percent of observations in the sample or population have scores below the score of interest
• I am an MPA applicant and have a GRE score of 330. I want to know how that compares with other applicant’s scores. I discover that among applicants, the mean GRE score is 320 with a standard deviation of 15. 2. =STANDARDIZE(330, 320, 15. 2) =0. 6579 • My score is a little more than one standard deviation above the mean. =NORMDIST(330, 320, 15. 2, TRUE) =. 745 About 74. 5 percent of all other applicants have scores below mine.