
Zachary Reed Joseph Hodges Materials Measurement Laboratory National
Zachary Reed Joseph Hodges Materials Measurement Laboratory National Institute of Standards and Technology
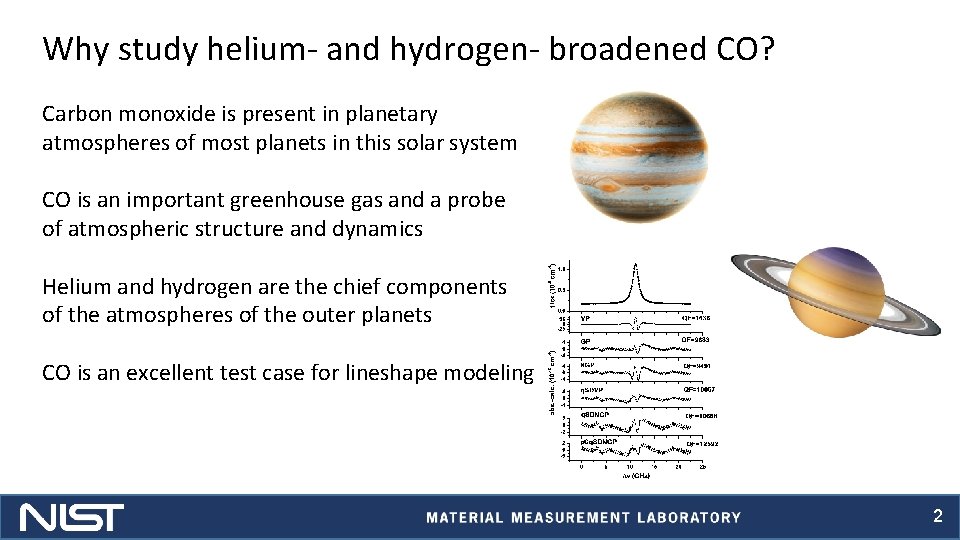
Why study helium- and hydrogen- broadened CO? Carbon monoxide is present in planetary atmospheres of most planets in this solar system CO is an important greenhouse gas and a probe of atmospheric structure and dynamics Helium and hydrogen are the chief components of the atmospheres of the outer planets CO is an excellent test case for lineshape modeling 2
1. Li, G. et al Astrophys. J. 216, 15, 2015 3
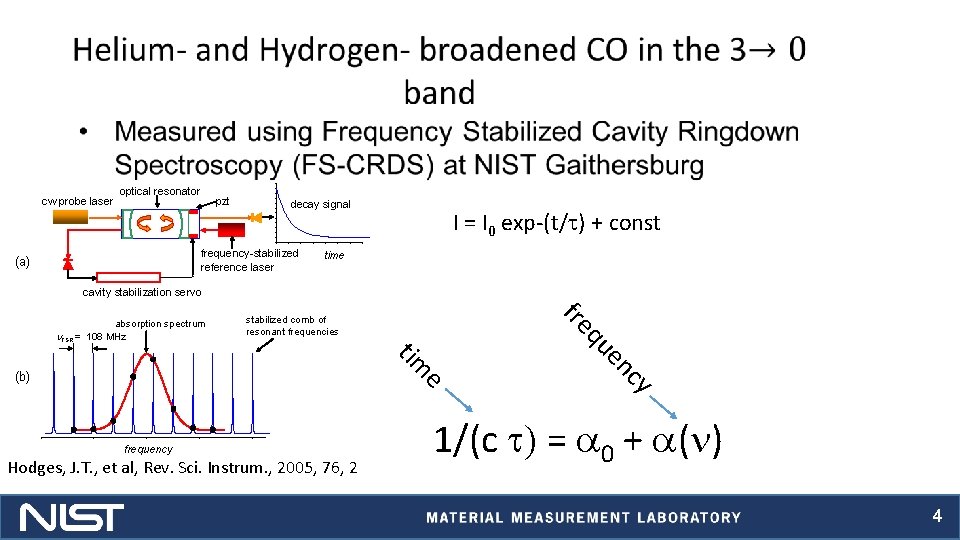
cw probe laser optical resonator pzt decay signal frequency-stabilized reference laser (a) I = I 0 exp-(t/t) + const time cavity stabilization servo stabilized comb of resonant frequencies Hodges, J. T. , et al, Rev. Sci. Instrum. , 2005, 76, 2 cy e frequency en tim (b) qu fre absorption spectrum n. FSR = 108 MHz 1/(c t) = a 0 + a(n) 4
Lineshape Parameter Analysis • Pressure constrained Multispectrum fitting used to extract line shape parameters • p. Cq. SDNGP profile employed 5
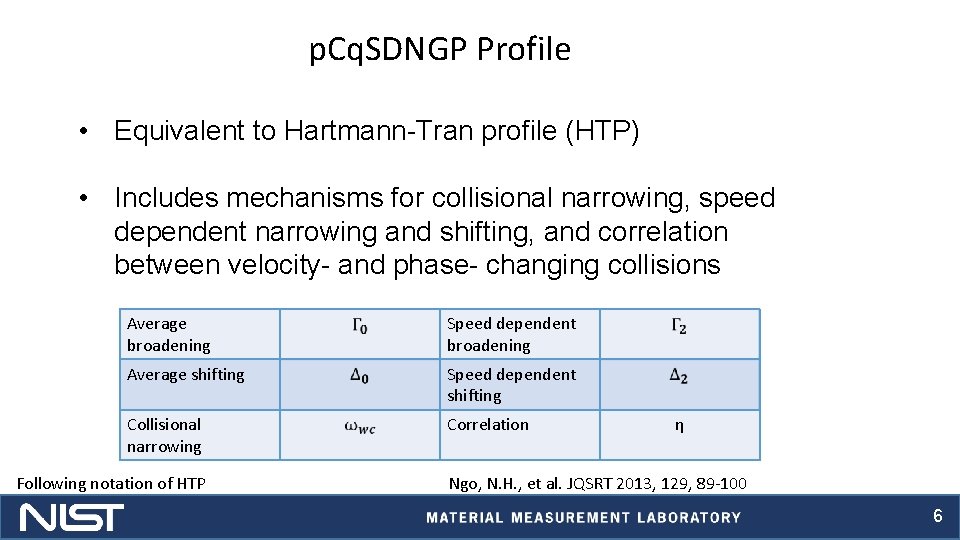
p. Cq. SDNGP Profile • Equivalent to Hartmann-Tran profile (HTP) • Includes mechanisms for collisional narrowing, speed dependent narrowing and shifting, and correlation between velocity- and phase- changing collisions Average broadening Speed dependent broadening Average shifting Speed dependent shifting Collisional narrowing Correlation Following notation of HTP η Ngo, N. H. , et al. JQSRT 2013, 129, 89 -100 6
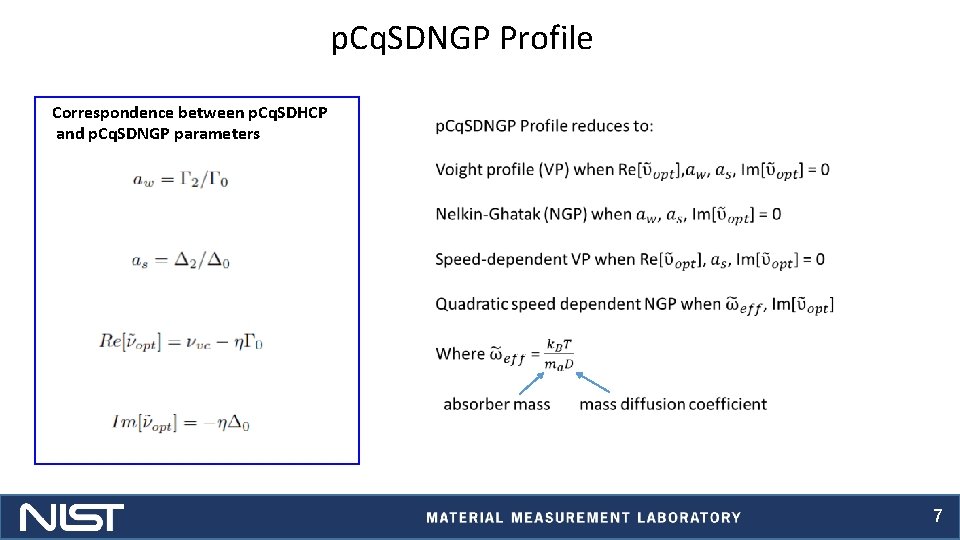
p. Cq. SDNGP Profile Correspondence between p. Cq. SDHCP and p. Cq. SDNGP parameters 7
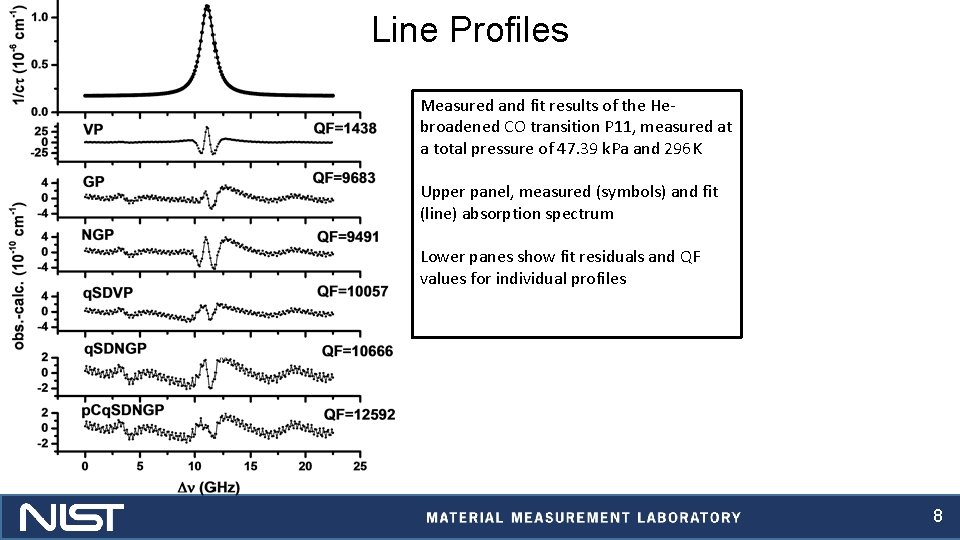
Line Profiles Measured and fit results of the Hebroadened CO transition P 11, measured at a total pressure of 47. 39 k. Pa and 296 K Upper panel, measured (symbols) and fit (line) absorption spectrum Lower panes show fit residuals and QF values for individual profiles 8
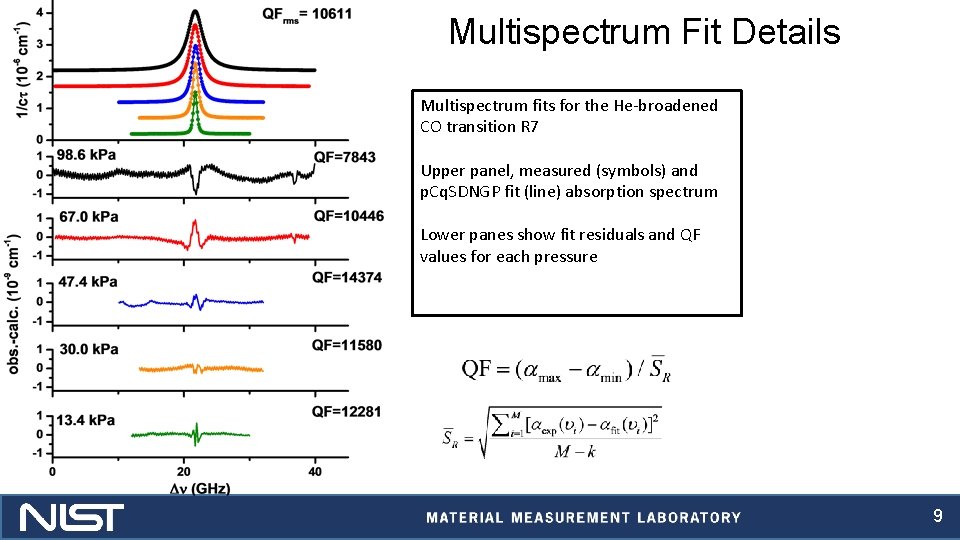
Multispectrum Fit Details Multispectrum fits for the He-broadened CO transition R 7 Upper panel, measured (symbols) and p. Cq. SDNGP fit (line) absorption spectrum Lower panes show fit residuals and QF values for each pressure 9
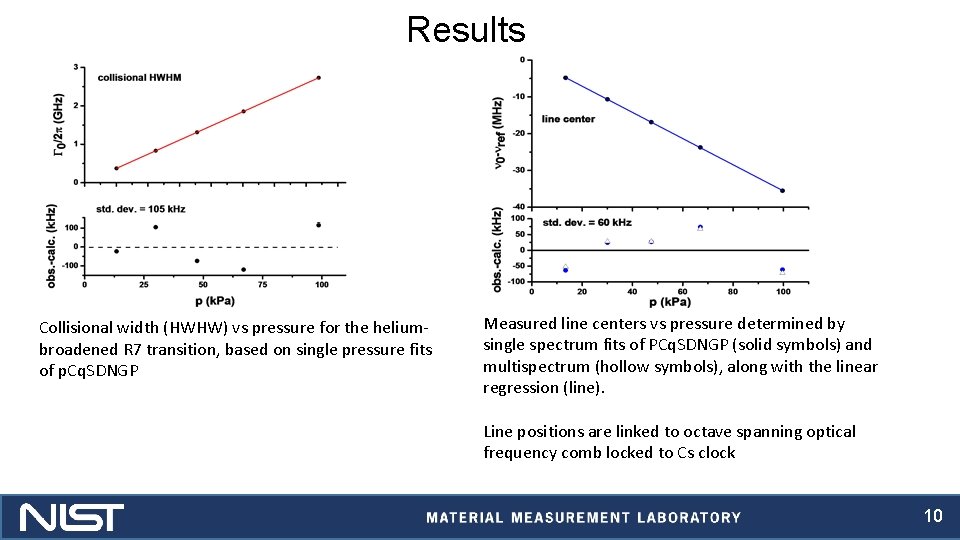
Results Collisional width (HWHW) vs pressure for the heliumbroadened R 7 transition, based on single pressure fits of p. Cq. SDNGP Measured line centers vs pressure determined by single spectrum fits of PCq. SDNGP (solid symbols) and multispectrum (hollow symbols), along with the linear regression (line). Line positions are linked to octave spanning optical frequency comb locked to Cs clock 10
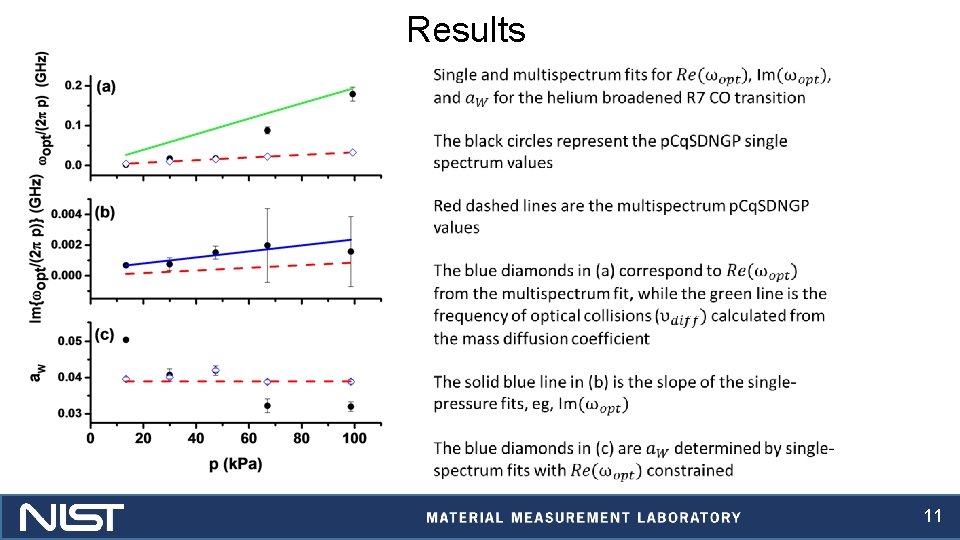
Results 11
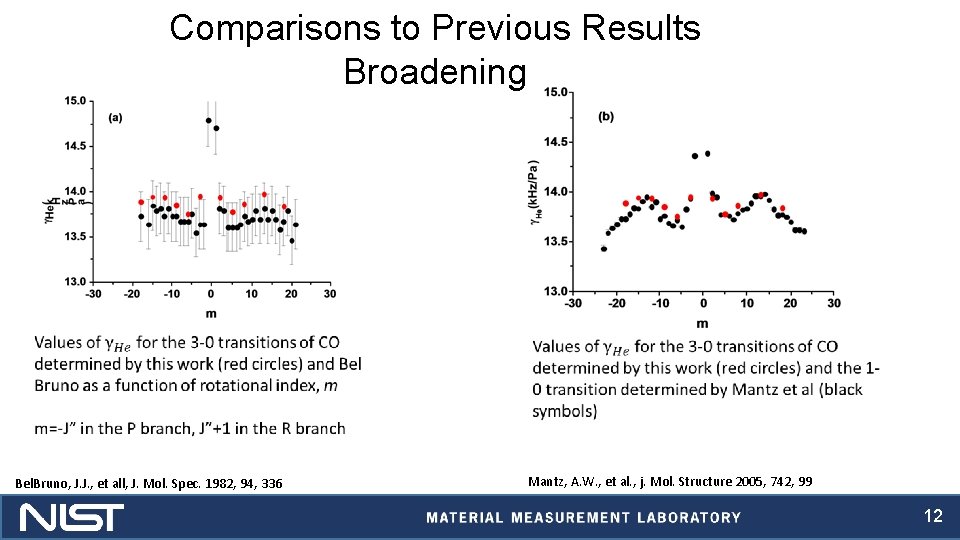
Comparisons to Previous Results Broadening Bel. Bruno, J. J. , et all, J. Mol. Spec. 1982, 94, 336 Mantz, A. W. , et al. , j. Mol. Structure 2005, 742, 99 12
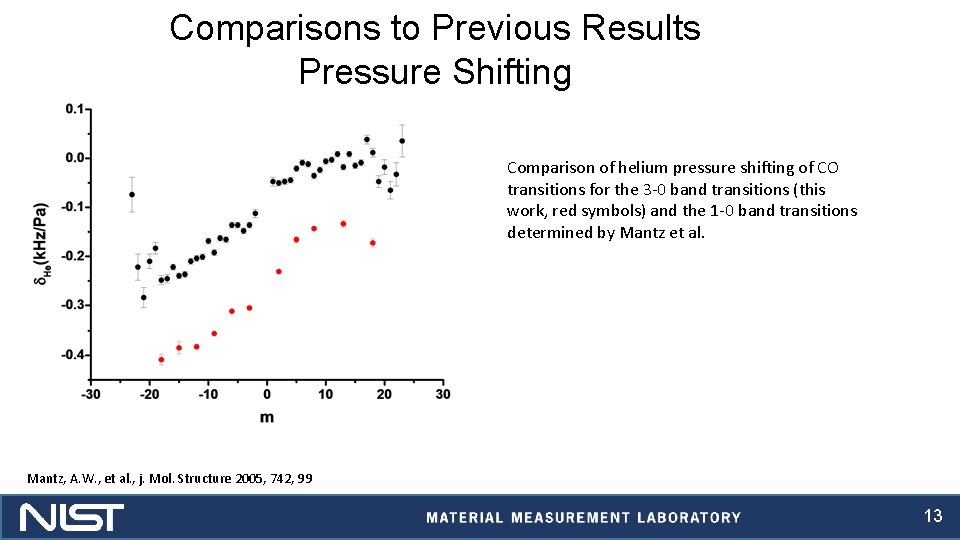
Comparisons to Previous Results Pressure Shifting Comparison of helium pressure shifting of CO transitions for the 3 -0 band transitions (this work, red symbols) and the 1 -0 band transitions determined by Mantz et al. Mantz, A. W. , et al. , j. Mol. Structure 2005, 742, 99 13
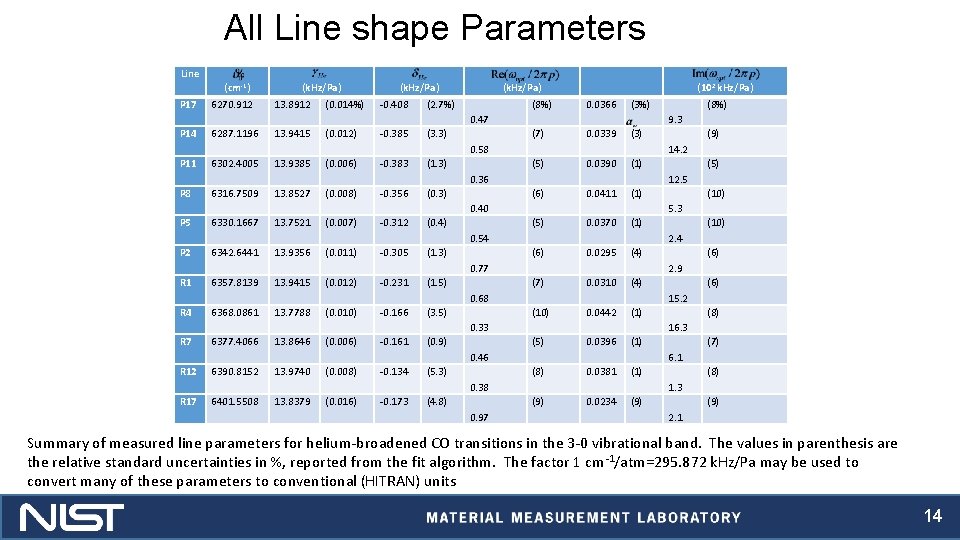
All Line shape Parameters Line P 17 (cm-1) 6270. 912 (k. Hz/Pa) 13. 8912 (0. 014%) (k. Hz/Pa) -0. 408 (2. 7%) (k. Hz/Pa) (8%) 0. 0366 (3%) 0. 47 P 14 6287. 1196 13. 9415 (0. 012) -0. 385 (3. 3) P 11 6302. 4005 13. 9385 (0. 006) -0. 383 (1. 3) 9. 3 (7) 0. 0339 (3) (5) 0. 0390 (1) 0. 58 6316. 7509 13. 8527 (0. 008) -0. 356 (0. 3) P 5 6330. 1667 13. 7521 (0. 007) -0. 312 (0. 4) (6) 0. 0411 (1) (5) 0. 0370 (1) 13. 9356 (0. 011) -0. 305 (1. 3) 6357. 8139 13. 9415 (0. 012) -0. 231 (1. 5) R 4 6368. 0861 13. 7788 (0. 010) -0. 166 (3. 5) (6) 0. 0295 (4) (7) 0. 0310 (4) (10) 0. 0442 (1) 13. 8646 (0. 006) -0. 161 (0. 9) R 12 6390. 8152 13. 9740 (0. 008) -0. 134 (5. 3) (5) 0. 0396 (1) (8) 0. 0381 (1) 13. 8379 (0. 016) -0. 173 (4. 8) (8) 1. 3 (9) 0. 97 (7) 6. 1 0. 38 6401. 5508 (8) 16. 3 0. 46 R 17 (6) 15. 2 0. 33 6377. 4066 (6) 2. 9 0. 68 R 7 (10) 2. 4 0. 77 R 1 (10) 5. 3 0. 54 6342. 6441 (5) 12. 5 0. 40 P 2 (9) 14. 2 0. 36 P 8 (102 k. Hz/Pa) (8%) 0. 0234 (9) 2. 1 Summary of measured line parameters for helium-broadened CO transitions in the 3 -0 vibrational band. The values in parenthesis are the relative standard uncertainties in %, reported from the fit algorithm. The factor 1 cm -1/atm=295. 872 k. Hz/Pa may be used to convert many of these parameters to conventional (HITRAN) units 14
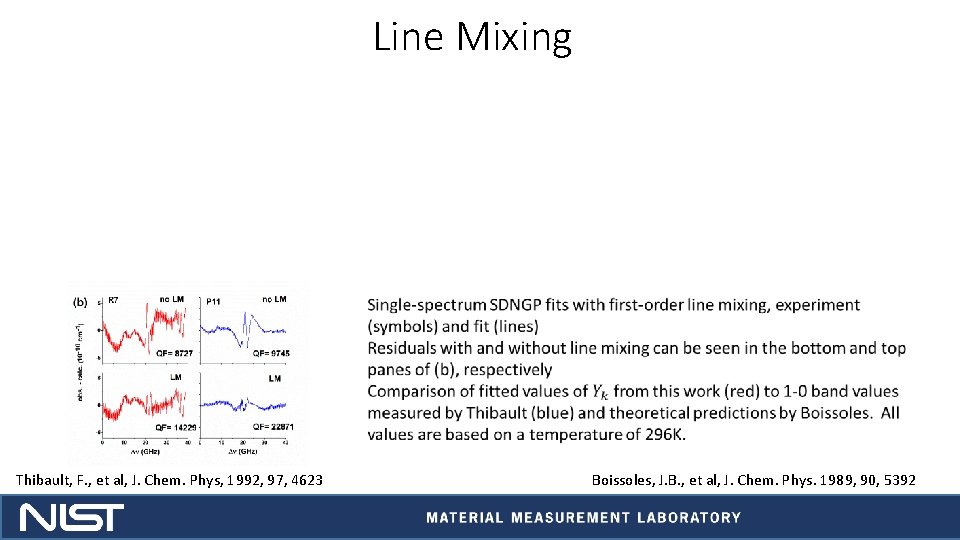
Line Mixing Thibault, F. , et al, J. Chem. Phys, 1992, 97, 4623 Boissoles, J. B. , et al, J. Chem. Phys. 1989, 90, 5392 15
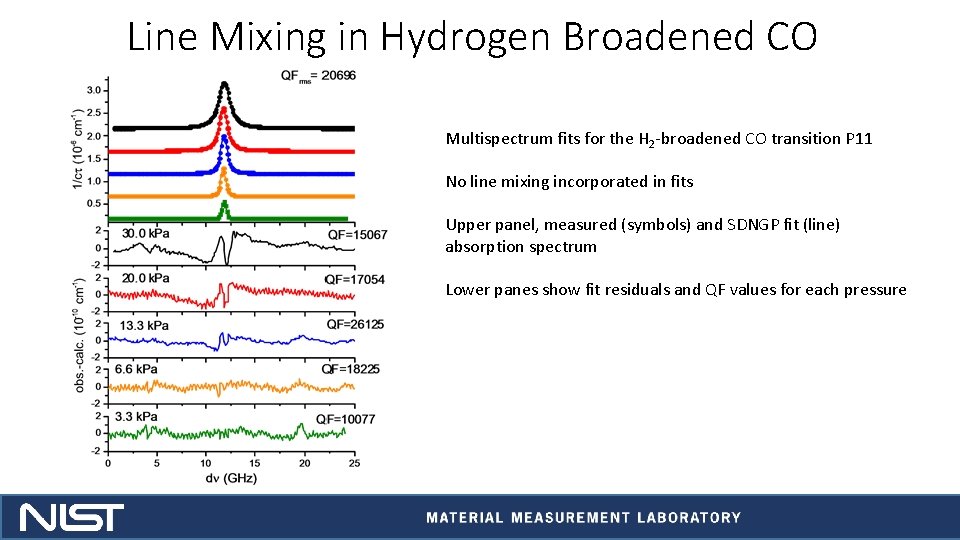
Line Mixing in Hydrogen Broadened CO Multispectrum fits for the H 2 -broadened CO transition P 11 No line mixing incorporated in fits Upper panel, measured (symbols) and SDNGP fit (line) absorption spectrum Lower panes show fit residuals and QF values for each pressure 16
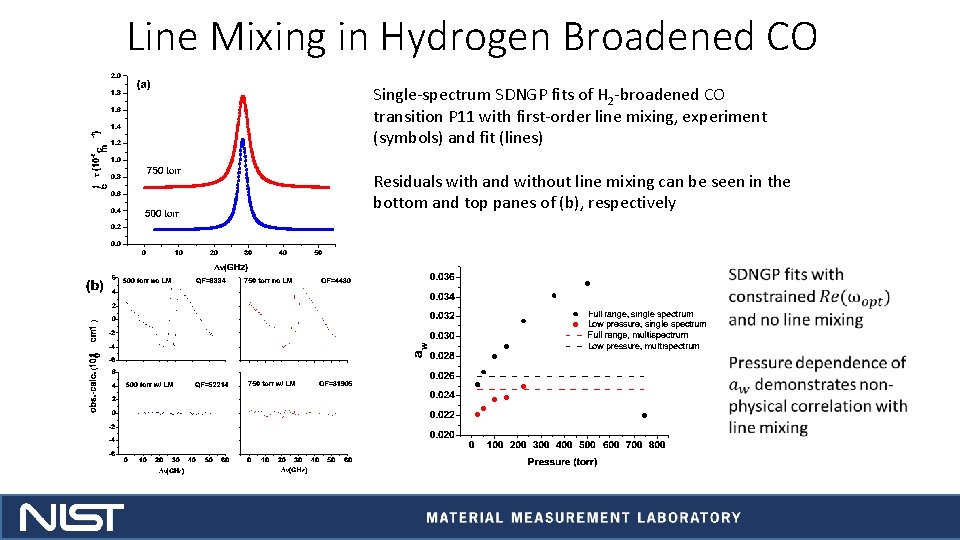
Line Mixing in Hydrogen Broadened CO Single-spectrum SDNGP fits of H 2 -broadened CO transition P 11 with first-order line mixing, experiment (symbols) and fit (lines) Residuals with and without line mixing can be seen in the bottom and top panes of (b), respectively 17
Conclusions and Future Work 18
- Slides: 18