You simply need to know what do Next

. ”")


 was originated by Oliver Wight more than twenty-five")


 Planning Transportation Planning & Execution Consensus Forecast Updated")


 Production Plan Adherence (%) Inventory – Days of")


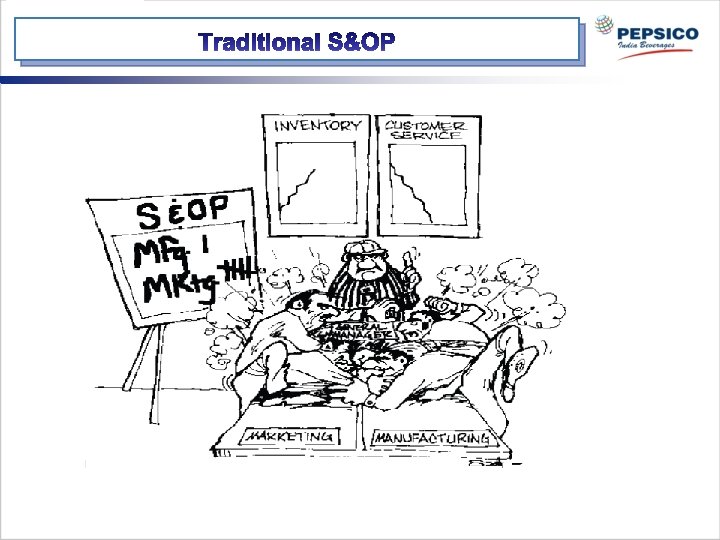
 • Supply-Centric • Internally Focused • Vertically Integrated")


 cutting")
- Slides: 35
You simply need to know what do (Next). ”
§ A formal process, consisting of series of meetings, where data from various areas of business is discussed and decisions are made. § The goal is agreement between various departments on the best course of action to achieve the optimal balance between supply and demand to meet profitability goals.
§ Brown-Forman Corporation believes its approach to S&OP is a better way to align supply and demand with the company’s business requirements, build better internal communications, and plan activities to meet customers’ needs. § Exxon. Mobil Chemical leverages sales and operations planning to improve customer service while controlling costs. § Procter & Gamble credits own version of S&OP with creating a single set of sales and supply plans to optimize resources to support the company’s business objectives – assessing the financial implications of the plan as well as its impact on both supply and demand.
§ Sales and Operations Planning (S&OP) was originated by Oliver Wight more than twenty-five years ago
Customers are demanding: Increasing business risks of : Accurate and timely commitments Shorter lead times Flexibility Product differentiation Dedicated inventory Visibility into the supply chain High quality Automation Lowest costs Too much inventory Inventory in the wrong place Ordering the wrong inventory Missing delivery dates Losing orders Shipping the wrong products Increased expediting costs Losing customers Increased obsolescence Forcing businesses to better manage: Inventories Ability to promise Global suppliers Supply/Demand Forecasts Cycle time Stocking policies VMI/SMI processes Replenishment
Over 400 skus, 15 brands & 19 pack size Brand Promotion Activities Limited time offer product launch Frequent Pack & MRP Play Location wise MRP variance
Consumers 400+
RSA Data Industry Trends RM Availability Line Capacity Growth Expectations Regional /Geographical Targets Annual/ Quarter Management Annual growth Targets Channel Demand Direct Route Targets Indirect/ Distributor Targets Float Glass Capacity Distribution Cost Trade Promo Trade Scheme Catchment Cost Retail Channel: IC/FC etc CONSUMER ATL Campaign Store Location New Launches Competition Consumer Promo Weekly/ Bi weekly seasonality Weekly/ Fortnightly Consumer Demand ASM Targets Shut down Monthly/ Weekly Primary / Secondary Demand State/City Targets
Manufacturing Planning & Scheduling Distribution (Deployment) Planning Transportation Planning & Execution Consensus Forecast Updated Forecast Netting Inventory Planning Netted forecast Master Planning Sourcing Rules Production Planning & Scheduling Deployment Planning Transportation Management System Secondary Shipment Consolidation Tertiary Route Planning Optimization Fleet Management SAP / Order Management Master Planning Master Data Management & Workflows Demand Planning Statistical Forecast
§ Absence of Scientific Demand Management Process î î Under/over estimations Target v/s Actual Sales Tracking Customer Service levels Difficult growth and revenue performance measurement § Non-Synchronized Supply and Logistics Planning î î î Fill Rate Management Challenge especially during Seasons Costly Product-Mix Decisions Capacity Under/Over Utilization Inter-Warehouse Movements Premium Freights at times FG Inventory mismatches with Norms
Its all about collaboration
§ To develop a cross-departmental consensus business plan that is achievable, given the business aspirations and constraints, and ensures that every function and sub-function within the business is working to achieve the same goal. § Leading companies do this most effectively by involving as many areas of the business as is practical.
Sales Forecast Adjustment Baseline Forecasting Demand Review Meeting Directors Operations Planning Pre S&OP Meeting Executives S&OP Meeting Sales Forecast Adjustment Performance Management Forecasting Team Sales Department Marketing Department S&OP Manager Operations Department
Absence of teamwork & shared risk management among internal functions Supply interruption, leading to production delays, on time delivery issues, lower profits and /or customer loss Excessive in hand inventories and obsolescence Lack of confidence in planning system Material / Product shortages increased expediting $ Unacceptable lead time To manage Ineffective bottleneck and constraints management on the supply side Ineffective utilization of resources, and / or lack of resources when needed Poor collaboration among stake holders – internal or external (finger pointing
Poor coordination of demand supply: lost sales: Incorrect Inventories: Loss/ lower profitability Breakdown in communication due to the lack of quality and availability of data Leadership support in getting agreement on S&OP plans Lack or no technology/ systems to do the “what if” modeling and gaining agreement Challenges Lack of right metrics to drive value or to determine same Lack of coordination of multisite/ cultural teams Limitation of the processes to manage new product development, innovation and /or feasibility Internal business processes does not facilitate delivery of right – product/price/ qty/ qlty, at the right time, to the right customer Lack of integration with the financial budgeting process
Business or annual plan Operations strategy Sales and Operation Plan Forecasting Sales Plan • • Resource Planning (services) Workforce schedule Material and facility resources • • • Scheduling Employee schedule Facility schedules Customer schedules Operations Plan Constraint Management Resource Planning (manufacturing) • Master production schedule • Material requirements planning • • • Scheduling Employee & equipment schedules Production order schedules Purchase order schedules
Review done as part of an Integrated Business Management Process Clearly identifies the product domain in which the company competes through Product Management Ensures that the Supply & Demand are reconciled & evaluated against financial targets in the management Review Align all stakeholders towards meeting customer demand/ profitability & ensure delivery of the company’s strategic agenda Formalizes the generation and adoption of a company demand plan through the demand review Reasons Delivers one clear plan that answers all the customer demand questions that the organization faces Provides a transparent view of the company’s response from demand through to the supply review
Planning Cycle Planning Output Annually Business Plan Monthly S&OP Weekly Daily Sales Profit ROI Product Group Master Scheduling Product Models & Options Material & Service Planning Components & workload
• • • Review Revenue/ Profit Performance § What has changed since last month? Review new product development § How are we performing to performance Review manufacturing performance Review Inventory levels Review External Factors Review Future plans • Orders booked • Sales & shipment • Backlogs • Finished goods Inventory • Production • Performance measures by product Group § Are we on plan financially? metrics? § What new risk do we need to consider? § What decision do we need to made now? § What decision need to be made in the near future? § How are product families performing? § Are we on track with product development? § Do we have any critical constraints? § Is there any need to revise long term plans?
§ § § § § Current plan for each product group Current finished goods inventory Sales forecasts Purchase Orders received Materials available Manufacturing plans and capacity Distribution capacity Shipping capacity Performance measures Customer Service
§ § § Forecast error reduction…………. . 20 -25% Inventory reduction…………………. . 5 -10% Inventory turn increase……………. . 5 -10% Service Level Increase………………. . 5 -10% Top line revenue growth…………… 2 -5% SKU rationalization………… 10 -20%
§ § § Forecast Accuracy (%) Production Plan Adherence (%) Inventory – Days of Supply (DOS) Inventory Turns Financial forecast Accuracy
Benefits for Solution Benefits Sales Team Demand forecasting and management. Analysis of historical data, applies multiple models, and adds promotions and other causal factors to come out with proper demand forecast numbers. Increased forecast accuracy Increased customer service Right product mix planning in distribution centers. Better Customer Predictabilit Understanding the promotional, seasonality and other events impacts Management of Targets across all geography, product structure and sales hierarchy level
Benefits for Solution Benefits Production Team Production Planning and Optimization Arrive at the Demand driven Production Plan that is synchronized with Distribution Plan. Quick generation of robust and optimized rough cut production plan considering all capacity constraints, changeovers, campaigns, seasonal pre builds etc. Increased capacity utilization Increased productivity by better resource planning and utilization Optimized product-location mix decisions to service effective distribution Quickly review and adjust master plans to resolve any exceptions
Benefits for Solution Benefits Supply Chain Team Optimized Distribution Plan While balancing Demand-Supply dynamics arrive at distribution and dispatch plan that optimizes the logistics costs and various service level constraint. Most optimal distribution plan Lower logistics service costs Maintaining service levels and dispatch priorities Increased OTIF(on time in full) and decreased Inventory Improved overall fleet capacity and overall asset utilization Optimized product-location mix dispatch decisions to service effective distribution Decreased costs of premium freights, cross depot movements, obsolesces, handling etc
Benefits for Solution Benefits Management Exception Management Enablement of Human Independent Planning System that provides the complete visibility on company performance against customer demands with graphical and enriched presentation Provide end to end supply chain performance visibility and levers to control the plans by exceptions Smart workflow that spots the untolerable exceptions within existing plans and provides easy and user-friendly resolution that balances the conflicts and lead to consensus plans Provides KPI Measurements and analysis views on various supply chain performance aspects like OTIF, Production Compliance, Service Costs, Inventory Days, Asset Utilization, PCR Accuracy etc.
Old Model: Push (Linear Supply Chain) • Supply-Centric • Internally Focused • Vertically Integrated • Physical Asset Based • Mass Momentum New Model: Pull (Integrated Networks) ü Demand-Driven Automation Information ü Global ü Virtual Supply Chains ü Decision Based ü Lean Practices
Supply Demand Planning Demand Supply Planning • Access last period • Access SC Capabilities • • Incorporate sales against Forecast • and customer inputs • Develop feasible supply • • Build new baseline Plan demand plan • Develop P&L projections • compare projections against targets End of Month Week 1 Week 2 Pre-S&OP Meeting Executive Meeting Identify gaps • Review Gap conflict resolution recommendations & Recommendations and make decisions Agenda for executive • Resolve remaining meeting issues • Review KPI’s • Review PLM plans • Issue consensus plan Week 3 Week 4
S&OP process- M 0/M 01 Mid month review process Area Position / Dept BU DP 1 st – 8 th BU SCM BU Supply Planning I 2 RCCP run Inputs to statistical forecast MU DP Discuss, if needed Clarify, if needed Check current month sales vs forecast, discuss with Ums, revise for the P 3/P 4 Generate statistical forecast Discuss with MUMMs / MDMs, clarify with BU-M and BU-S, if needed Send latest foreca st to TDMs Discuss forecast received from TDMs with UMs TDMs / BDMs Send final forecast to all, generate RCCP in i 2 MRP plan Discuss forecast Demand / Supply review and approval MU pre. S&OP and S&OP Analyze forecast MUGM Units Send for MUGM’s approval MU SCM Plants / operations MUMMs / MDMs 24 th to End Analyze forecast for exceptions, discuss with BU -M if needed Discuss, if needed Po. C meeting BU BU Marketing Mrktng / (BMs, ABMs) BU BU Sales OTSales MU Discuss with BUM and send to MU DPs 16 th to 23 rd National S&OP Collate forecast and send to BU-M 9 th to 15 th Only info given, discussion only if needed Approve forecast Discuss, if needed Discuss forecast Validate forecast, give inputs Page 33
îNo longer Victim mentality, use visibility as strategic weapon. îIntegrated Supply Chain (ISC) cutting across traditional job description, Data sharing within company and breaking of silos. îCentralized MIS, Collaborative S&OP process, one version of truth. îIncorporate inputs from all aspects of supply chain including finance, sales, marketing, purchasing, forecasting and supplier management. îHarmonize incentives and avoid independent incentives. îCan result in reduction of inventory/ obsolete inventory, backlogs, expedited shipments and improved forecast accuracy. îMore control on product life cycle. îProcess instrumentation