ynet 22 5 2014 Number of IVF treatments


ynet, 22. 5. 2014


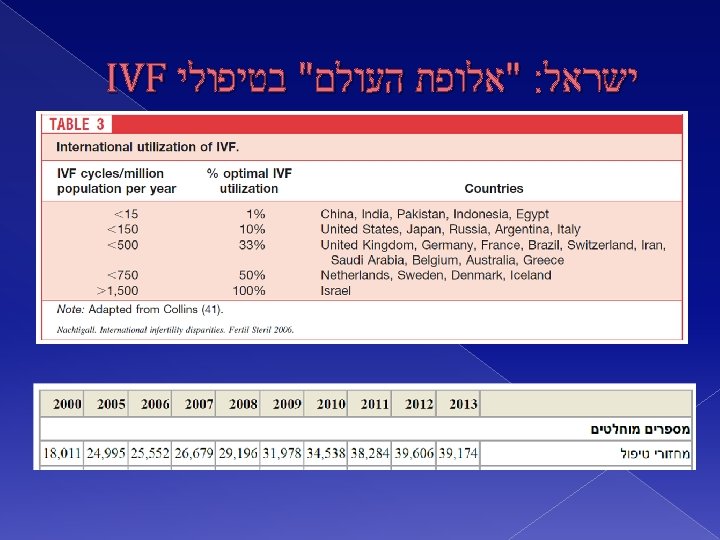
Number of IVF treatments performed, number of live births achieved from these treatments, and success rate by year. * CI=confidence interval. Year Number of treatments Number of live births Success rate [%] 95% CI* 2007 6, 242 1, 182 18. 9 18. 0 - 19. 9 2008 7, 041 1, 295 18. 4 17. 5 - 19. 3 2009 8, 336 1, 356 16. 3 15. 5 - 17. 1 2010 9, 297 1, 384 14. 9 14. 2 - 15. 6 2011 9, 751 1, 429 14. 7 14. 0 - 15. 4 2012 9, 314 1, 438 15. 4 14. 7 - 16. 2 2013 8, 455 1, 386 16. 4 15. 6 - 17. 2 2014 8, 623 1, 238 14. 4 13. 6 - 15. 1 Total 67, 059 10, 708 16. 0 15. 7 - 16. 2

Mean age of IVF patients, by year Year Mean age Number of treatments 2007 35. 13 6, 242 2008 35. 51 7, 041 2009 35. 94 8, 336 2010 36. 23 9, 297 2011 36. 24 9, 751 2012 36. 65 9, 314 2013 36. 77 8, 455 2014 37. 06 8, 623 Total 36. 25 67, 059

Number of IVF treatments and success rates for women ≥ 40 year old age group, by year and age Year Age Number of treatments Number of live births Success rate [%] 95% CI 2011 Total 40 41 42 43 44 3, 204 660 736 716 555 537 168 68 38 31 21 10 5. 2 10. 3 5. 2 4. 3 3. 8 1. 9 4. 5 8. 0 3. 6 2. 8 2. 2 0. 7 - 6. 0 12. 6 6. 8 5. 4 3. 0 2014 Total 3, 648 217 5. 9 5. 2 - 6. 7 40 781 77 9. 9 7. 8 - 11. 9 41 855 59 6. 9 5. 2 - 8. 6 42 759 43 5. 7 4. 0 - 7. 3 43 702 28 4. 0 2. 5 - 5. 4 44 551 10 1. 8 0. 7 - 2. 9

Number of IVF treatments and success rate, by year and medical center (only medical centers with ≥ 100 cycles per given year were included) Year 2011 Medical center* Total A B C D E F G H I J K Number of treatments 9, 751 914 561 673 1, 958 3, 908 223 120 307 161 303 170 Number of live births 1, 429 93 40 114 387 502 49 24 48 40 18 37 Success [%] 14. 7 10. 2 7. 1 16. 9 19. 8 12. 8 22. 0 20. 0 15. 6 24. 8 5. 9 21. 8 95% CI 14. 0 8. 2 5. 0 14. 1 18. 0 11. 8 16. 5 12. 8 11. 6 18. 2 3. 3 15. 6 - 15. 4 12. 1 9. 3 19. 8 21. 5 13. 9 27. 4 27. 2 19. 7 31. 5 8. 6 28. 0

Number of IVF treatments and success rate, by year and medical center (only medical centers with ≥ 100 cycles per given year were included) 2014 Total 8, 623 1, 238 14. 4 13. 6 - 15. 1 A 1, 136 176 15. 5 13. 4 - 17. 6 B 268 27 10. 1 6. 5 - 13. 7 C 459 75 16. 3 13. 0 - 19. 7 D 1, 957 352 18. 0 16. 3 - 19. 7 E 2, 877 347 12. 1 10. 9 - 13. 3 F 187 37 19. 8 14. 1 - 25. 5 G 115 18 15. 7 9. 0 - 22. 3 H 195 26 13. 3 8. 6 - 18. 1 I 178 36 20. 2 14. 3 - 26. 1 J 312 39 12. 5 8. 8 - 16. 2 K 262 26 9. 9 6. 3 - 13. 5 L 188 33 17. 6 12. 1 - 23. 0

IVF Treatments distribution between public and private medical centers, by year for 2007 -2014 14 000 12 000 Treatments (n) 10 000 8 000 6 000 4 000 2 000 0 2007 2008 2009 2010 Year Private 2011 2012 2013 2014 Public . " ב"פרטי 56% לעומת עליה של , " ב"צבורי 9% השנים הייתה עליה של 8 – ב


- Slides: 16