
Xrays from Young Massive Stars David Cohen Swarthmore
- Slides: 70
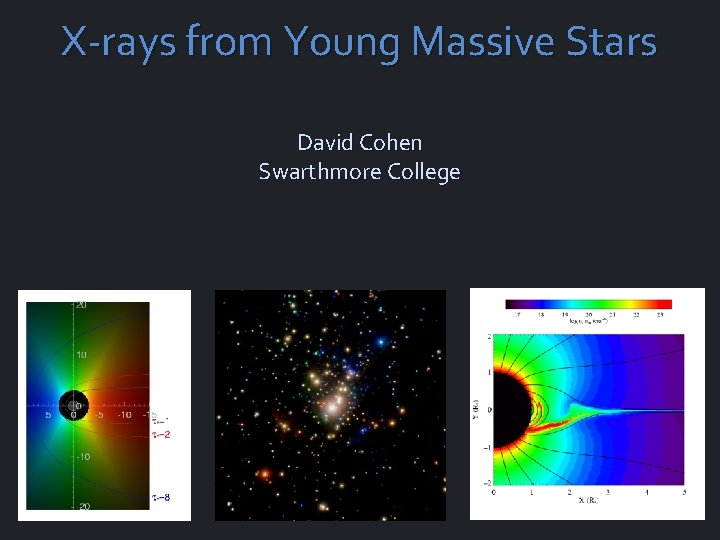
X-rays from Young Massive Stars David Cohen Swarthmore College
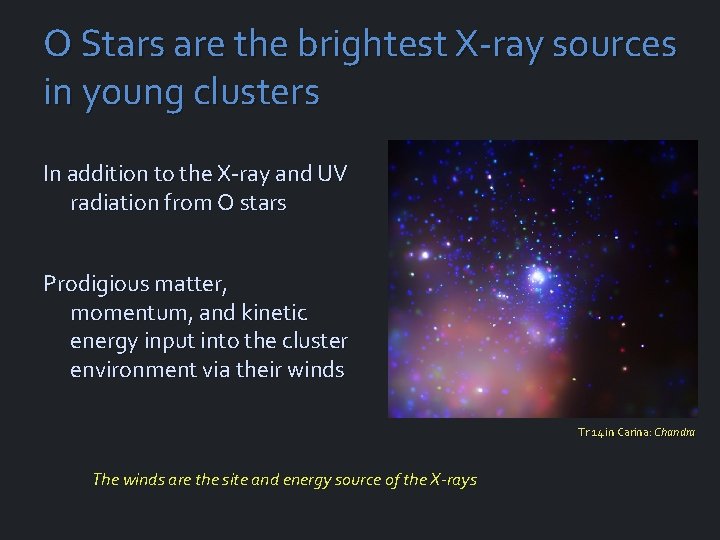
O Stars are the brightest X-ray sources in young clusters In addition to the X-ray and UV radiation from O stars Prodigious matter, momentum, and kinetic energy input into the cluster environment via their winds Tr 14 in Carina: Chandra The winds are the site and energy source of the X-rays
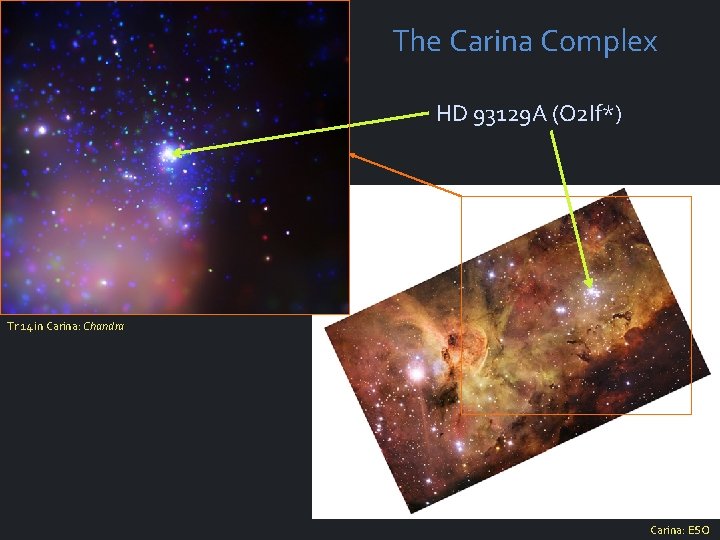
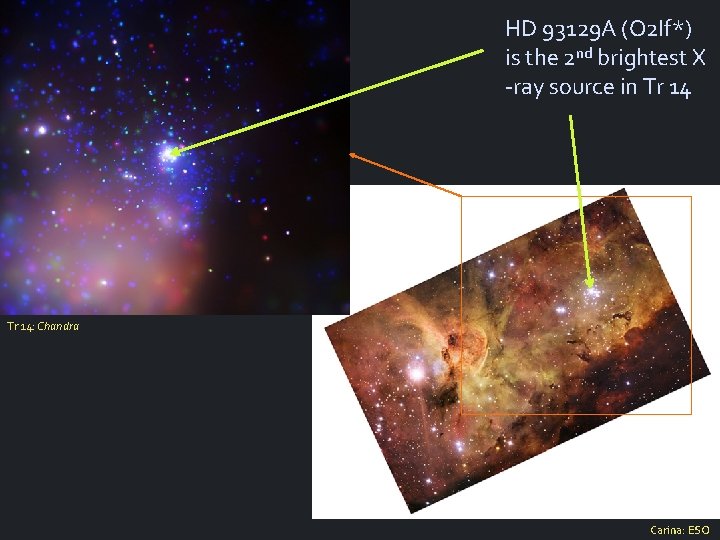
The Carina Complex HD 93129 A (O 2 If*) Tr 14 in Carina: Chandra Carina: ESO
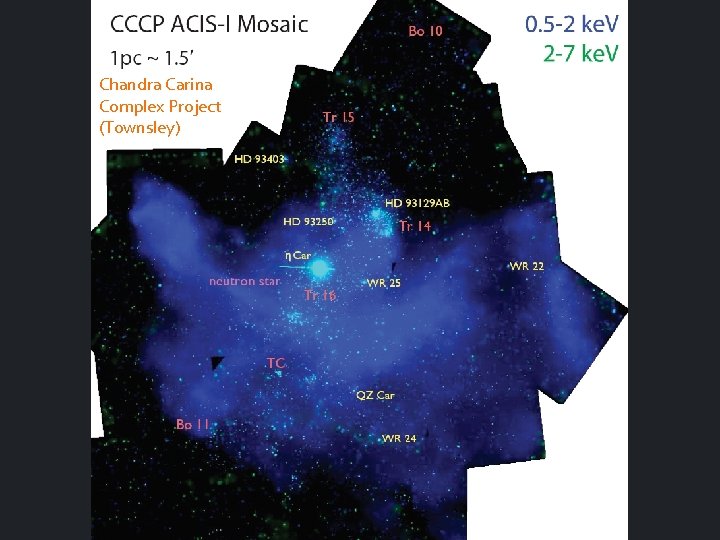
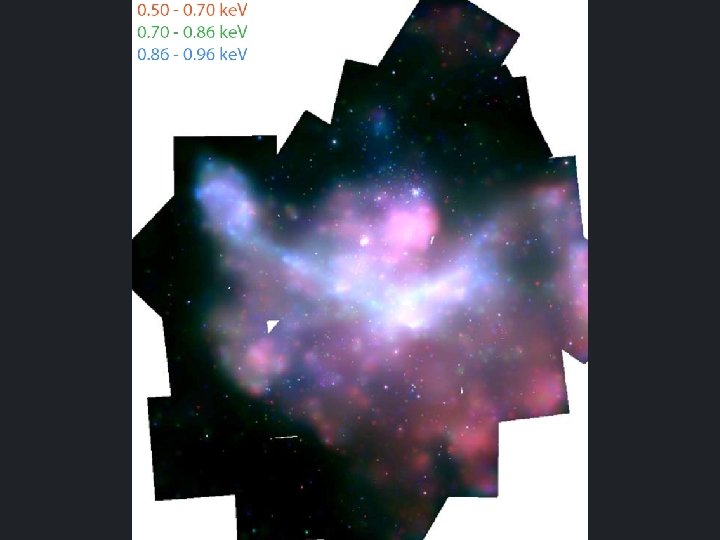
Chandra Carina Complex Project (Townsley)
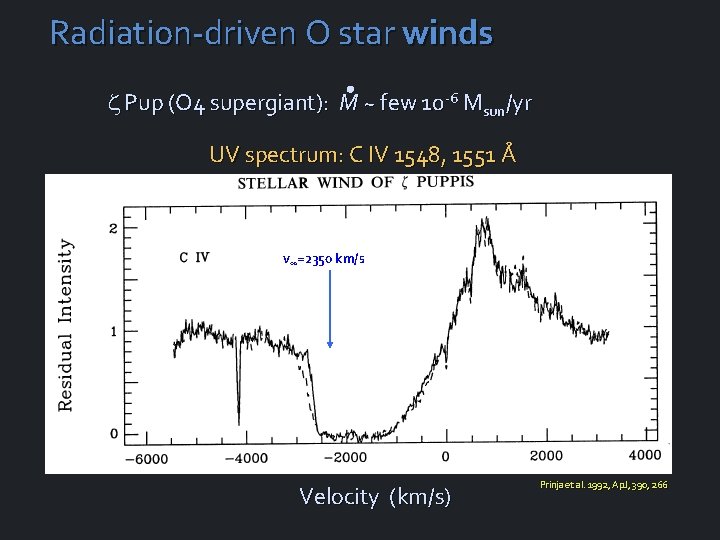
Radiation-driven O star winds Pup (O 4 supergiant): M ~ few 10 -6 Msun/yr UV spectrum: C IV 1548, 1551 Å v∞=2350 km/s Velocity (km/s) Prinja et al. 1992, Ap. J, 390, 266
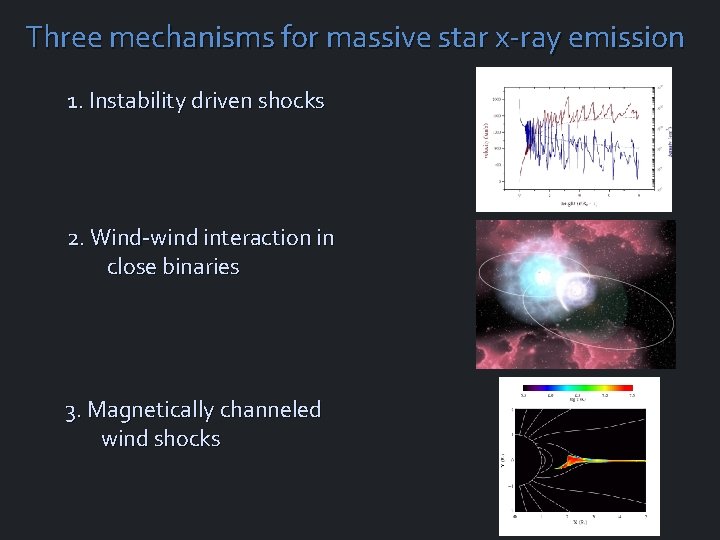
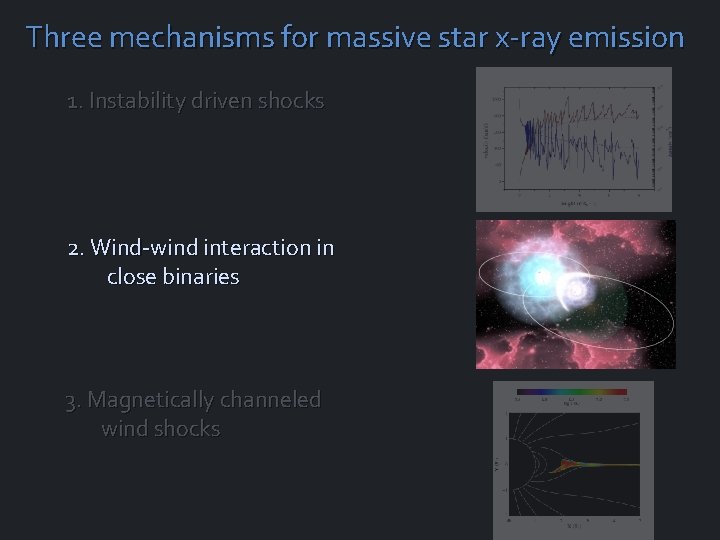
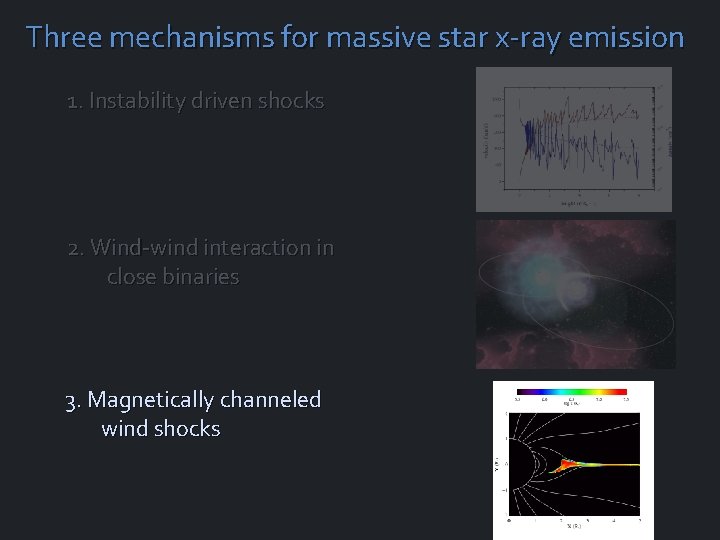
Three mechanisms for massive star x-ray emission 1. Instability driven shocks 2. Wind-wind interaction in close binaries 3. Magnetically channeled wind shocks
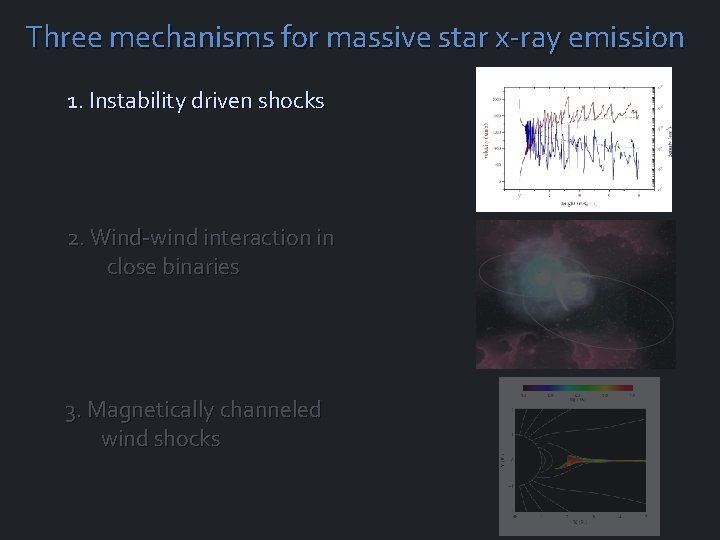
Three mechanisms for massive star x-ray emission 1. Instability driven shocks 2. Wind-wind interaction in close binaries 3. Magnetically channeled wind shocks
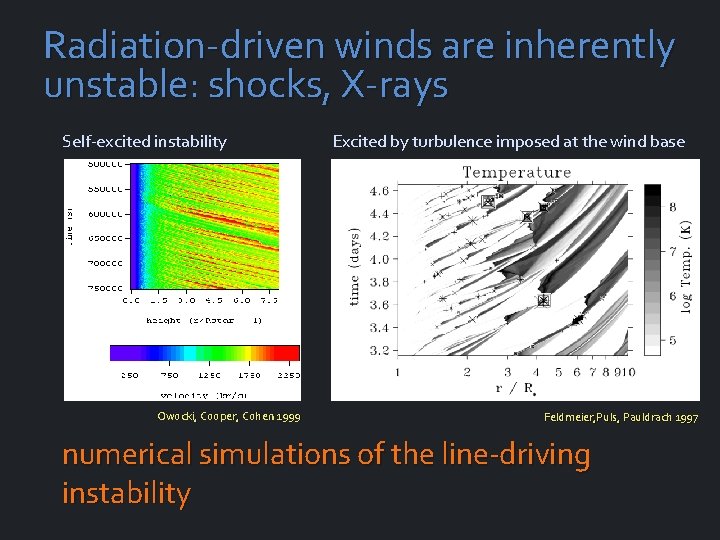
Radiation-driven winds are inherently unstable: shocks, X-rays Self-excited instability Owocki, Cooper, Cohen 1999 Excited by turbulence imposed at the wind base Feldmeier, Puls, Pauldrach 1997 numerical simulations of the line-driving instability
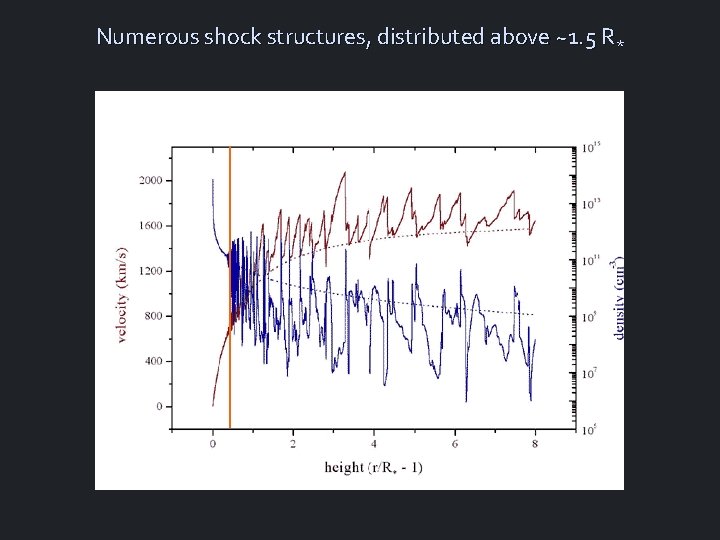
Numerous shock structures, distributed above ~1. 5 R*
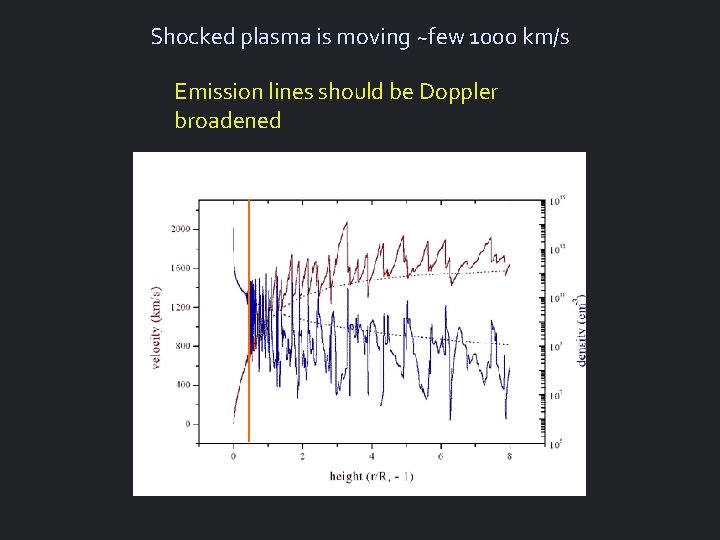
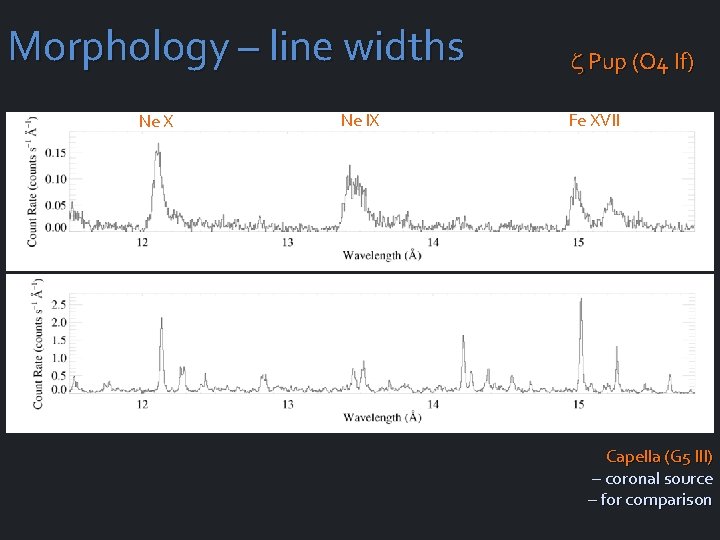
Shocked plasma is moving ~few 1000 km/s Emission lines should be Doppler broadened
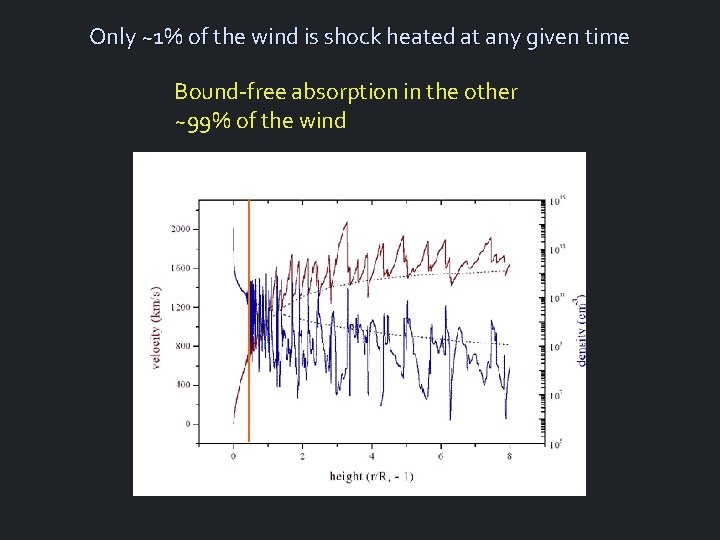
Only ~1% of the wind is shock heated at any given time Bound-free absorption in the other ~99% of the wind
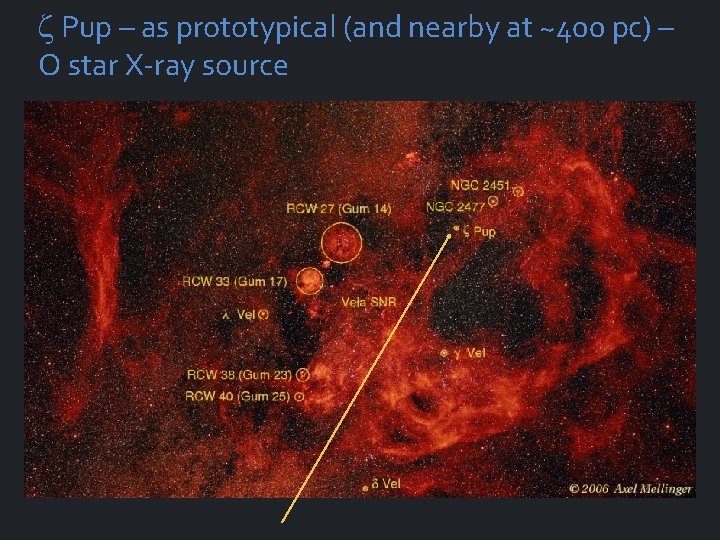
Pup – as prototypical (and nearby at ~400 pc) – O star X-ray source
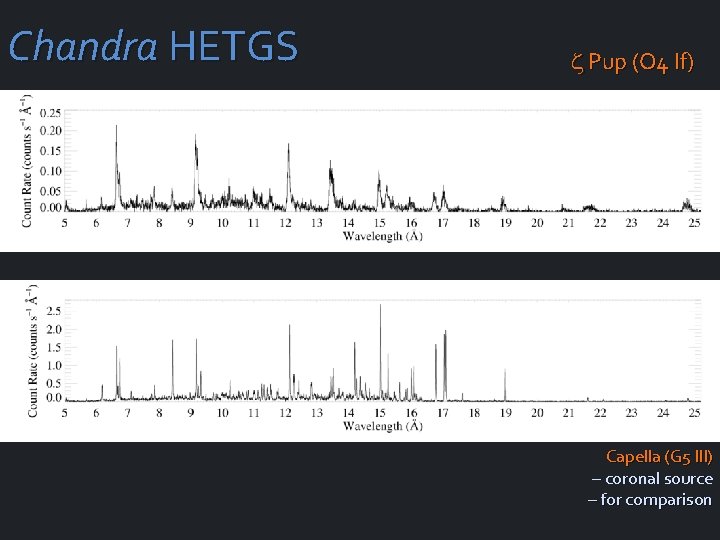
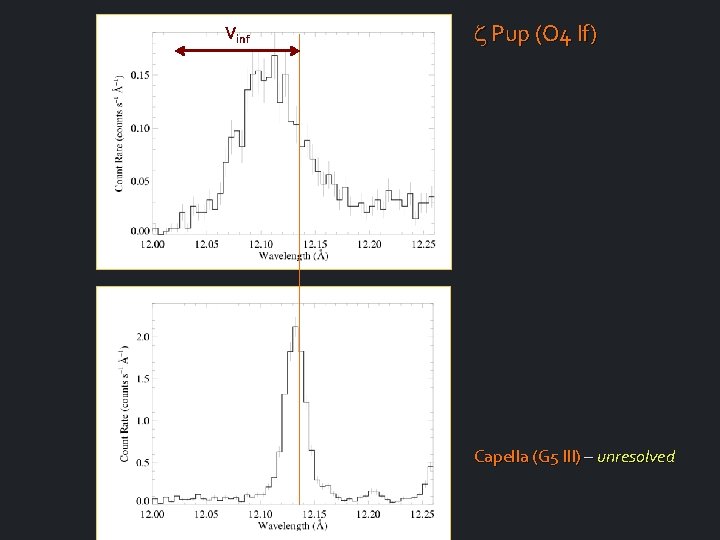
Chandra HETGS Pup (O 4 If) Capella (G 5 III) – coronal source – for comparison
Morphology – line widths Ne X Ne IX Pup (O 4 If) Fe XVII Capella (G 5 III) – coronal source – for comparison
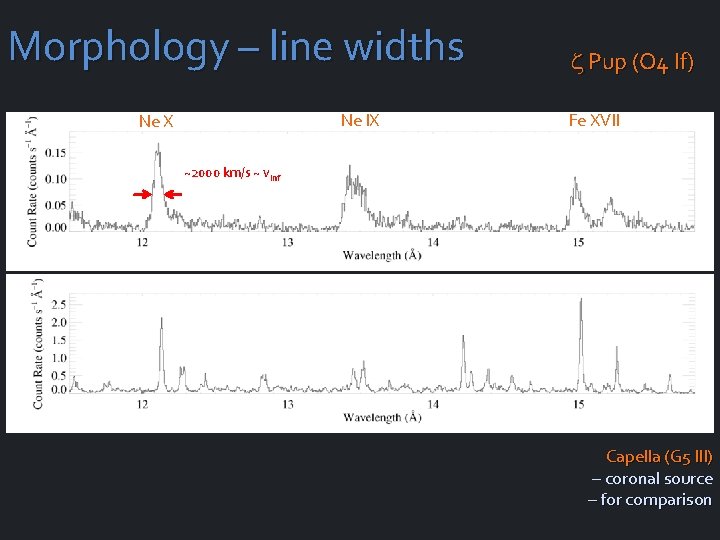
Morphology – line widths Ne IX Ne X Pup (O 4 If) Fe XVII ~2000 km/s ~ vinf Capella (G 5 III) – coronal source – for comparison
Vinf Pup (O 4 If) Capella (G 5 III) – unresolved
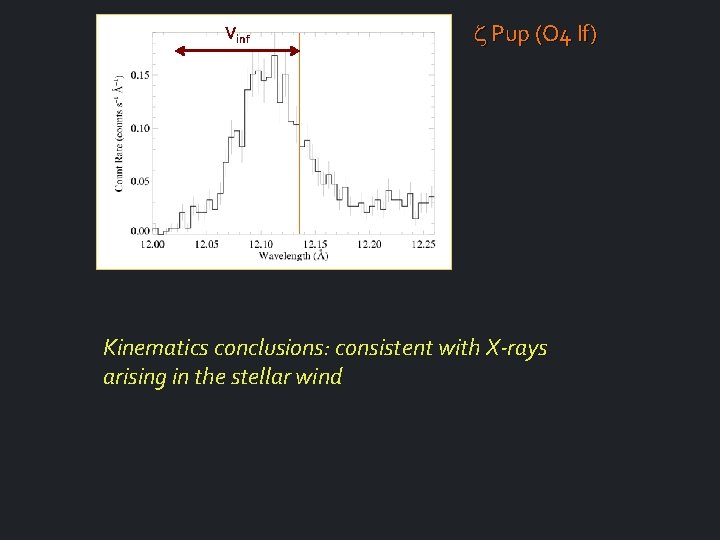
Vinf Pup (O 4 If) Kinematics conclusions: consistent with X-rays arising in the stellar wind
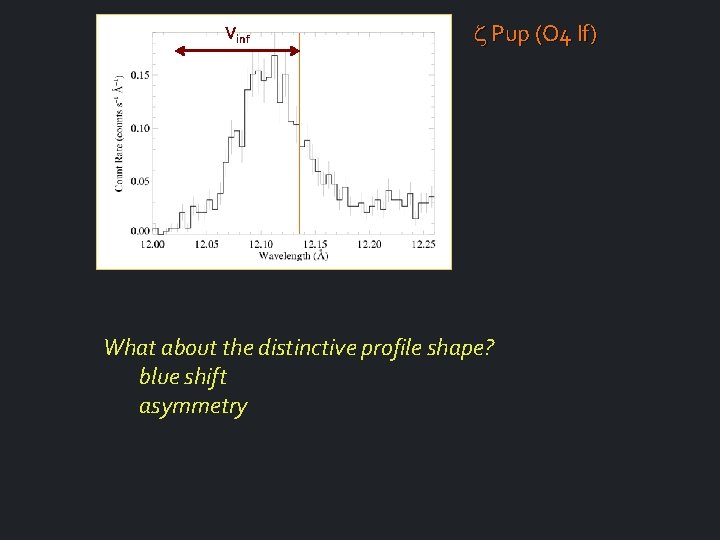
Vinf Pup (O 4 If) What about the distinctive profile shape? blue shift asymmetry
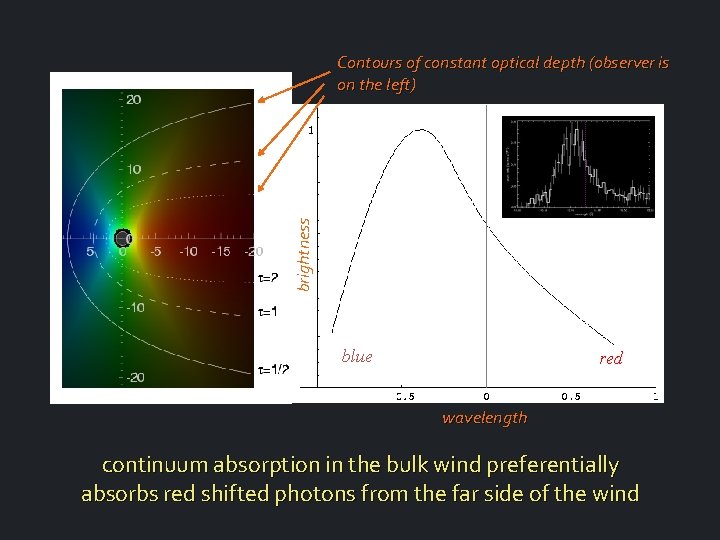
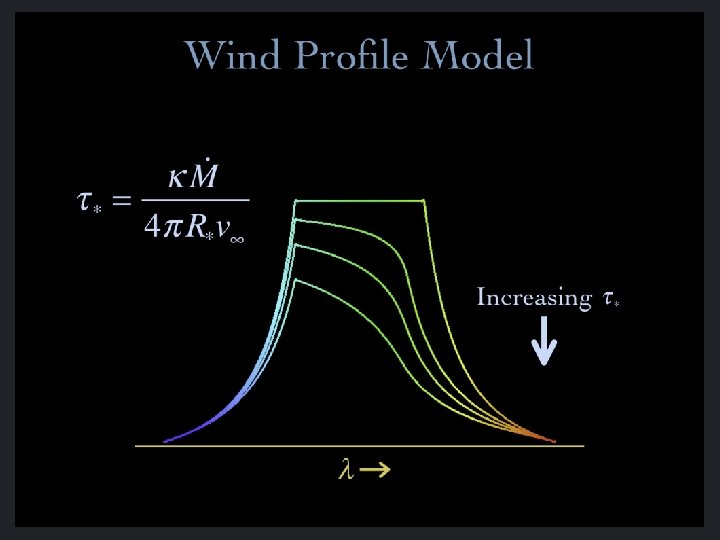
brightness Contours of constant optical depth (observer is on the left) blue red wavelength continuum absorption in the bulk wind preferentially absorbs red shifted photons from the far side of the wind
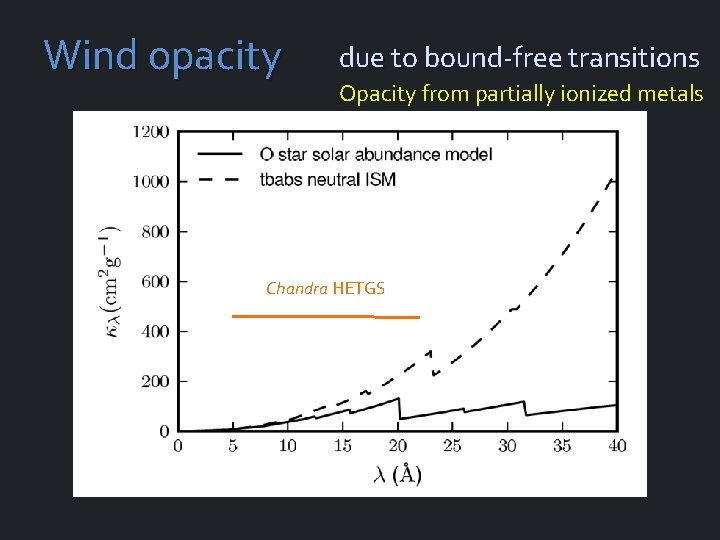
Wind opacity due to bound-free transitions Opacity from partially ionized metals Chandra HETGS
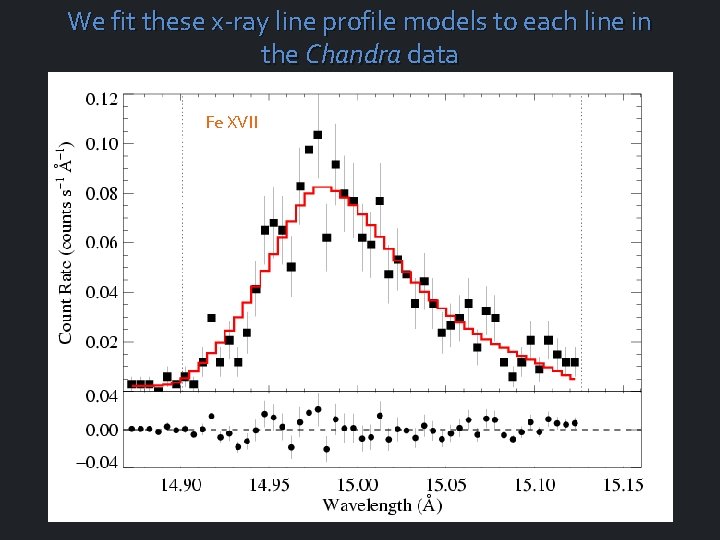
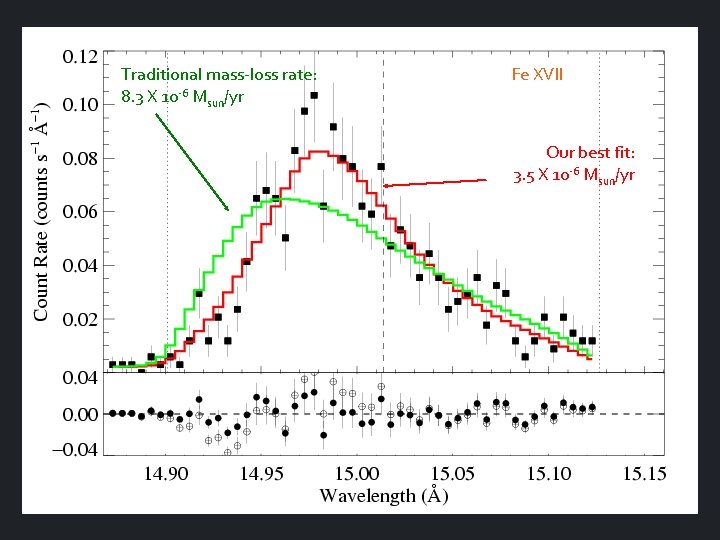
We fit these x-ray line profile models to each line in the Chandra data Fe XVII
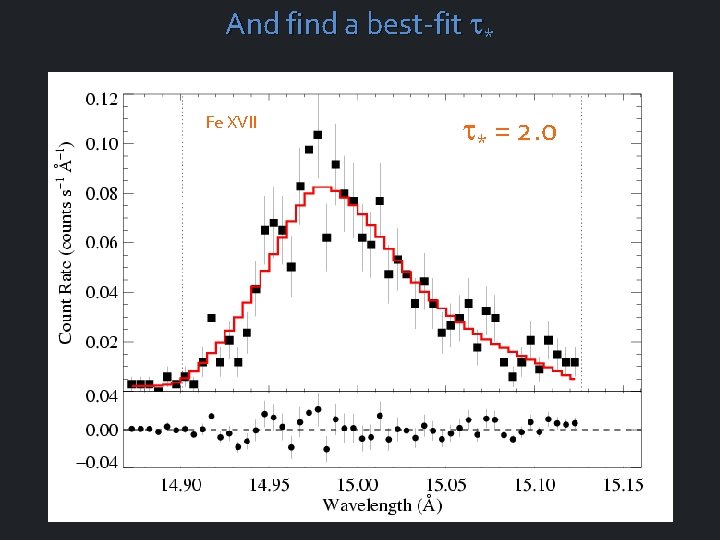
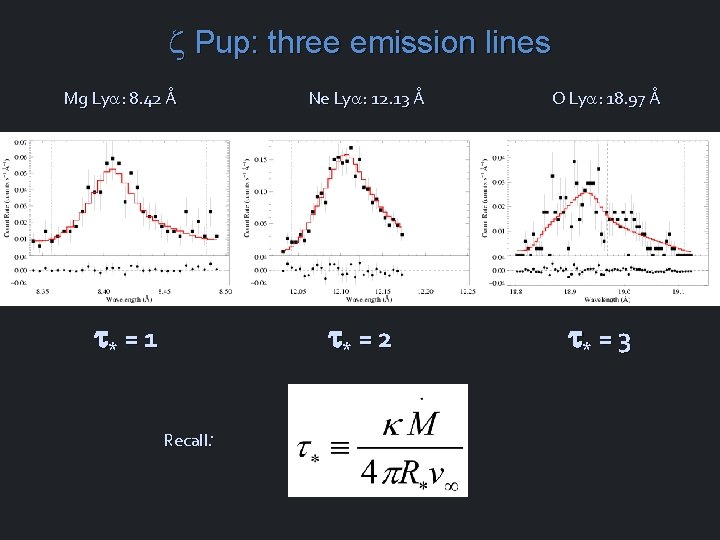
And find a best-fit t* Fe XVII t* = 2. 0
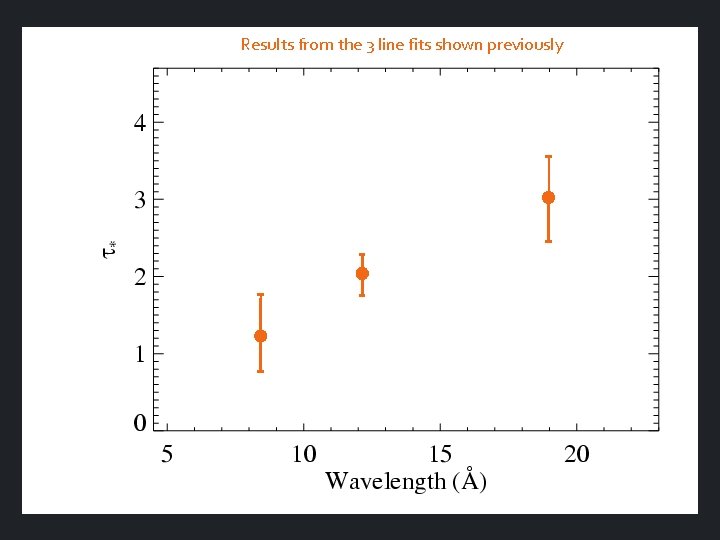
Pup: three emission lines Mg Lya: 8. 42 Å t* = 1 Ne Lya: 12. 13 Å t* = 2 Recall: O Lya: 18. 97 Å t* = 3
Results from the 3 line fits shown previously
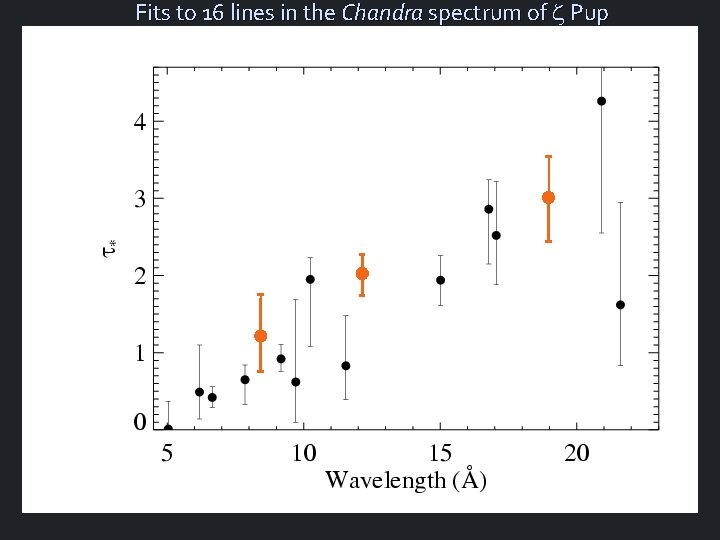
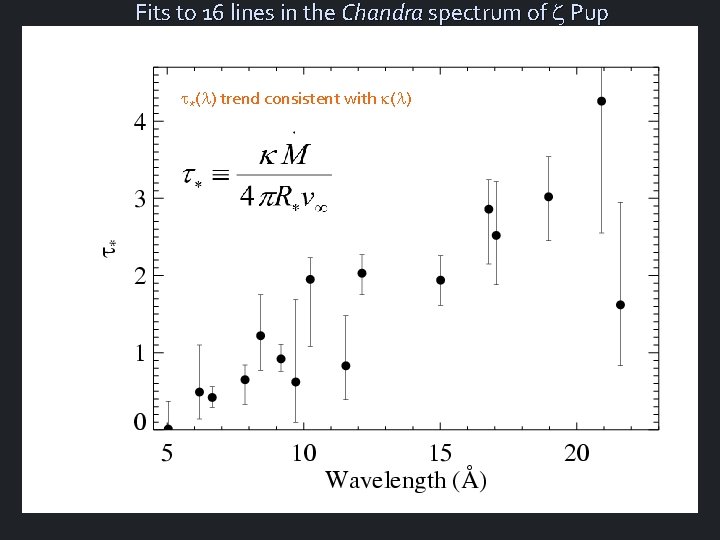
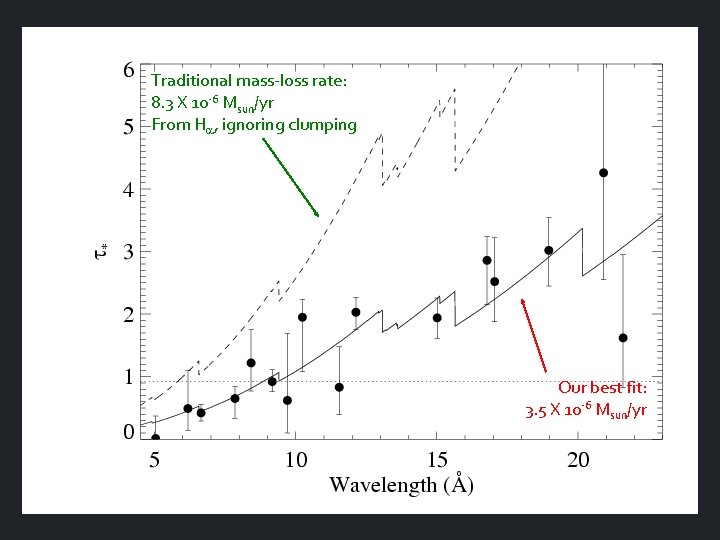
Fits to 16 lines in the Chandra spectrum of Pup
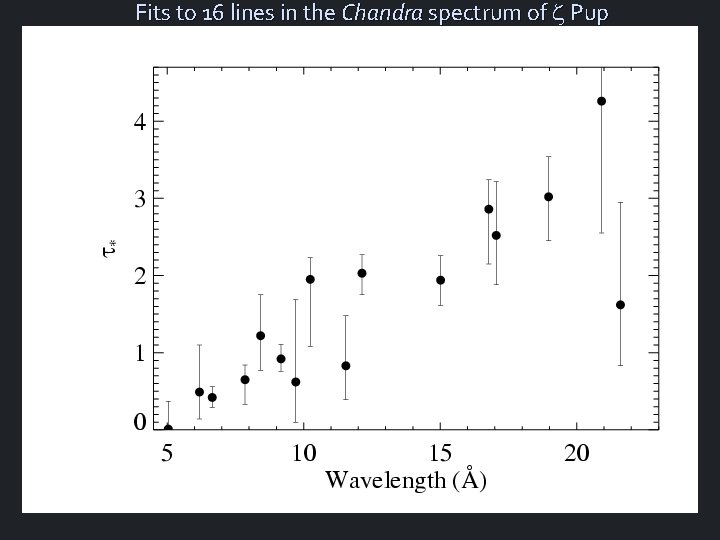
Fits to 16 lines in the Chandra spectrum of Pup
Fits to 16 lines in the Chandra spectrum of Pup t*(l) trend consistent with k(l)
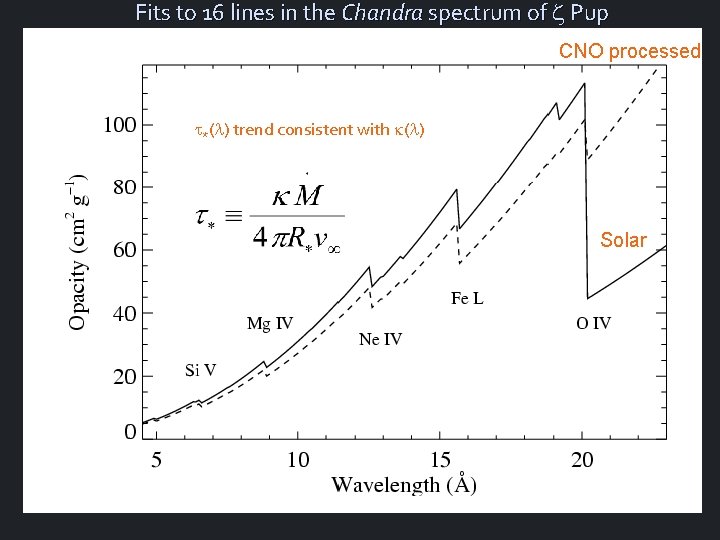
Fits to 16 lines in the Chandra spectrum of Pup CNO processed t*(l) trend consistent with k(l) Solar
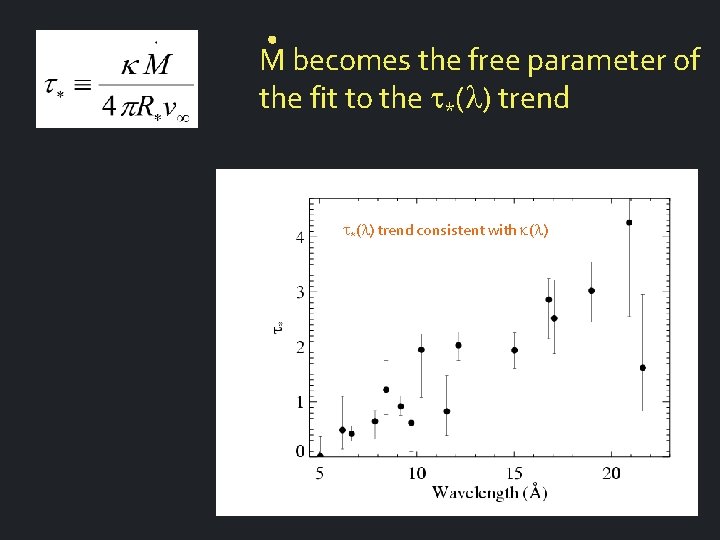
M becomes the free parameter of the fit to the t*(l) trend consistent with k(l)
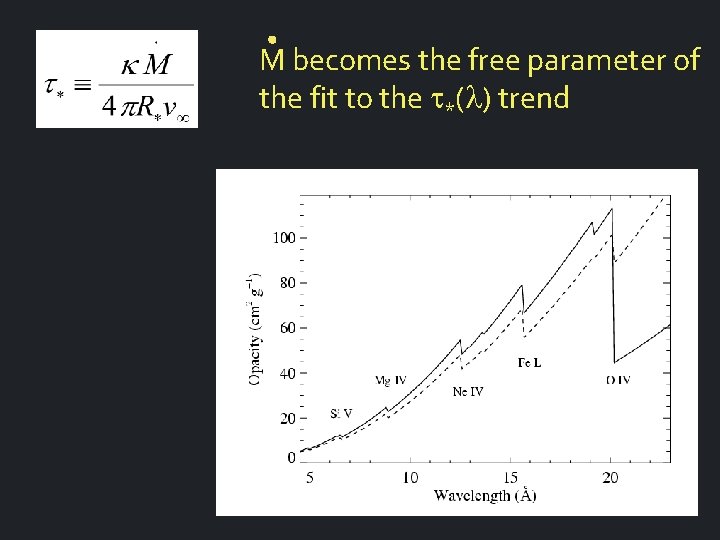
M becomes the free parameter of the fit to the t*(l) trend consistent with k(l)
Traditional mass-loss rate: 8. 3 X 10 -6 Msun/yr From Ha, ignoring clumping Our best fit: 3. 5 X 10 -6 Msun/yr
Traditional mass-loss rate: 8. 3 X 10 -6 Msun/yr Fe XVII Our best fit: 3. 5 X 10 -6 Msun/yr
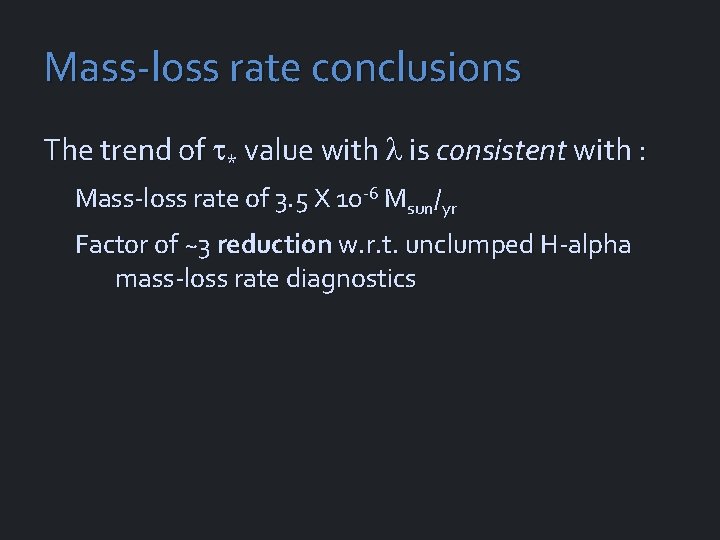
Mass-loss rate conclusions The trend of t* value with l is consistent with : Mass-loss rate of 3. 5 X 10 -6 Msun/yr Factor of ~3 reduction w. r. t. unclumped H-alpha mass-loss rate diagnostics
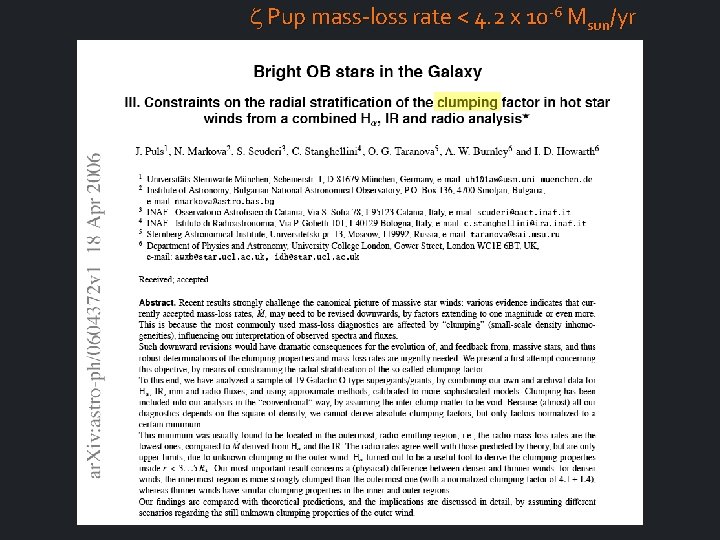
Pup mass-loss rate < 4. 2 x 10 -6 Msun/yr
Three mechanisms for massive star x-ray emission 1. Instability driven shocks 2. Wind-wind interaction in close binaries 3. Magnetically channeled wind shocks
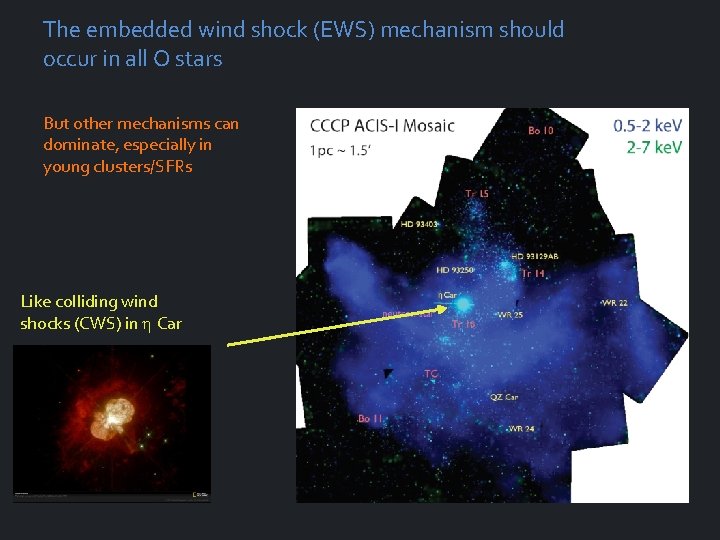
The embedded wind shock (EWS) mechanism should occur in all O stars But other mechanisms can dominate, especially in young clusters/SFRs Like colliding wind shocks (CWS) in h Car
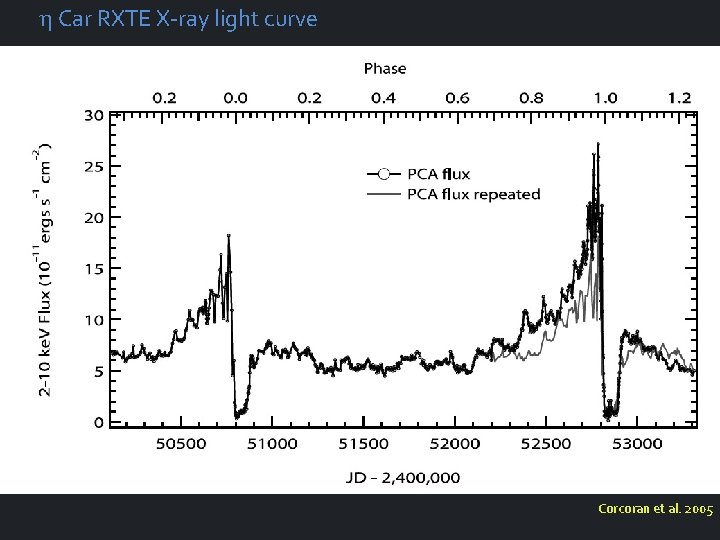
h Car RXTE X-ray light curve Corcoran et al. 2005
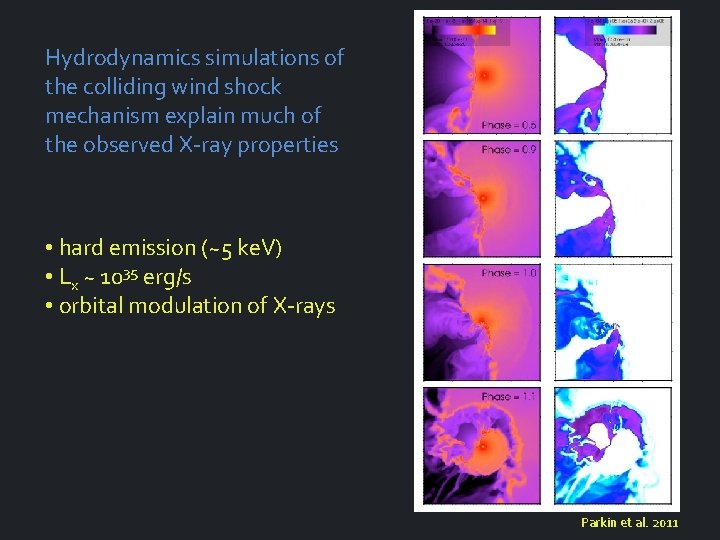
Hydrodynamics simulations of the colliding wind shock mechanism explain much of the observed X-ray properties • hard emission (~5 ke. V) • Lx ~ 1035 erg/s • orbital modulation of X-rays Parkin et al. 2011
HD 93129 A (O 2 If*) is the 2 nd brightest X -ray source in Tr 14: Chandra Carina: ESO
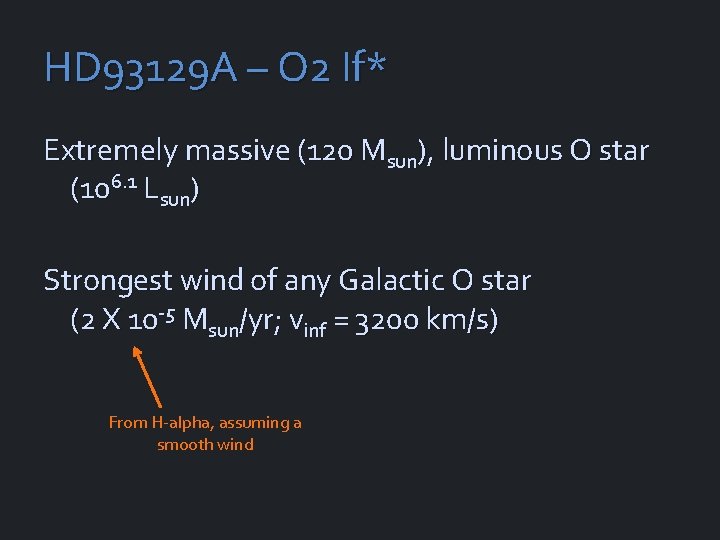
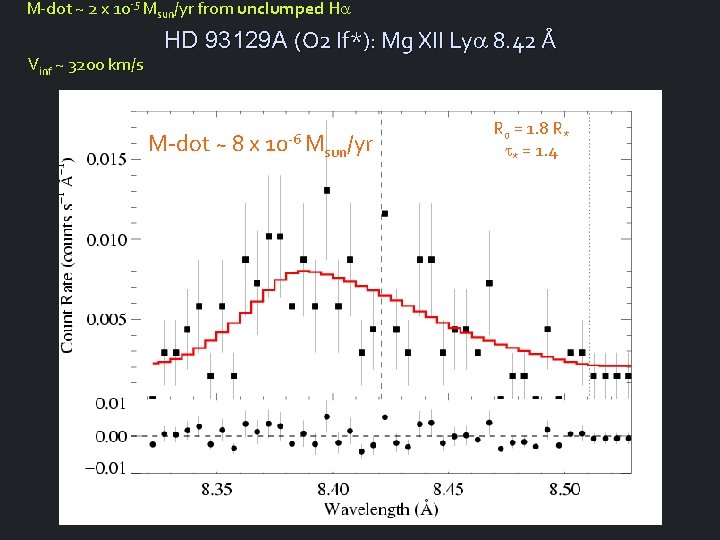
HD 93129 A – O 2 If* Extremely massive (120 Msun), luminous O star (106. 1 Lsun) Strongest wind of any Galactic O star (2 X 10 -5 Msun/yr; vinf = 3200 km/s) From H-alpha, assuming a smooth wind
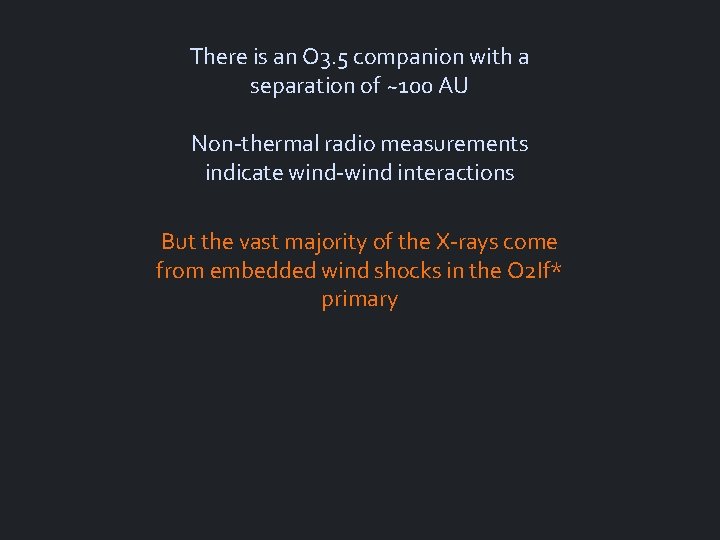
There is an O 3. 5 companion with a separation of ~100 AU Non-thermal radio measurements indicate wind-wind interactions But the vast majority of the X-rays come from embedded wind shocks in the O 2 If* primary
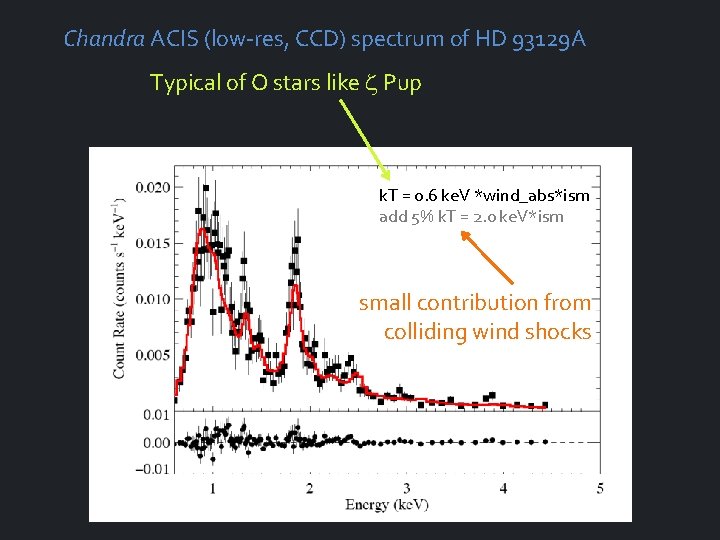
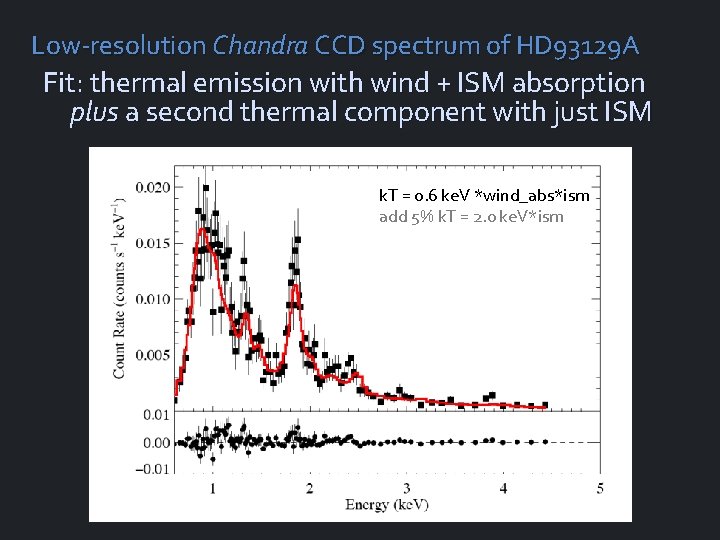
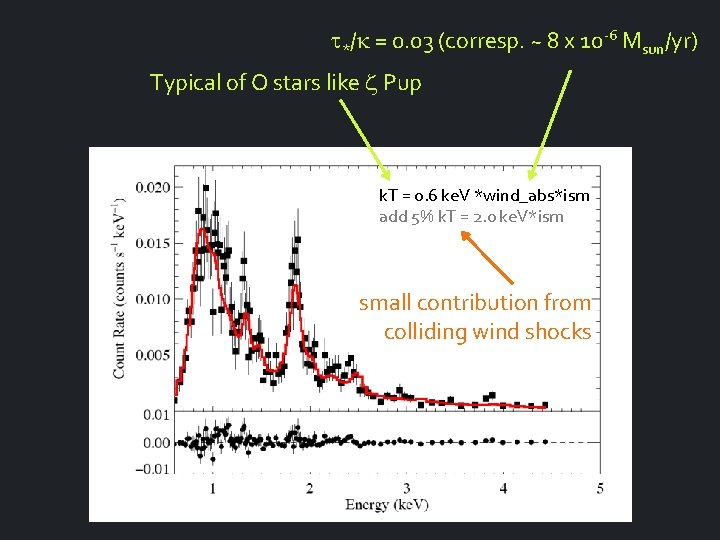
Chandra ACIS (low-res, CCD) spectrum of HD 93129 A Typical of O stars like Pup k. T = 0. 6 ke. V *wind_abs*ism add 5% k. T = 2. 0 ke. V*ism small contribution from colliding wind shocks
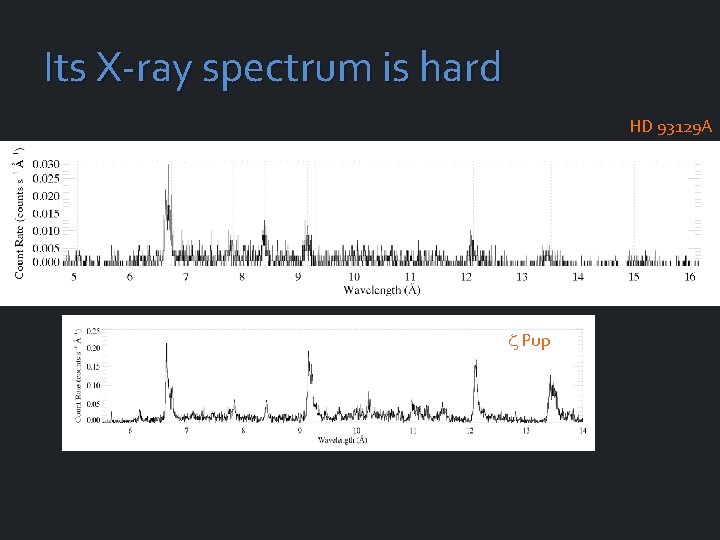
Its X-ray spectrum is hard HD 93129 A Si XIV Si XIII Pup Mg XII Mg XI
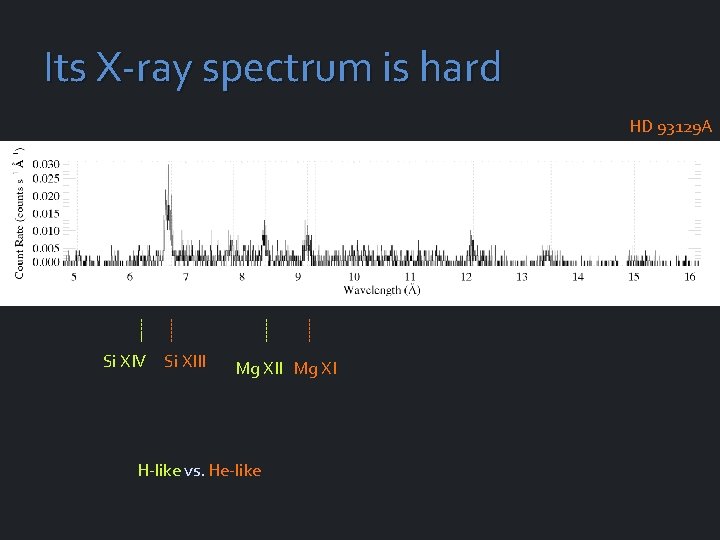
Its X-ray spectrum is hard HD 93129 A Si XIV Si XIII Mg XI H-like vs. He-like
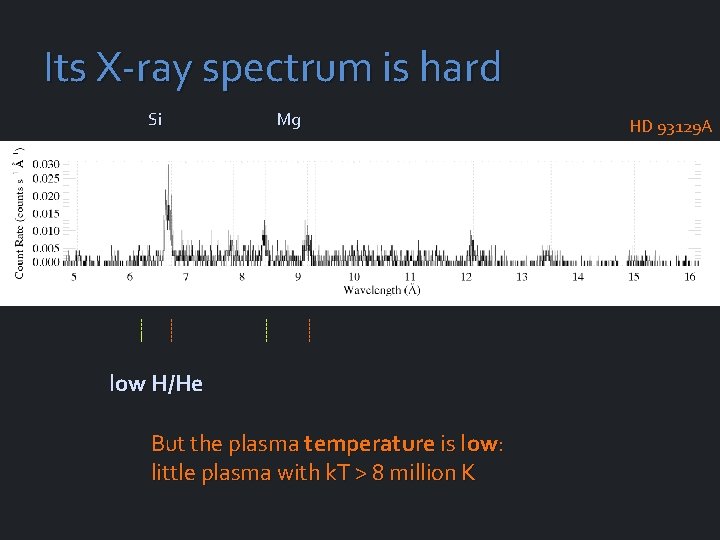
Its X-ray spectrum is hard Si Mg low H/He But the plasma temperature is low: little plasma with k. T > 8 million K HD 93129 A
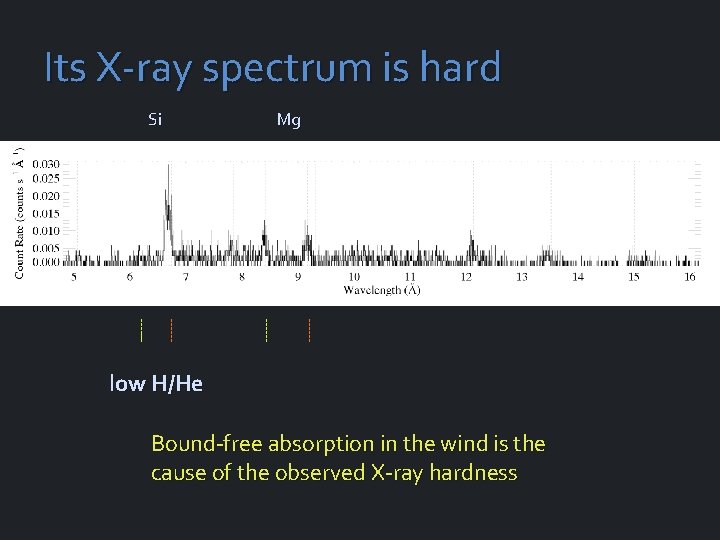
Its X-ray spectrum is hard Si Mg low H/He Bound-free absorption in the wind is the cause of the observed X-ray hardness
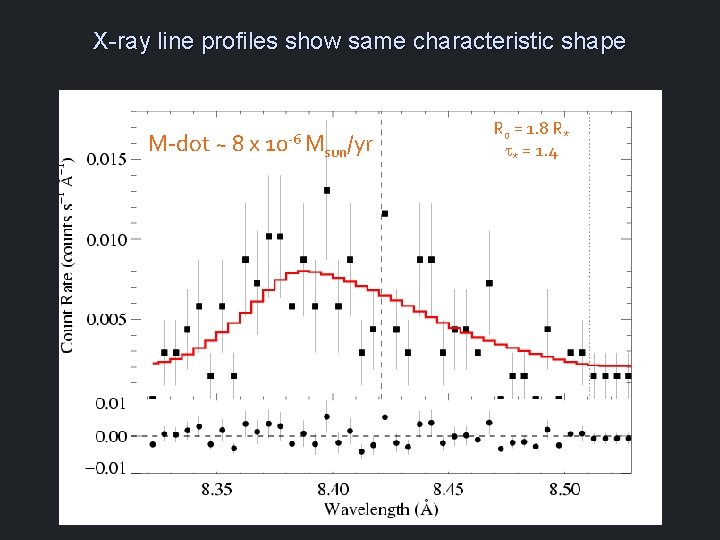
X-ray line profiles show same characteristic shape M-dot ~ 8 x 10 -6 M sun/yr Ro = 1. 8 R* t* = 1. 4
M-dot ~ 2 x 10 -5 Msun/yr from unclumped Ha Vinf ~ 3200 km/s HD 93129 A (O 2 If*): Mg XII Lya 8. 42 Å M-dot ~ 8 x 10 -6 M sun/yr Ro = 1. 8 R* t* = 1. 4
Low-resolution Chandra CCD spectrum of HD 93129 A Fit: thermal emission with wind + ISM absorption plus a second thermal component with just ISM k. T = 0. 6 ke. V *wind_abs*ism add 5% k. T = 2. 0 ke. V*ism
t*/k = 0. 03 (corresp. ~ 8 x 10 -6 Msun/yr) Typical of O stars like Pup k. T = 0. 6 ke. V *wind_abs*ism add 5% k. T = 2. 0 ke. V*ism small contribution from colliding wind shocks
Three mechanisms for massive star x-ray emission 1. Instability driven shocks 2. Wind-wind interaction in close binaries 3. Magnetically channeled wind shocks
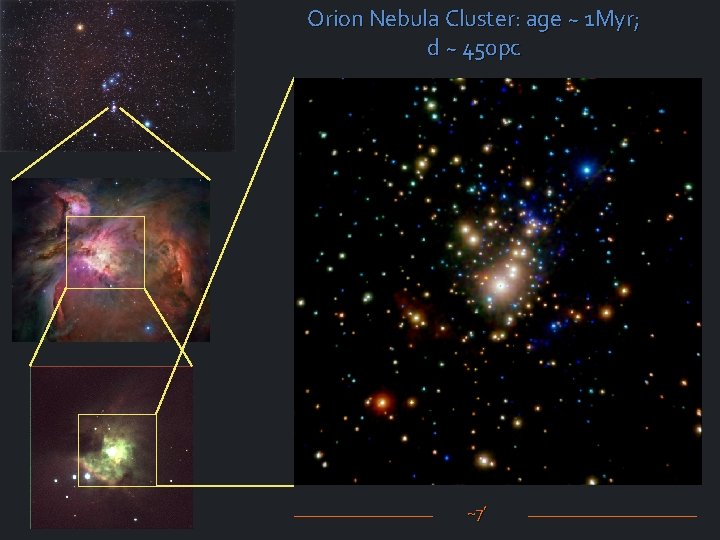
Orion Nebula Cluster: age ~ 1 Myr; d ~ 450 pc ~7’
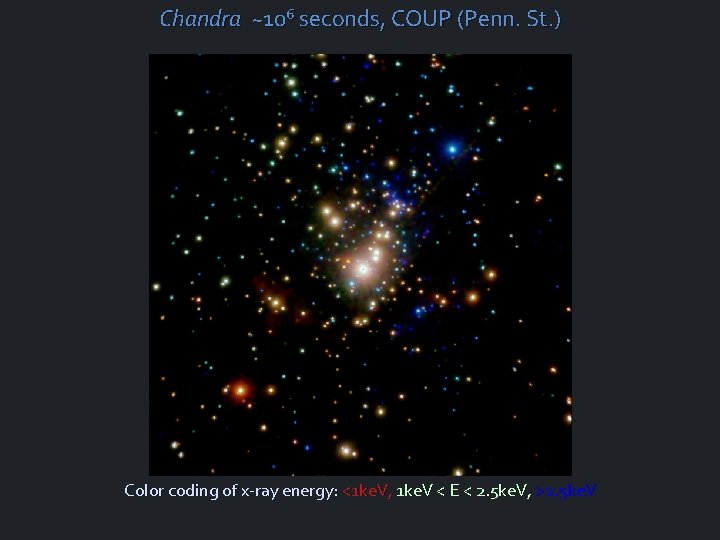
Chandra ~106 seconds, COUP (Penn. St. ) Color coding of x-ray energy: <1 ke. V, 1 ke. V < E < 2. 5 ke. V, >2. 5 ke. V
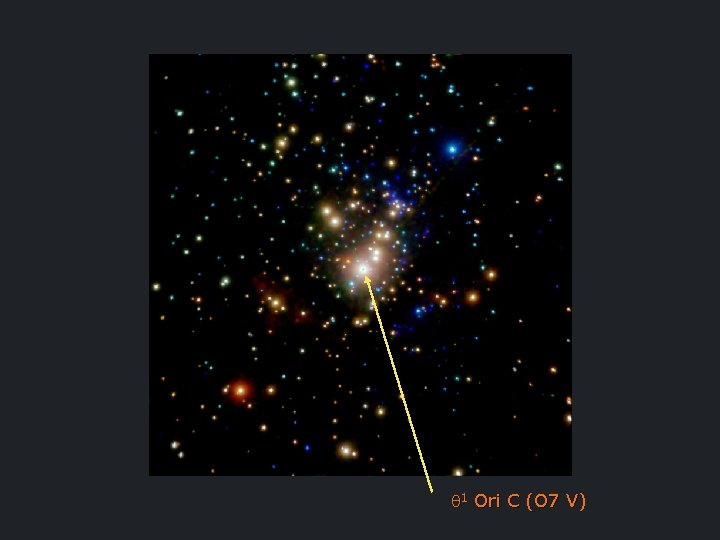
1 Ori C (O 7 V)
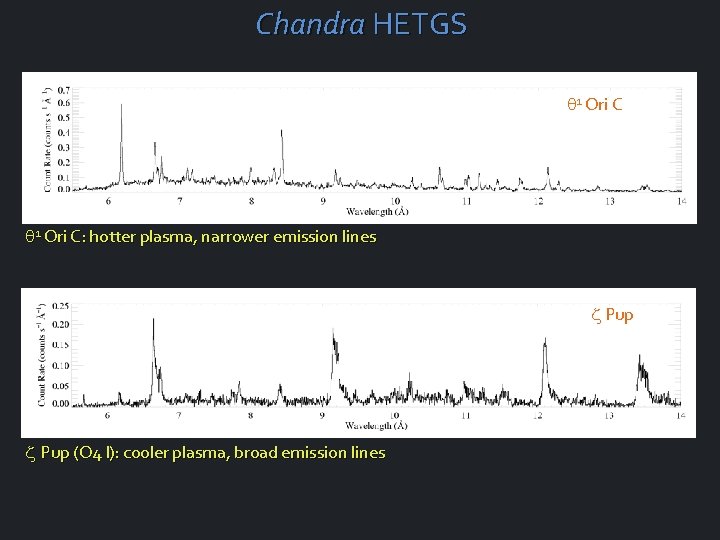
Chandra HETGS 1 Ori C: hotter plasma, narrower emission lines Pup (O 4 I): cooler plasma, broad emission lines
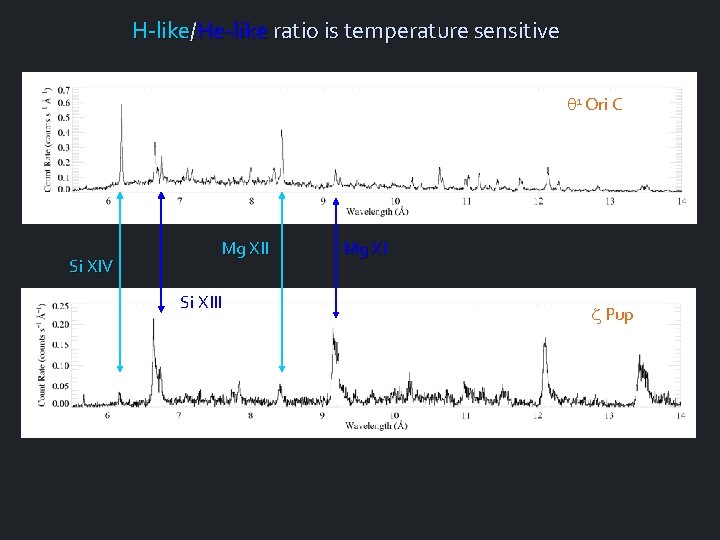
H-like/He-like ratio is temperature sensitive 1 Ori C Si XIV Mg XII Si XIII Mg XI Pup
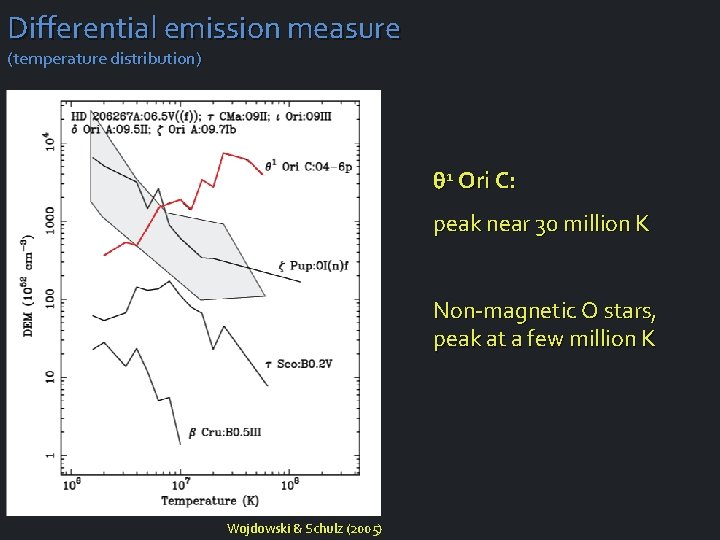
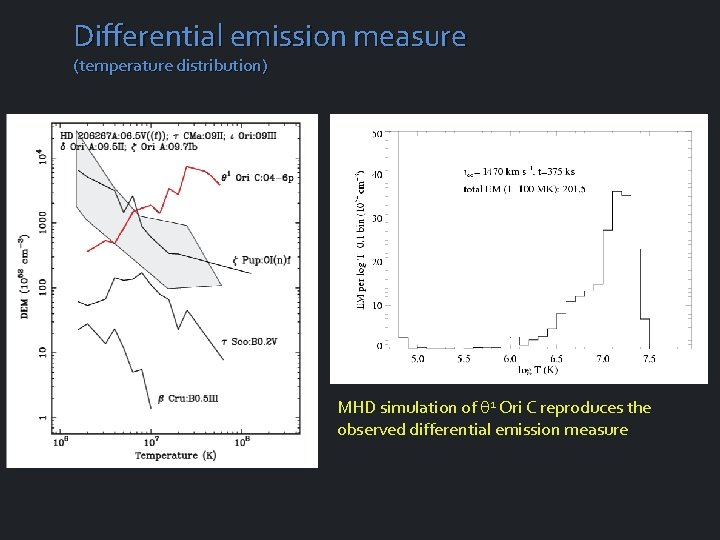
Differential emission measure (temperature distribution) q 1 Ori C: peak near 30 million K Non-magnetic O stars, peak at a few million K Wojdowski & Schulz (2005)
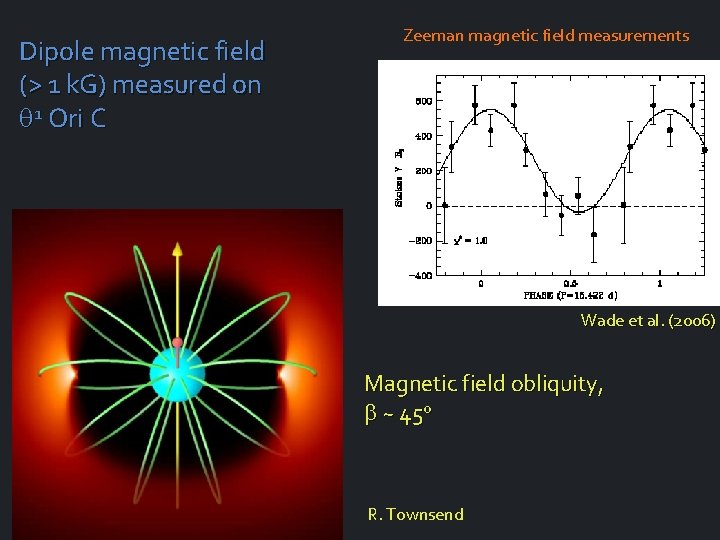
Dipole magnetic field (> 1 k. G) measured on 1 Ori C Zeeman magnetic field measurements Wade et al. (2006) Magnetic field obliquity, ~ 45 o R. Townsend
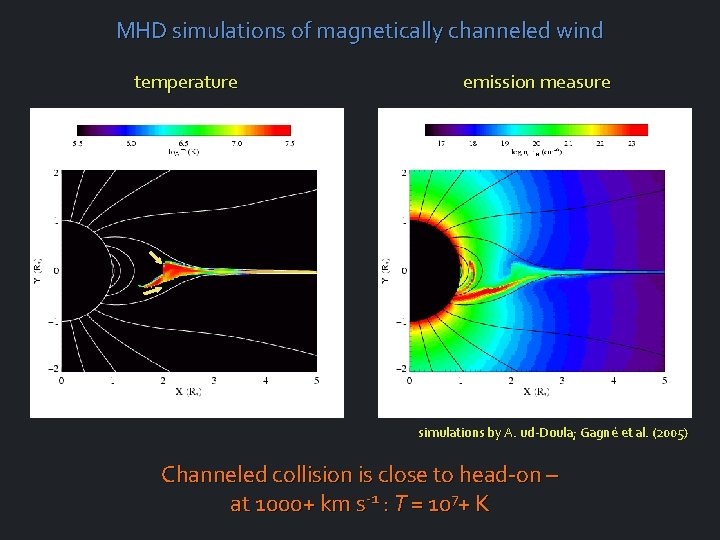
MHD simulations of magnetically channeled wind temperature emission measure simulations by A. ud-Doula; Gagné et al. (2005) Channeled collision is close to head-on – at 1000+ km s-1 : T = 107+ K
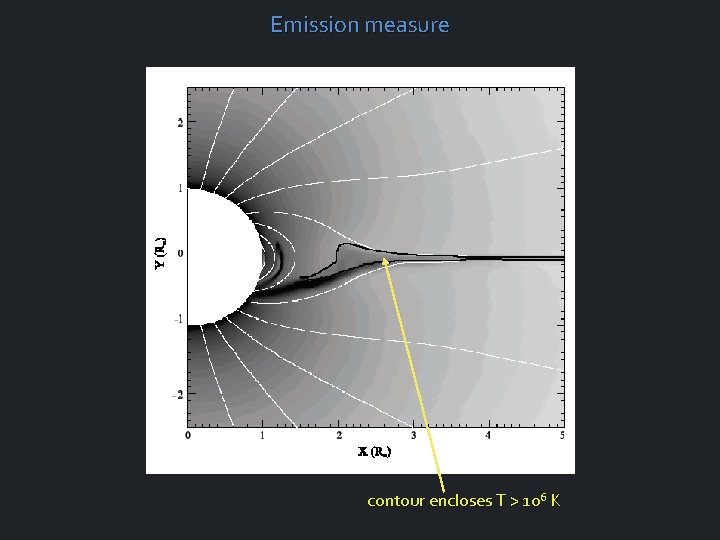
Emission measure contour encloses T > 106 K
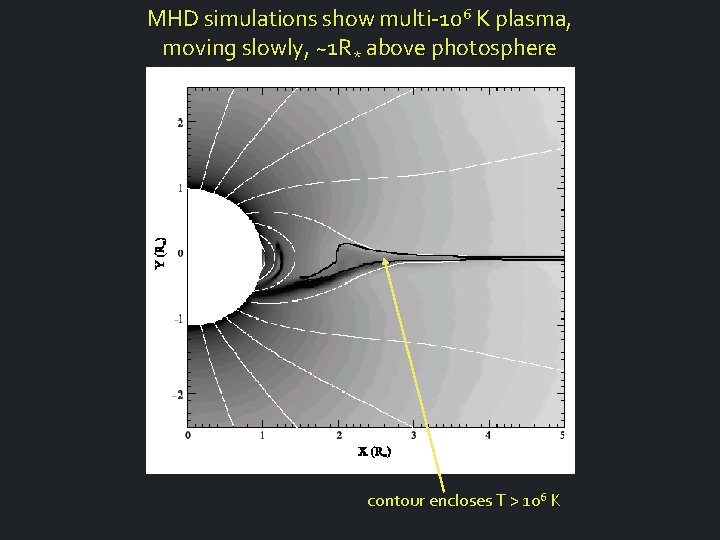
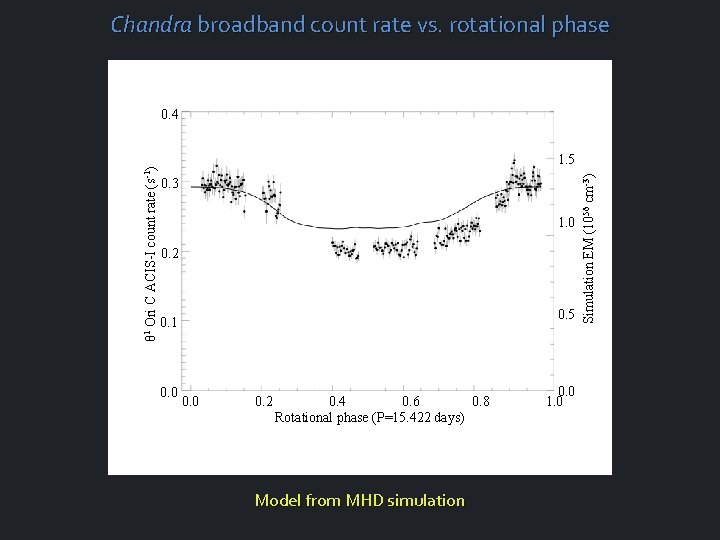
MHD simulations show multi-106 K plasma, moving slowly, ~1 R* above photosphere contour encloses T > 106 K
Differential emission measure (temperature distribution) MHD simulation of 1 Ori C reproduces the observed differential emission measure
Chandra broadband count rate vs. rotational phase 1. 5 0. 3 1. 0 0. 2 0. 5 0. 1 0. 0 0. 2 0. 4 0. 6 0. 8 Rotational phase (P=15. 422 days) Model from MHD simulation 0. 0 1. 0 Simulation EM (1056 cm-3) θ 1 Ori C ACIS-I count rate (s-1) 0. 4
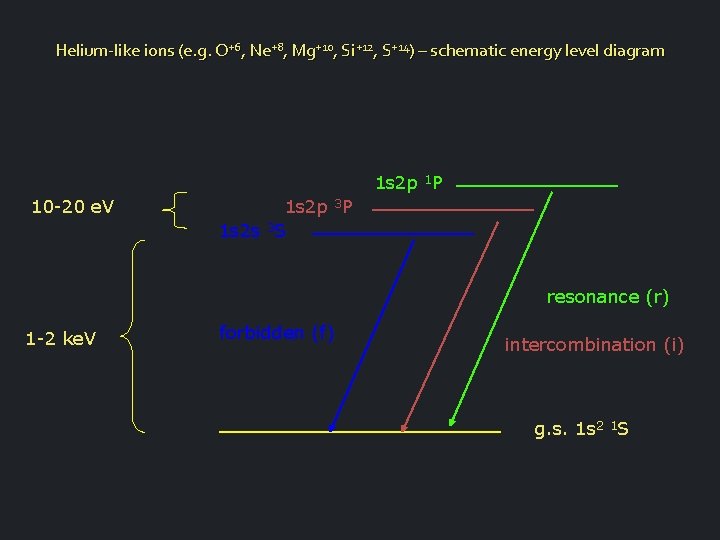
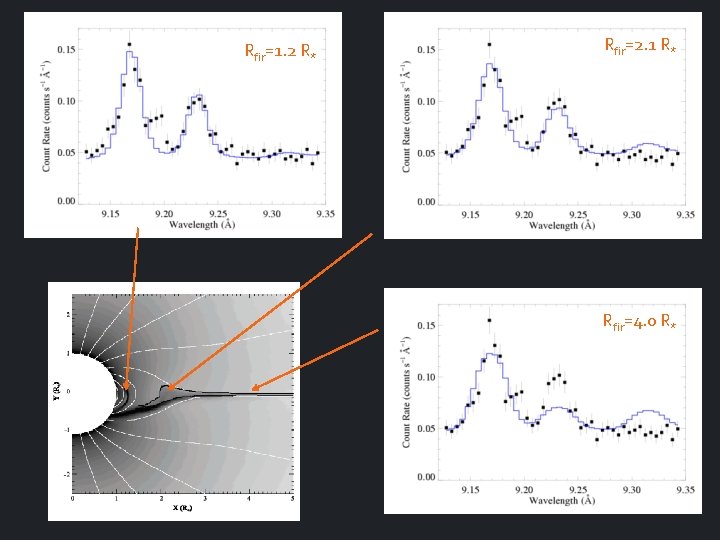
Helium-like ions (e. g. O+6, Ne+8, Mg+10, Si+12, S+14) – schematic energy level diagram 1 s 2 p 1 P 10 -20 e. V 1 s 2 p 3 P 1 s 2 s 3 S resonance (r) 1 -2 ke. V forbidden (f) intercombination (i) g. s. 1 s 2 1 S
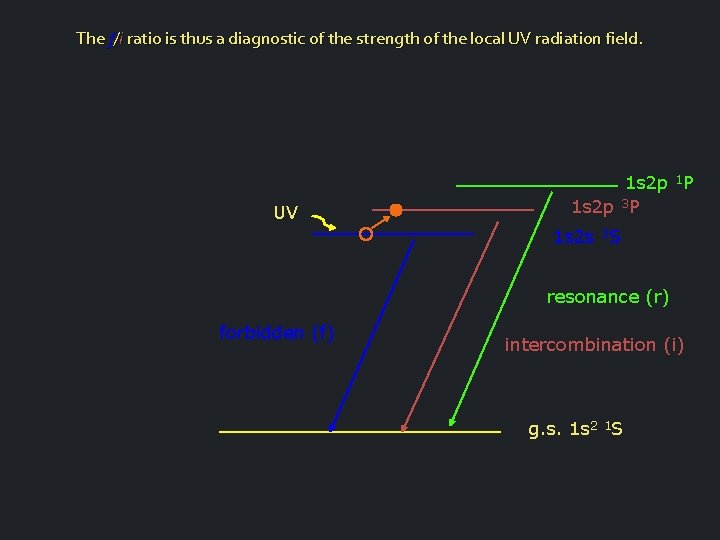
The f/i ratio is thus a diagnostic of the strength of the local UV radiation field. UV 1 s 2 p 1 P 1 s 2 p 3 P 1 s 2 s 3 S resonance (r) forbidden (f) intercombination (i) g. s. 1 s 2 1 S
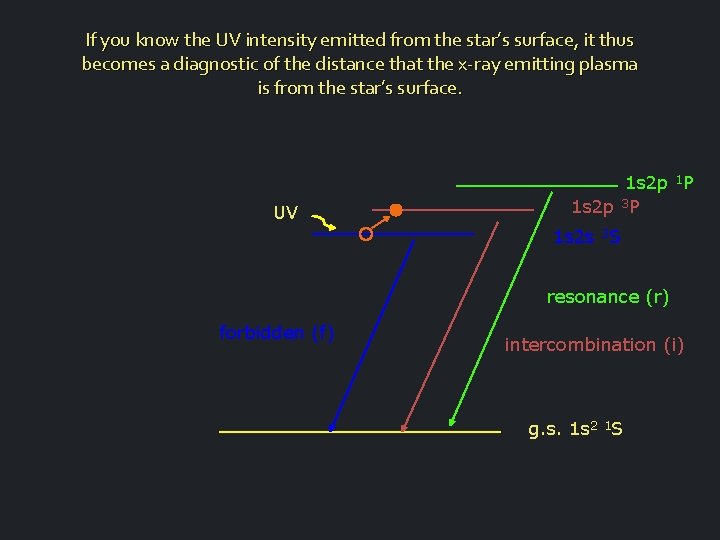
If you know the UV intensity emitted from the star’s surface, it thus becomes a diagnostic of the distance that the x-ray emitting plasma is from the star’s surface. UV 1 s 2 p 1 P 1 s 2 p 3 P 1 s 2 s 3 S resonance (r) forbidden (f) intercombination (i) g. s. 1 s 2 1 S
Rfir=1. 2 R* Rfir=2. 1 R* Rfir=4. 0 R*
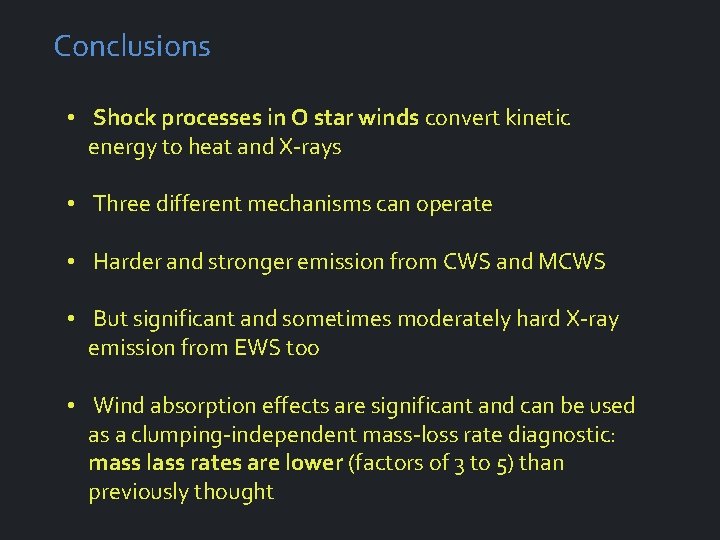
Conclusions • Shock processes in O star winds convert kinetic energy to heat and X-rays • Three different mechanisms can operate • Harder and stronger emission from CWS and MCWS • But significant and sometimes moderately hard X-ray emission from EWS too • Wind absorption effects are significant and can be used as a clumping-independent mass-loss rate diagnostic: mass lass rates are lower (factors of 3 to 5) than previously thought