
Xray reverberation in accreting black hole active galactic
X-ray reverberation in accreting black hole active galactic nuclei: Modelling the extended corona Stephen Hancock Supervisor: Andy Young Collaborator: Poemwai Chainakun, Suranaree University of Technology, Thailand 13 June 2019 1
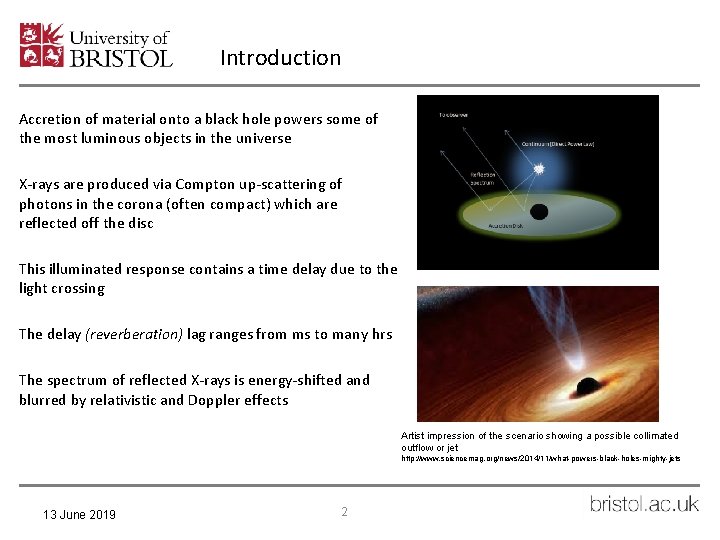
Introduction Accretion of material onto a black hole powers some of the most luminous objects in the universe X-rays are produced via Compton up-scattering of photons in the corona (often compact) which are reflected off the disc This illuminated response contains a time delay due to the light crossing The delay (reverberation) lag ranges from ms to many hrs The spectrum of reflected X-rays is energy-shifted and blurred by relativistic and Doppler effects Artist impression of the scenario showing a possible collimated outflow or jet http: //www. sciencemag. org/news/2014/11/what-powers-black-holes-mighty-jets 13 June 2019 2

The first relativistically broadened Fe K line was discovered in ASCA observations of MCG-6 -30 -15 (Tanaka et al. 1995). The intrinsically narrow 6. 4 ke. V Fe line is broadened and skewed to lower energies. 13 June 2019 3

The case of 1 H 0707 -495 First hints of reflection seen in Ark 564 (Mc. Hardy et al. 2007) lead to the first robust discovery of short time lags discovered in 1 H 0707 -495 (Fabian et al. 2009). Time Lag vs Frequency Soft reflection dominated band >6 x 10 -4 Hz follows the hard (power law dominated) band by around 30 s. Spectrum fitted with a relativistically blurred reflection model 13 June 2019 4
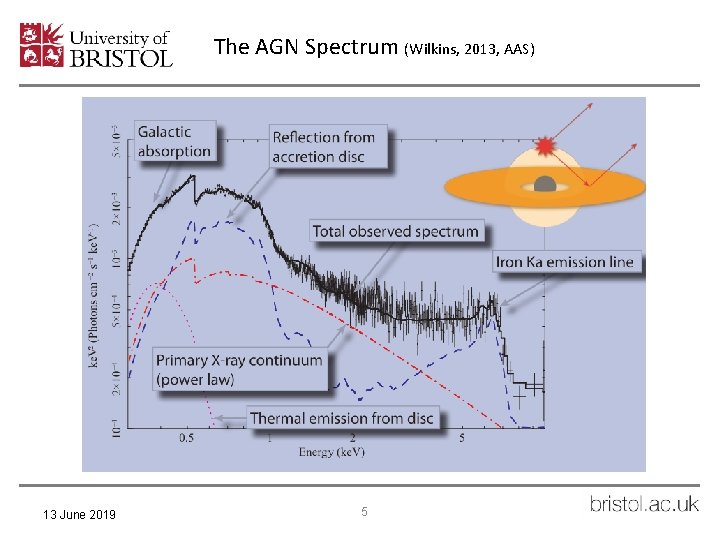
The AGN Spectrum (Wilkins, 2013, AAS) 13 June 2019 5
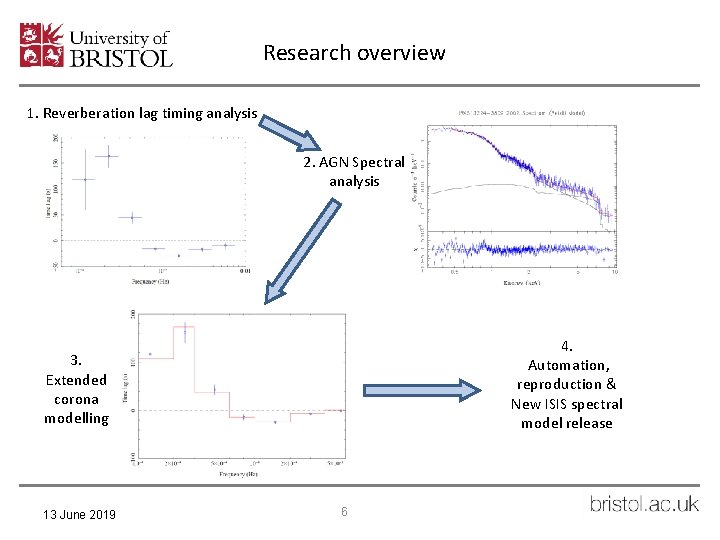
Research overview 1. Reverberation lag timing analysis 2. AGN Spectral analysis 4. Automation, reproduction & New ISIS spectral model release 3. Extended corona modelling 13 June 2019 6
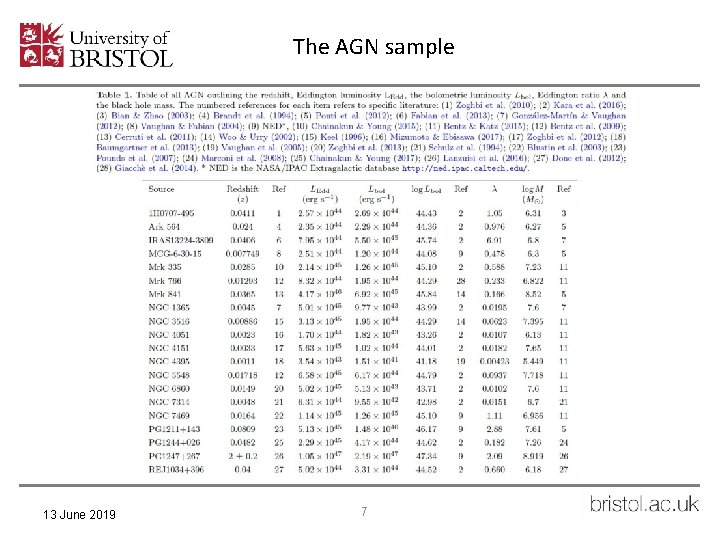
The AGN sample 13 June 2019 7
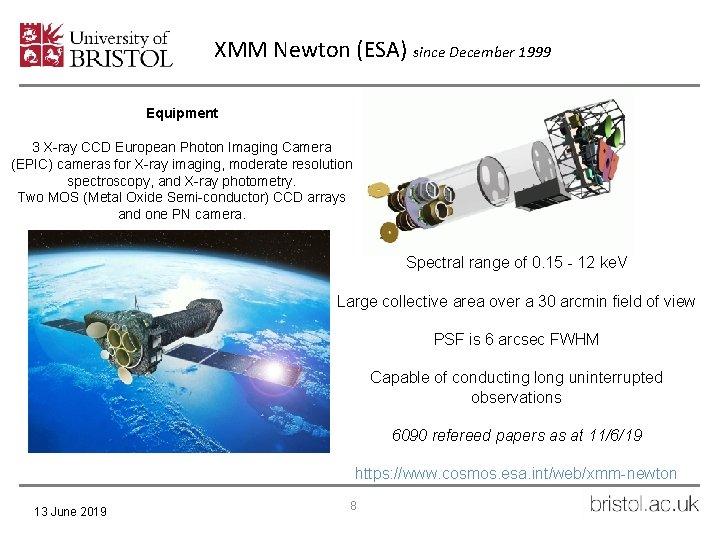
XMM Newton (ESA) since December 1999 Equipment 3 X-ray CCD European Photon Imaging Camera (EPIC) cameras for X-ray imaging, moderate resolution spectroscopy, and X-ray photometry. Two MOS (Metal Oxide Semi-conductor) CCD arrays and one PN camera. Spectral range of 0. 15 - 12 ke. V Large collective area over a 30 arcmin field of view PSF is 6 arcsec FWHM Capable of conducting long uninterrupted observations 6090 refereed papers as at 11/6/19 https: //www. cosmos. esa. int/web/xmm-newton 13 June 2019 8
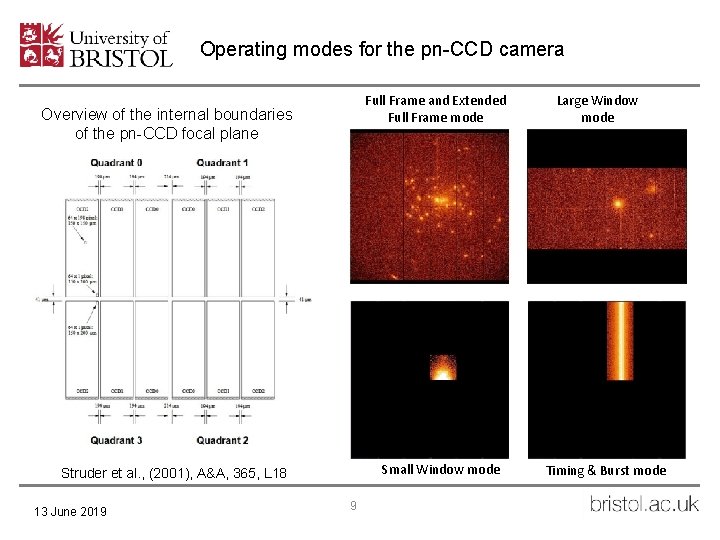
Operating modes for the pn-CCD camera Full Frame and Extended Full Frame mode Overview of the internal boundaries of the pn-CCD focal plane Small Window mode Struder et al. , (2001), A&A, 365, L 18 13 June 2019 9 Large Window mode Timing & Burst mode
Timing analysis: The lag – frequency 13 June 2019 10
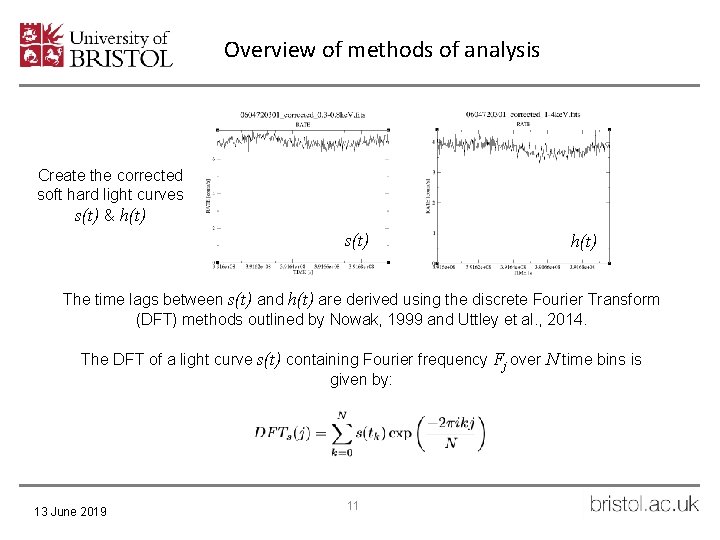
Overview of methods of analysis Create the corrected soft hard light curves s(t) & h(t) s(t) h(t) The time lags between s(t) and h(t) are derived using the discrete Fourier Transform (DFT) methods outlined by Nowak, 1999 and Uttley et al. , 2014. The DFT of a light curve s(t) containing Fourier frequency Fj over N time bins is given by: 13 June 2019 11
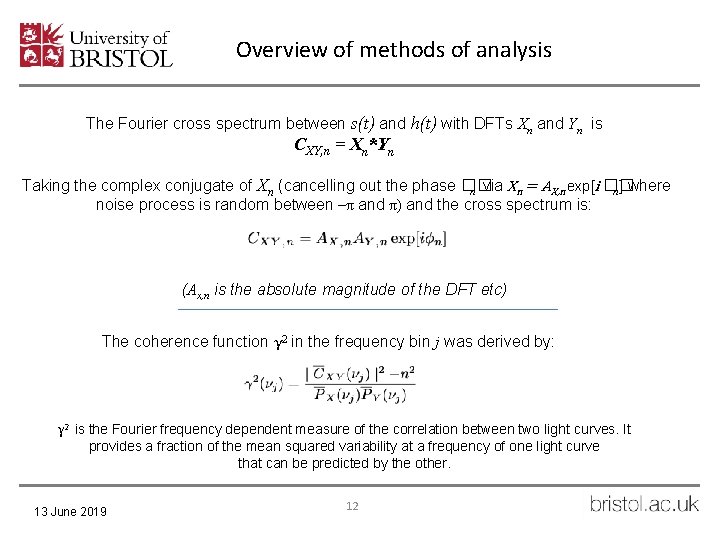
Overview of methods of analysis The Fourier cross spectrum between s(t) and h(t) with DFTs Xn and Yn is CXY, n = Xn*Yn Taking the complex conjugate of Xn (cancelling out the phase �� n via Xn = AX, n exp[i �� n] where noise process is random between –π and π) and the cross spectrum is: (Ax, n is the absolute magnitude of the DFT etc) The coherence function γ 2 in the frequency bin j was derived by: γ 2 is the Fourier frequency dependent measure of the correlation between two light curves. It provides a fraction of the mean squared variability at a frequency of one light curve that can be predicted by the other. 13 June 2019 12
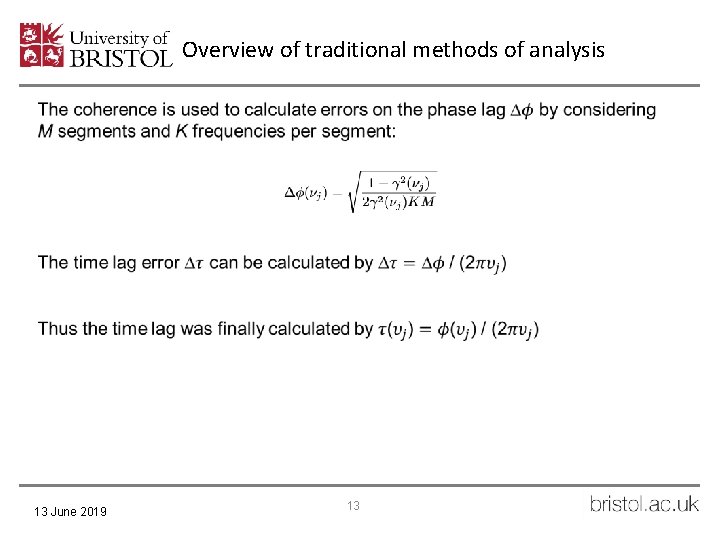
Overview of traditional methods of analysis 13 June 2019 13
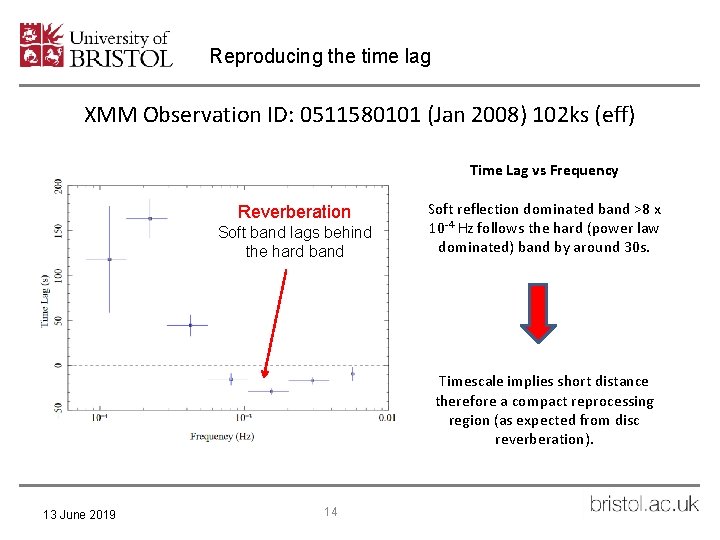
Reproducing the time lag XMM Observation ID: 0511580101 (Jan 2008) 102 ks (eff) Time Lag vs Frequency Reverberation Soft band lags behind the hard band Soft reflection dominated band >8 x 10 -4 Hz follows the hard (power law dominated) band by around 30 s. Timescale implies short distance therefore a compact reprocessing region (as expected from disc reverberation). 13 June 2019 14
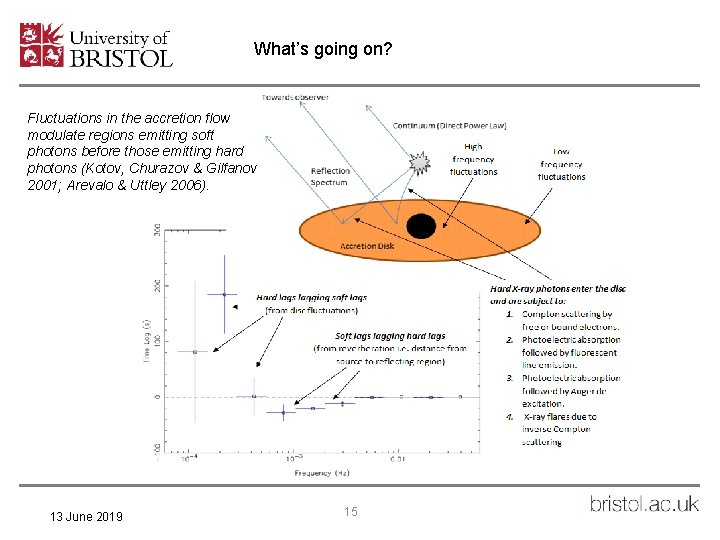
What’s going on? X-ray reverberation in accreting black hole active galactic nuclei Fluctuations in the accretion flow modulate regions emitting soft photons before those emitting hard photons (Kotov, Churazov & Gilfanov 2001; Arevalo & Uttley 2006). Stephen Hancock Supervisor: Andy Young 13 June 2019 15

X-ray reverberation in accreting black hole active galactic nuclei Stephen Hancock Supervisor: Andy Young Chainakun et al. (2019) 13 June 2019 16
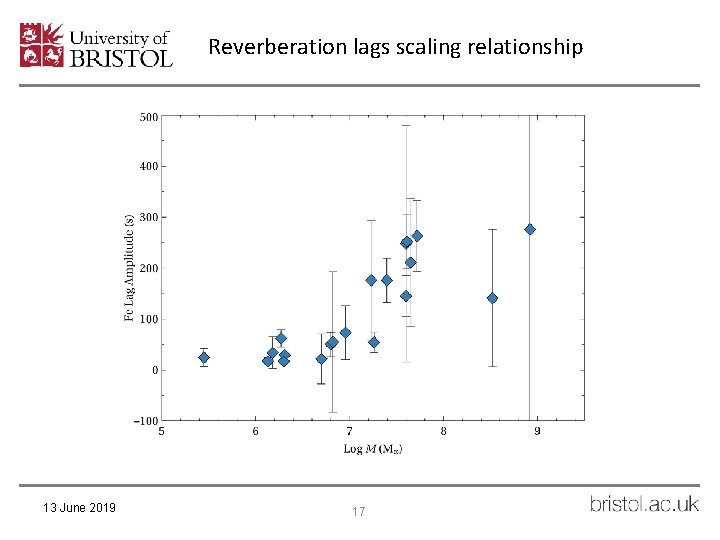
Reverberation lags scaling relationship 13 June 2019 17
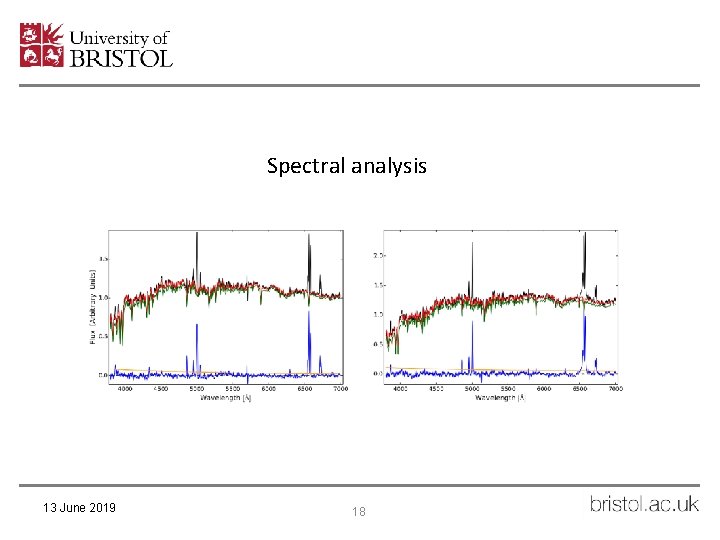
Spectral analysis 13 June 2019 18
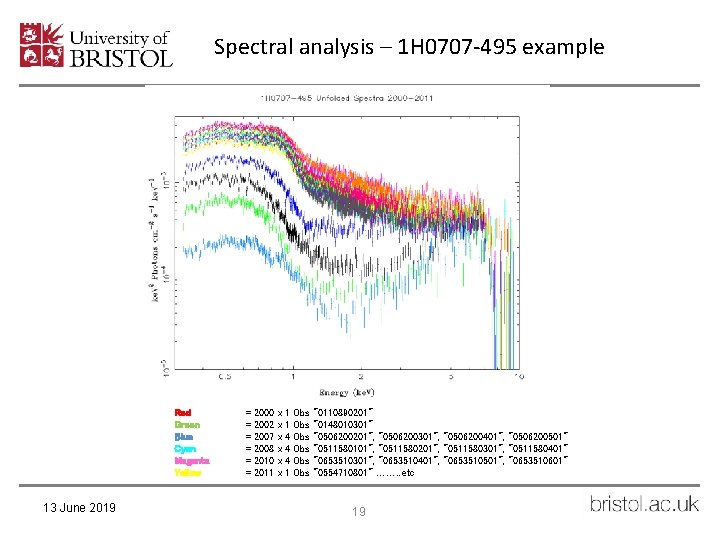
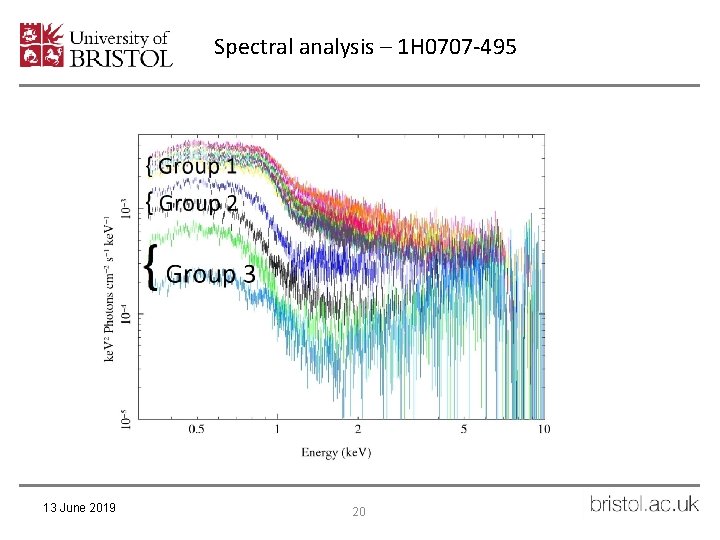
Spectral analysis – 1 H 0707 -495 example Red Green Blue Cyan Magenta Yellow 13 June 2019 = = = 2000 2002 2007 2008 2010 2011 x x x 1 1 4 4 4 1 Obs Obs Obs "0110890201" "0148010301" "0506200201", "0506200301", "0506200401", "0506200501" "0511580101", "0511580201", "0511580301", "0511580401" "0653510301", "0653510401", "0653510501", "0653510601" "0554710801" ……. . etc 19
Spectral analysis – 1 H 0707 -495 13 June 2019 20
Spectral analysis – Mrk 335 example 13 June 2019 21
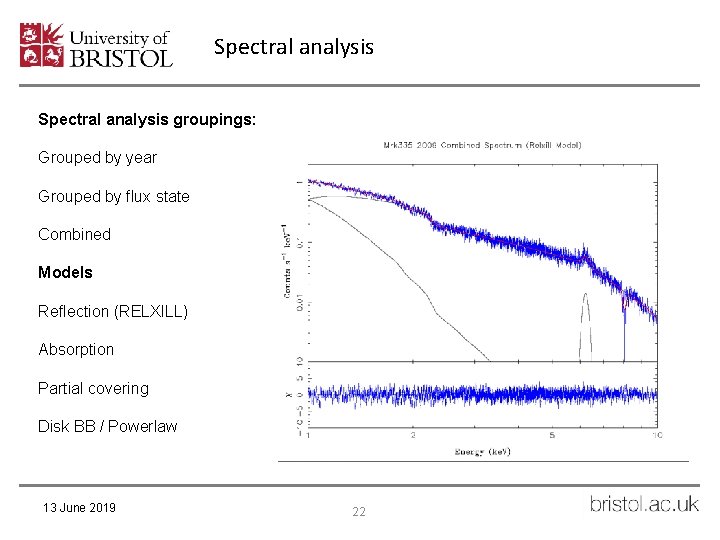
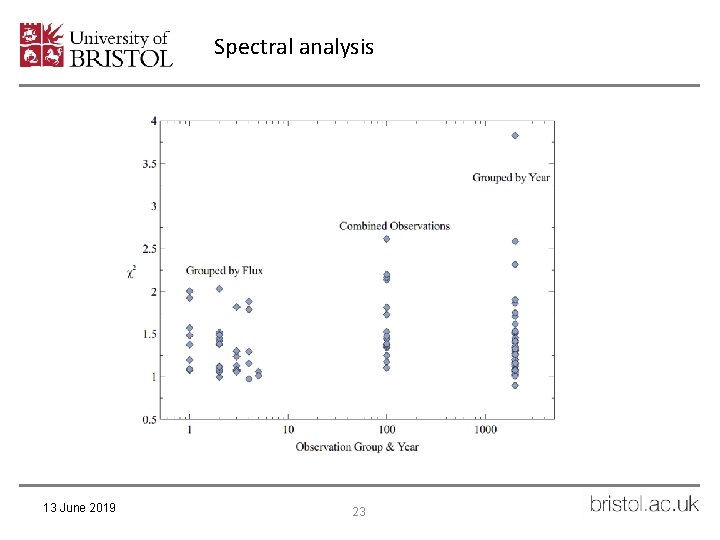
Spectral analysis groupings: Grouped by year Grouped by flux state Combined Models Reflection (RELXILL) Absorption Partial covering Disk BB / Powerlaw 13 June 2019 22
Spectral analysis 13 June 2019 23
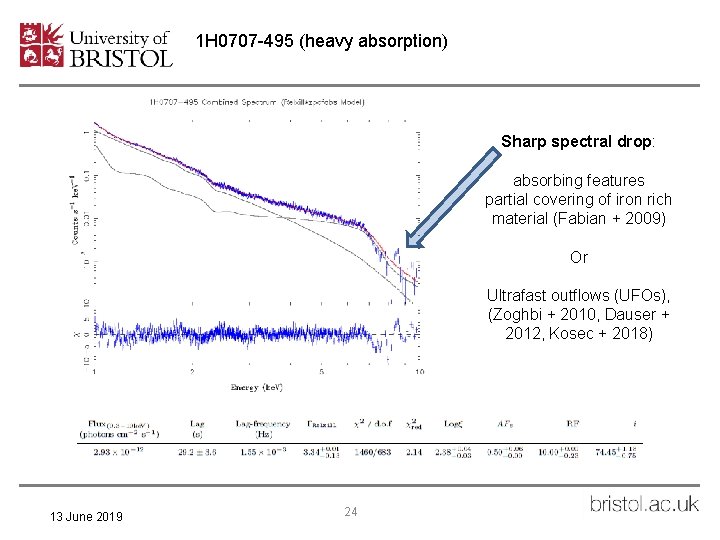
1 H 0707 -495 (heavy absorption) Sharp spectral drop: absorbing features partial covering of iron rich material (Fabian + 2009) Or Ultrafast outflows (UFOs), (Zoghbi + 2010, Dauser + 2012, Kosec + 2018) 13 June 2019 24
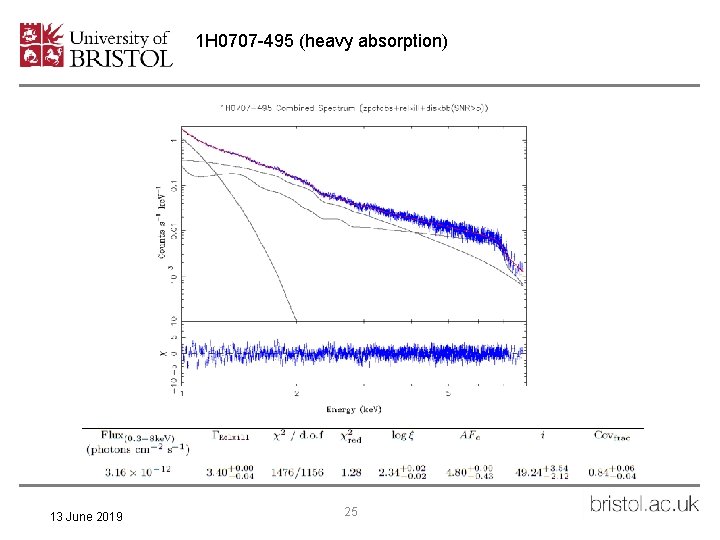
1 H 0707 -495 (heavy absorption) 13 June 2019 25
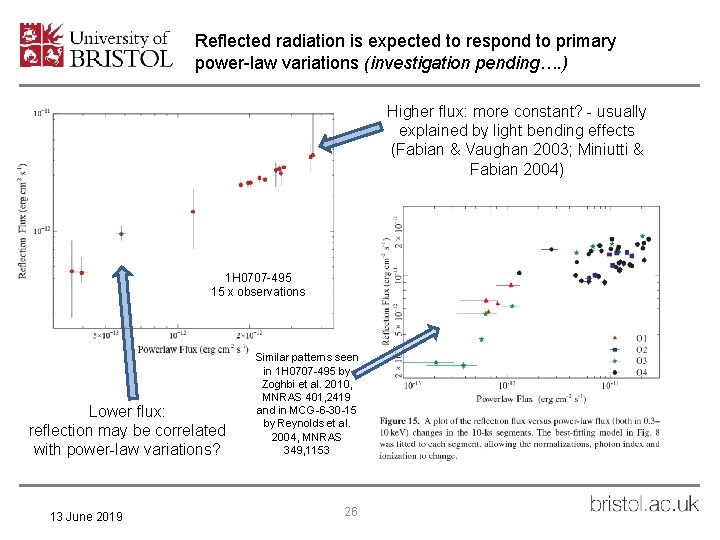
Reflected radiation is expected to respond to primary power-law variations (investigation pending…. ) Higher flux: more constant? - usually explained by light bending effects (Fabian & Vaughan 2003; Miniutti & Fabian 2004) 1 H 0707 -495 15 x observations Lower flux: reflection may be correlated with power-law variations? 13 June 2019 Similar patterns seen in 1 H 0707 -495 by Zoghbi et al. 2010, MNRAS 401, 2419 and in MCG-6 -30 -15 by Reynolds et al. 2004, MNRAS 349, 1153 26
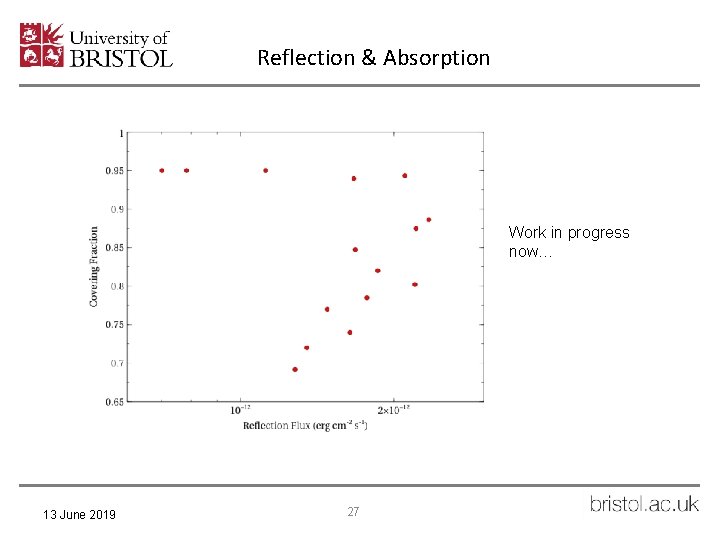
Reflection & Absorption Work in progress now… 13 June 2019 27
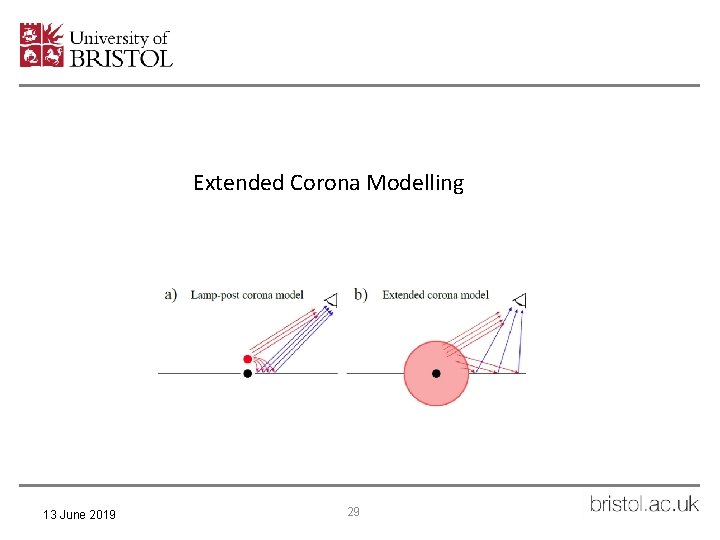
Extended Corona Modelling 13 June 2019 29
Extended Corona Modelling “The reproduction of soft reverberation lags from a compact corona and the hard lags produced by propagating fluctuations through an extended region whilst maintaining the features of the energy dependence seen in the Fe K line region is challenging and computationally intensive”. Chainakun & Young 2017 13 June 2019 30
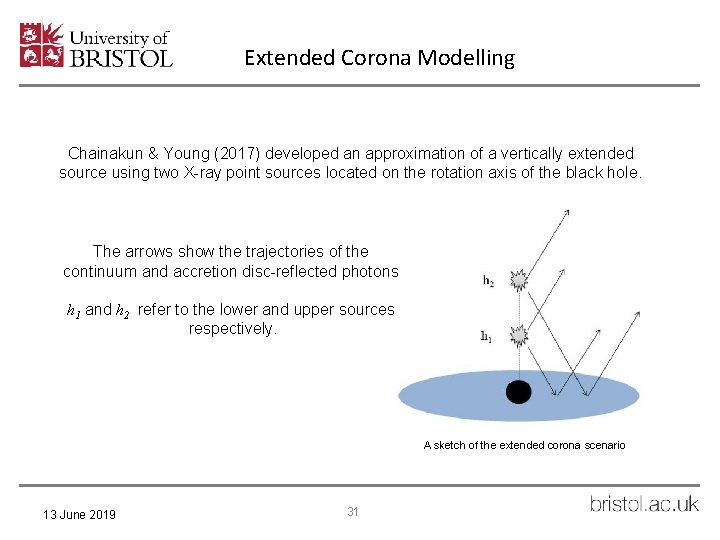
Extended Corona Modelling Chainakun & Young (2017) developed an approximation of a vertically extended source using two X-ray point sources located on the rotation axis of the black hole. The arrows show the trajectories of the continuum and accretion disc-reflected photons h 1 and h 2 refer to the lower and upper sources respectively. A sketch of the extended corona scenario 13 June 2019 31
Extended corona model The model calculates distance and time in gravitational units rg = GM/c 2 and tg = GM/c 3 respectively around a maximally spinning black hole. The accretion disc is assumed to be the standard geometrically thin, optically thick disc extending out to a distance 400 rg. Two sources have the same power law and luminosity but different intensity of reflection h 2 ∝ h 1/2 Also uses ray-tracing techniques to calculate photon trajectories along Kerr geodesics (i. e. Chainakun & Young (2012); Bardeen et al. (1972); Reynolds et al. (1999)) 13 June 2019 32
Extended Corona Modelling Instead of modelling the propagating fluctuations, a phenomenological function of expected source responses which react to these propagation's is employed. The two X-ray sources are allowed to vary as they respond to primary intrinsic variations. The X-ray continuum variability depends on the response of the source and the X -ray reflection depends also on the disc response. Therefore the model has to predict the time lags from both continuum X-ray sources and the disc responses. 13 June 2019 33
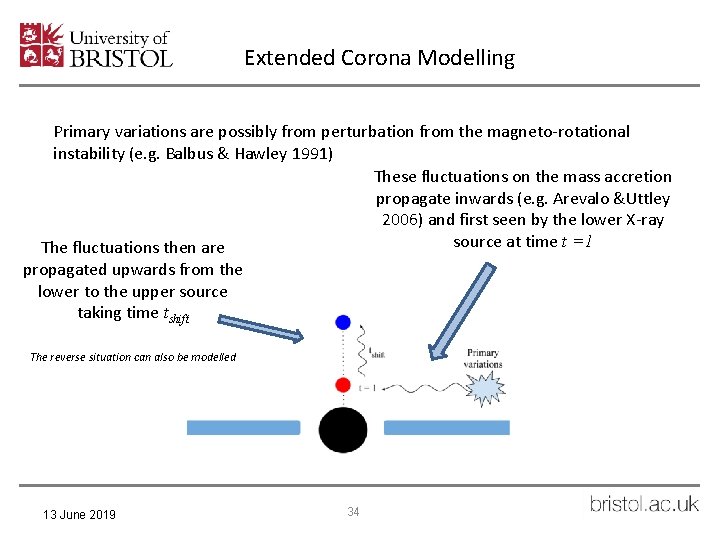
Extended Corona Modelling Primary variations are possibly from perturbation from the magneto-rotational instability (e. g. Balbus & Hawley 1991) These fluctuations on the mass accretion propagate inwards (e. g. Arevalo &Uttley 2006) and first seen by the lower X-ray source at time t =1 The fluctuations then are propagated upwards from the lower to the upper source taking time tshift The reverse situation can also be modelled 13 June 2019 34
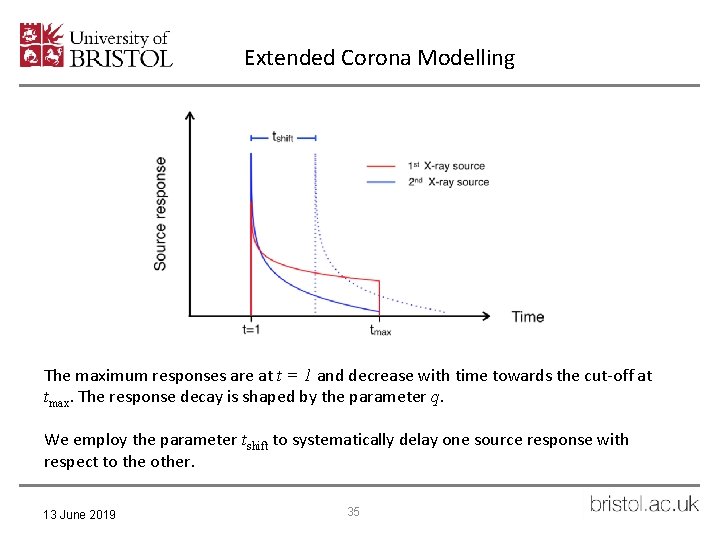
Extended Corona Modelling The maximum responses are at t = 1 and decrease with time towards the cut-off at tmax. The response decay is shaped by the parameter q. We employ the parameter tshift to systematically delay one source response with respect to the other. 13 June 2019 35
Dilution (See Uttley et al. 2014 Chp 4) Dilution - the presence of emission from the continuum in the reflection band - this can reduce the amplitude of the lags and the shape of the lag-frequency spectrum. Photons of all X-ray energies are traced so the Fe K lags are formed of photons of other energies being redshifted or blue-shifted (both direct and reflection photons are included). In order to estimate the location of the second X-ray source, we evaluate the brightness ratio b using the standard light bending model (e. g. Miniutti & Fabian (2004), MNRAS, 349, 1435). 13 June 2019 36
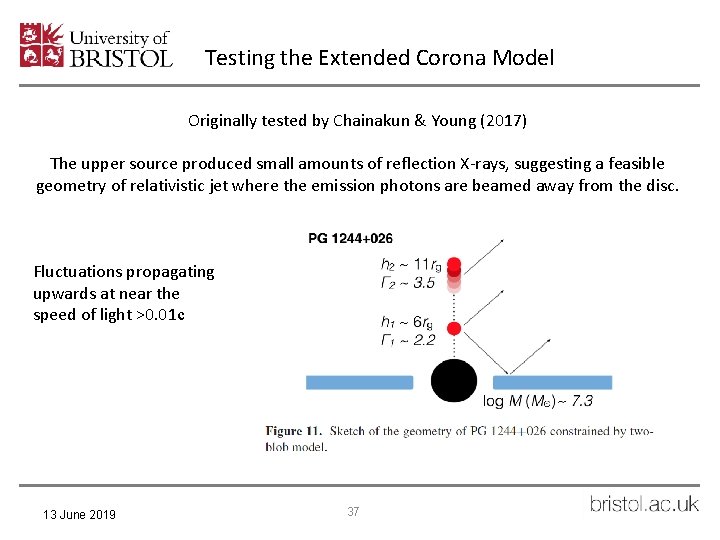
Testing the Extended Corona Model Originally tested by Chainakun & Young (2017) The upper source produced small amounts of reflection X-rays, suggesting a feasible geometry of relativistic jet where the emission photons are beamed away from the disc. Fluctuations propagating upwards at near the speed of light >0. 01 c 13 June 2019 37
Preliminary testing & Improving the model The original model was used on 15 AGN from this study and found: X-ray sources between 2~20 rg where fluctuations propagate from the lower to upper source between 0. 9 ~ 141 tg Model contained many fixed parameter assumptions: Ionisation = 10 erg cm s -1 Inclination = 30° Disc density p = 0 Photon index Γ 1 = 2. 2 Source response q 1 = 1 Fe Abundance A = 1 Brightness B B 2=B 1 where B 1 = 1 13 June 2019 38
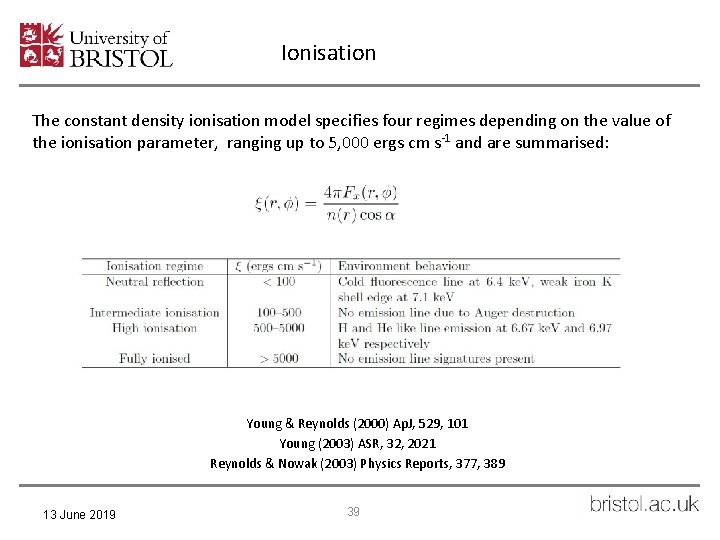
Ionisation The constant density ionisation model specifies four regimes depending on the value of the ionisation parameter, ranging up to 5, 000 ergs cm s-1 and are summarised: Young & Reynolds (2000) Ap. J, 529, 101 Young (2003) ASR, 32, 2021 Reynolds & Nowak (2003) Physics Reports, 377, 389 13 June 2019 39
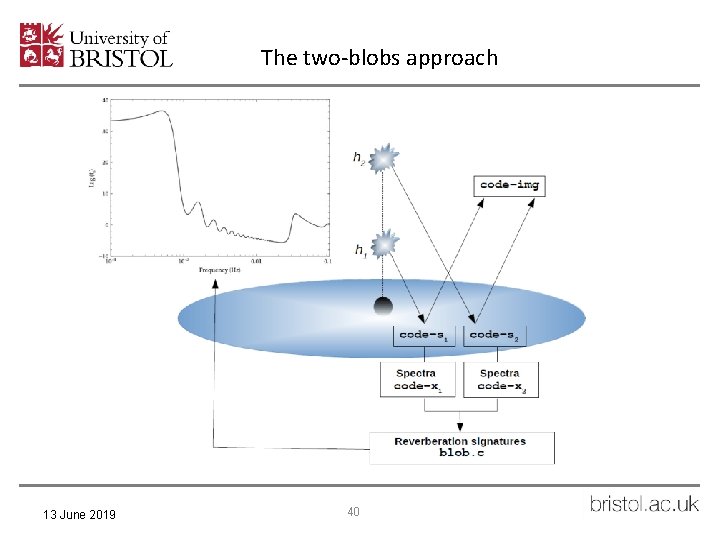
The two-blobs approach 13 June 2019 40
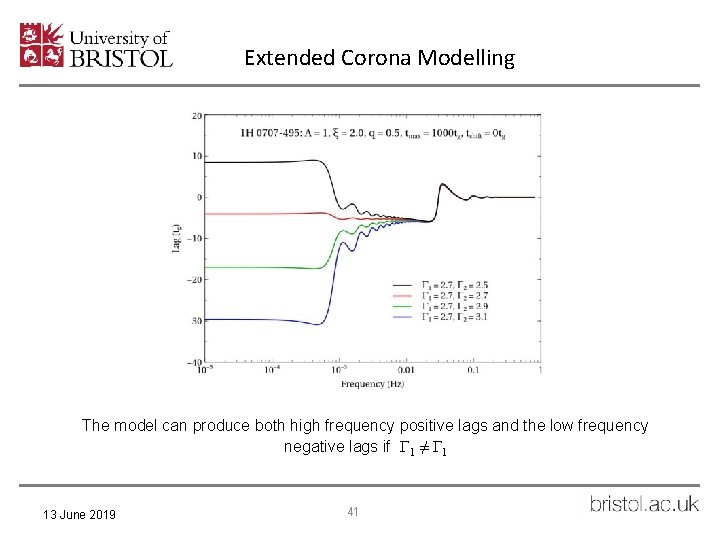
Extended Corona Modelling The model can produce both high frequency positive lags and the low frequency negative lags if Γ 1 ≠ Γ 1 13 June 2019 41
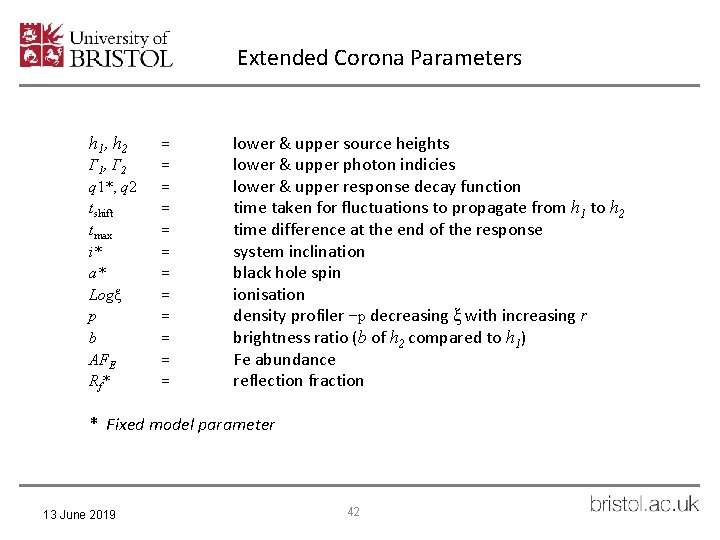
Extended Corona Parameters h 1, h 2 Γ 1, Γ 2 q 1*, q 2 tshift tmax i* a* Logξ p b AFE Rf* = = = lower & upper source heights lower & upper photon indicies lower & upper response decay function time taken for fluctuations to propagate from h 1 to h 2 time difference at the end of the response system inclination black hole spin ionisation density profiler −p decreasing ξ with increasing r brightness ratio (b of h 2 compared to h 1) Fe abundance reflection fraction * Fixed model parameter 13 June 2019 42
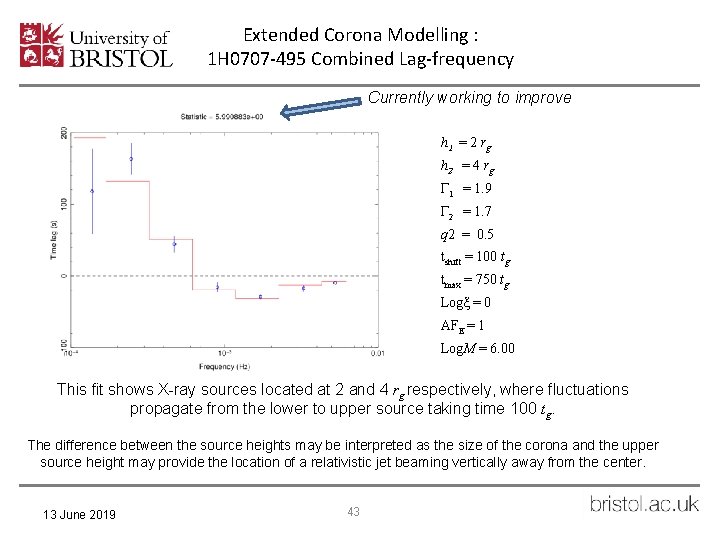
Extended Corona Modelling : 1 H 0707 -495 Combined Lag-frequency Currently working to improve h 1 = 2 rg h 2 = 4 rg Γ 1 = 1. 9 Γ 2 = 1. 7 q 2 = 0. 5 tshift = 100 tg tmax = 750 tg Logξ = 0 AFE = 1 Log. M = 6. 00 This fit shows X-ray sources located at 2 and 4 rg respectively, where fluctuations propagate from the lower to upper source taking time 100 tg. The difference between the source heights may be interpreted as the size of the corona and the upper source height may provide the location of a relativistic jet beaming vertically away from the center. 13 June 2019 43
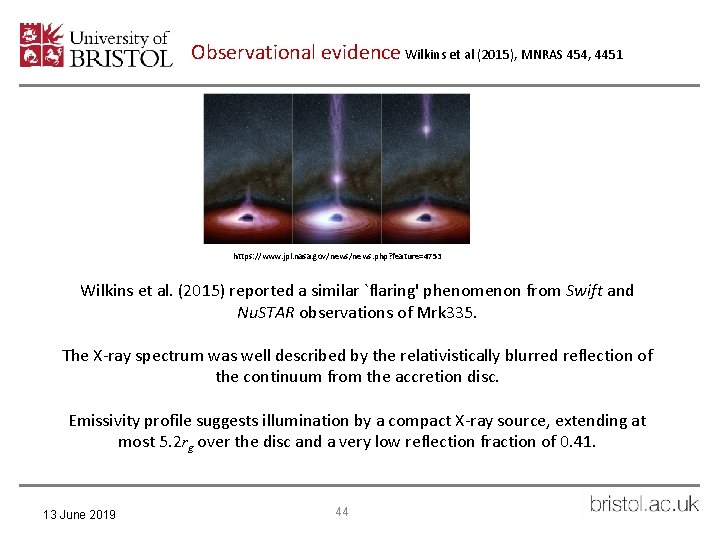
Observational evidence Wilkins et al (2015), MNRAS 454, 4451 https: //www. jpl. nasa. gov/news. php? feature=4753 Wilkins et al. (2015) reported a similar `flaring' phenomenon from Swift and Nu. STAR observations of Mrk 335. The X-ray spectrum was well described by the relativistically blurred reflection of the continuum from the accretion disc. Emissivity profile suggests illumination by a compact X-ray source, extending at most 5. 2 rg over the disc and a very low reflection fraction of 0. 41. 13 June 2019 44
What’s the plan? Currently improving fits by running model for: wider parameter ranges smaller step sizes Improving script parallelization Once improved fits are found: Fit all 1 H 0707 -495 lag groups Consolidate methods and roll out to all other AGN Report findings (paper(s) in prep – awaiting ECM results) Consolidate/automate model for general use & compile publicly in Github Complete X-ray Reverberation (Bristol-hosted) web-pages for reproduction of work Roll out model & publish in 2 nd/3 rd paper 13 June 2019 38 45
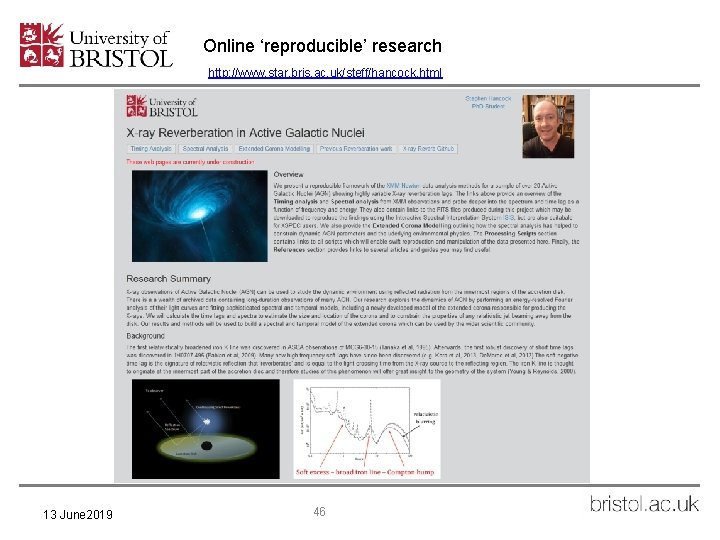
Online ‘reproducible’ research http: //www. star. bris. ac. uk/steff/hancock. html 13 June 2019 46

04 March 2021 48
- Slides: 46