XRAY DIFFRACTION q X Ray Sources Part of


 Of K 1 radiation")


, matter")


 has been visualized as a")

 For Cu K radiation ( = 1. 54 Å)")
 planes are a subset of (200) planes All these form the (200)")


 in the")


")


 BCC: 111 BCC. (ii) FCC: 100, 111,")


")
 derived from extinction")


 that the x-axis is 2 , which is the angle of deviation")
 Radiation: Cu K , = 1. 54")


? At = 90 the")

 smaller")
 from 2 versus Intensity Data Solved example 1")


 Scattering from")


 courtesy: Dr. Kallol Mondal, MSE, IITK")
- Slides: 73
X-RAY DIFFRACTION q X- Ray Sources Part of MATERIALS SCIENCE & A Learner’s Guide ENGINEERING AN INTRODUCTORY E-BOOK q Diffraction: Bragg’s Law q Crystal Structure Determination Anandh Subramaniam & Kantesh Balani Materials Science and Engineering (MSE) Indian Institute of Technology, Kanpur- 208016 Email: anandh@iitk. ac. in, URL: home. iitk. ac. in/~anandh http: //home. iitk. ac. in/~anandh/E-book. htm Elements of X-Ray Diffraction B. D. Cullity & S. R. Stock Prentice Hall, Upper Saddle River (2001) A very good book for practical aspects X-Ray Diffraction: A Practical Approach C. Suryanarayana & M. Norton Grant Plenum Press, New York (1998) Recommended websites: http: //www. matter. org. uk/diffraction/ http: //www. ngsir. netfirms. com/englishhtm/Diffraction. htm Caution Note: In any chapter, amongst the first few pages (say 5 pages) there will be some ‘big picture’ overview information. This may lead to ‘overloading’ and readers who find this ‘uncomfortable’ may skip particular slides in the first reading and come back to them later.
What will you learn in this ‘sub-chapter’? q How to produce monochromatic X-rays? q How does a crystal scatter these X-rays to give a diffraction pattern? Bragg’s equation q What determines the position of the XRD peaks? Answer) the lattice. q What determines the intensity of the XRD peaks? Answer) the motif. Other relevant topics Laue_picture. ppt line_broadening. ppt other_signals_xray. ppt reciprocal_lattice. ppt structure_factor_calculations. ppt Understanding_diffraction. ppt XRD_lattice_parameter_calculation. ppt XRD_powder_diffraction. ppt XRD_sample_patterns. ppt In a powder pattern (or a given experimental setup) there are many other factors which contribute to the intensity of a given peak. q How to analyze a powder pattern to get information about the lattice type? (Cubic crystal types). q What other uses can XRD be put to apart from crystal structure determination? Grain size determination Strain in the material Determination of solvus line in phase diagrams.
Some Basics q For electromagnetic radiation to be diffracted* the spacing in the grating ( grating refers to a series of obstacles or a series of scatterers) should be of the same order as the wavelength. q In crystals the typical interatomic spacing ~ 2 -3 Å** so the suitable radiation for the diffraction study of crystals is X-rays. q Hence, X-rays are used for the investigation of crystal structures. q Neutrons and Electrons are also used for diffraction studies from materials. q Neutron diffraction is especially useful for studying the magnetic ordering in materials. q Lasers can be used for optical diffraction, when the spacing between the scatterers involved is much larger (~ m, e. g. in optical diffraction grating). q In diffraction we are interested in the elastic interaction of waves with matter. ** If the wavelength is of the order of the lattice spacing, then diffraction effects will be prominent. Three possibilities (regimes) exist based on the wavelength ( ) and the spacing between the scatteres (a). < a transmission dominated. ~ a diffraction dominated. Click here to know more > a reflection dominated. ** Lattice parameter of Cu (a. Cu) = 3. 61 Å dhkl is equal to a. Cu or less than that (e. g. d 111 = a. Cu/ 3 = 2. 08 Å) Click here to know more about this
Generation of X-rays q X-rays can be generated by decelerating electrons. q This is achived by bombarding a target (say Cu) with an electron beam. q The resultant spectrum of X-rays generated (i. e. X-rays versus Intensity plot) consists of intense peaks on a ‘continuous/broad’ background. q The intense peaks can be ‘utilized’ as monochromatic radiation and be used for X-ray diffraction studies. Beam of electrons Target X-rays An accelerating (or decelerating) charge radiates electromagnetic radiation
Mo Target impacted by electrons accelerated by a 35 k. V potential shows the emission spectrum as in the figure below (schematic). The ‘white radiation’ or the continuous radiation is typically not used in XRD studies. X-ray sources with different for doing XRD studies Target Metal Of K radiation (Å) Mo 0. 71 Cu 1. 54 Co 1. 79 Fe 1. 94 Cr 2. 29 The high intensity nearly monochromatic K x-rays can be used as a radiation source for X-ray diffraction (XRD) studies. The term ‘nearly’ has been used as the K has a combination of K 1 and K 2 ‘lines’ and there are other sources of broadening. A monochromator can be used to further decrease the spread of wavelengths in the X-ray beam.
X-ray sources with different for doing XRD studies Elements (KV) Of K 1 radiation (Å) Of K 2 radiation (Å) Of Kβ radiation (Å) Kβ-Filter (mm) Ag 25. 52 0. 55941 0. 5638 0. 49707 Pd (0. 0461) Mo 20 0. 7093 0. 71359 0. 63229 Zr (0. 0678) Cu 8. 98 1. 540598 1. 54439 1. 39222 Ni (0. 017) Ni 8. 33 1. 65791 1. 66175 1. 50014 Co (0. 0158) Co 7. 71 1. 78897 1. 79285 1. 62079 Fe (0. 0166) Fe 7. 11 1. 93604 1. 93998 1. 75661 Mn (0. 0168) Cr 5. 99 2. 2897 2. 29361 2. 08487 V (0. 169) C. Gordon Darwin, Grandson of C. Robert Darwin developed the dynamic theory of scattering of x-rays (a tough theory!) in 1912
When X-rays impinge on a specimen, the interaction can result in various signals/emissions/ effects. The coherently scattered X-rays are the ones important from a XRD perspective. The interaction of the incident X-rays with loosely bound charges leads to incoherent scattering of X-rays (also refered to as Compton modified X-rays). The incident X-rays may knock off of a core level electron of atoms of the material, followed by the transition of an electron from a higher level. This leads to the emission of ‘secondary’ X-rays the fluorescent X-rays. Incident X-rays may also knock out electrons from the material (Compton recoil and photoelectrons). Incident X-rays SPECIMEN Fluorescent X-rays Electrons Scattered X-rays Coherent From bound charges Absorption (Heat) Compton recoil Photoelectrons Incoherent (Compton modified) From loosely bound charges Click here to know more Useful for XRD studies Transmitted beam X-rays can also be refracted (refractive index slightly less than 1) and reflected (at very small angles)
Diffraction Click here to “Understand Diffraction” q Now we shall consider the important topic as to how X-rays interact with a crystalline array (of atoms, ions etc. ) to give rise to the phenomenon known as Xray diffraction (XRD). q Let us consider a special case of diffraction → a case where we get ‘sharp[1] diffraction peaks’. q Diffraction (with sharp peaks) (with XRD being a specific case) requires three important conditions to be satisfied: & (with wavelength ). Radiation related Coherent, monochromatic, parallel waves Sample related Crystalline array of scatterers* with spacing of the order of (~) . Diffraction geometry related Fraunhofer diffraction geometry ( this is actually part of the Fraunhofer geometry) & Aspects related to the wave Diffraction pattern with sharp peaks Aspects related to the material Coherent, monochromatic, parallel wave Crystalline*, ** Aspects related to the diffraction set-up (diffraction geometry) Fraunhofer geometry [1] The intensity- plot looks like a ‘ ’ function (in an ideal situation). * A quasicrystalline array will also lead to diffraction with sharp peaks (which we shall not consider in this text). ** Amorphous material will give broadened (diffuse) peak (additional factors related to the sample can also give a broad peak).
Some comments and notes q The waves could be: electromagnetic waves (light, X-rays…), matter waves** (electrons, neutrons…) or mechanical waves (sound, waves on water surface…). q Not all objects act like scatterers for all kinds of radiation. q If wavelength is not of the order of the spacing of the scatterers, then the number of peaks obtained may be highly restricted (i. e. we may even not even get a single diffraction peak!). q In short diffraction is coherent reinforced scattering (or reinforced scattering of coherent waves). q In a sense diffraction is nothing but a special case of constructive (& destructive) interference. To give an analogy the results of Young’s double slit experiment is interpreted as interference, while the result of multiple slits (large number, diffraction grating) is categorized under diffraction. q Fraunhofer diffraction geometry implies that parallel waves are impinging on the scatterers (the object), and the screen (to capture the diffraction pattern) is placed far away from the object. ** With a de Broglie wavelength Click here to know more about Fraunhofer and Fresnel diffraction geometries
XRD the first step A beam of X-rays directed at a crystal interacts with the electrons of the atoms in the crystal. The electrons oscillate under the influence of the incoming X-Rays and become secondary sources of EM radiation. The secondary radiation is in all directions. The waves emitted by the electrons have the same frequency as the incoming X-rays coherent. The emission can undergo constructive or destructive interference. Schematics
Some points to recon with. . . q We can get a better physical picture of diffraction by using Laue’s formalism* (leading to the Laue’s equations). q However, a parallel approach to diffraction is via the method of Bragg, wherein diffraction can be visualized as ‘reflections’ from a set of planes. q As the approach of Bragg is easier to grasp we shall use that in this elementary text. q We need to do some intriguing mental experiments to utilize the Bragg’s equation (Bragg’s model) with caution. q Let us consider a coherent wave of X-rays impinging on a crystal with atomic planes at an angle to the rays. q Incident and scattered waves are in phase if the: i) in-plane scattering is in phase and ii) scattering from across the planes is in phase. Incident and scattered waves are in phase if In plane scattering is in phase Scattering from across planes is in phase A Laue diffraction pattern with ‘sharp’ peaks. q *Max von Laue’s postulate: If (i) crystals have a periodic arrangement of atoms and if (ii) x-rays of waves (concepts which were not confirmed till then), then crystals should act like a diffraction grating for x-rays. Both these postulates (i & ii) were proved by a single experiment by Laue (published in 1912 which won him the noble prize in 1914).
Let us consider in-plane scattering There is more to this Click here to know more and get introduced to Laue equations describing diffraction Extra path traveled by incoming waves AY Extra path traveled by scattered waves XB These can be in phase if incident = scattered But this is still reinforced scattering and NOT reflection
BRAGG’s EQUATION Warning: we are using ray diagrams in spite of being in the realm of ‘physical optics’ Let us consider scattering across planes Path difference between Ray-1 & Ray 2 Click here to visualize constructive and destructive interference See Note Ӂ later A portion of the crystal is shown for clarity- actually, for destructive interference to occur many planes are required (and the interaction volume of x-rays is large as compared to that shown in the schematic). The scattering planes have a spacing ‘d’. Ray-2 travels an extra path as compared to Ray-1 (= ABC). The path difference between Ray -1 and Ray-2 = ABC = (d Sin + d Sin ) = (2 d. Sin ). For constructive interference, this path difference should be an integral multiple of : n = 2 d Sin the Bragg’s equation. (More about this sooner). The path difference between Ray-1 and Ray-3 is = 2 (2 d. Sin ) = 2 n = 2 n. This implies that if Ray-1 and Ray-2 constructively interfere Ray-1 and Ray-3 will also constructively interfere. (And so forth).
The previous page explained how constructive interference occurs. How about the rays just of Bragg angle? Obviously the path difference would be just off as in the figure below. This will not lead to complete destructive interference and hence this ‘ray’ should exist ! How come these “rays”, which are just of the Bragg angle, ‘go missing’? The explanation can be found in the link: understanding diffraction. Briefly, as we go deeper into the crystal we will accrue path differences and the ray from plane -1 will be exactly out of phase (path difference of /2) with a ray scattered from this ‘deep seated plane’ and hence will ‘go missing’. Click here to understand how destructive interference of just ‘of-Bragg rays’ occur Interference of ‘Ray-1’ with ‘Ray-2’ Note that they ‘almost’ constructively interfere! Which remains same thereafter (like in the BB’ plane)
Q&A How to ‘see’ that path difference increases with angle? Clearly A’BC’ > ABC
Laue versus Bragg* In Laue’s picture constructive and destructive interference at various points in space is computed using path differences (and hence phase differences) given a crystalline array of scatterers. Bragg simplified this picture by considering this process as ‘reflections from atomic planes’. (More about the Bragg’s viewpoint soon). q *Sir William Henry Bragg and William Lawrence Bragg (this won the father and son team the noble prize in 1915). Since there are two Braggs involved, wherever we refer to the law or the equation it has be Braggs’ (and not Bragg’s as I have done in this chapter) [1] “The important thing in science is not so much to obtain new facts as to discover new ways of thinking about them”. William Lawrence Bragg. [1] http: //www. nobelprize. org/nobel_prizes/physics/laureates/1915/index. html
Reflection versus Diffraction Though diffraction (according to Bragg’s picture) has been visualized as a reflection from a set of planes with interplanar spacing ‘d’ diffraction should not be confused with reflection (specular reflection). Reflection Diffraction Occurs throughout the bulk Occurs from surface (though often the penetration of x-rays in only of the order of 10 s of microns in a material) Takes place at any angle Takes place only at Bragg angles ~100 % of the intensity may be reflected Small fraction of intensity is diffracted Note: X-rays can ALSO be reflected at very small angles of incidence Jump Quantum Planes are imaginary constructs If n = 2 d Sin is the Bragg’s equation, then what is the (famous) Braggs’ law? Braggs Law The diffracted beam appears to be specularly reflected from a set of crystal lattice planes. Angle of incidence = Angle of reflection.
Understanding the Braggs’ equation q n = 2 d Sin The equation is written better with some descriptive subscripts: If this equation is satisfied, then is Bragg This (hkl) is in real space and hence the brackets we will soon drop this brackets! q n is an integer and is the order of the reflection (i. e. how many wavelengths of the X-ray go on to make the path difference between planes). Note: Ӂ Note: if hkl reflection (corresponding to n=1) occurs at hkl then 2 h 2 k 2 l reflection (n=2) will occur at a higher angle 2 h 2 k 2 l. q Bragg’s equation is a negative statement If Bragg’s eq. is NOT satisfied NO ‘reflection’ can occur If Bragg’s eq. is satisfied ‘reflection’ MAY occur (How? - we shall see this a little later). q The interplanar spacing appears in the Bragg’s equation, but not the interatomic spacing ‘a’ along the plane (which had forced incident = scattered); but we are not free to move the atoms along the plane ‘randomly’ click here to know more. q For large interplanar spacing the angle of reflection tends towards zero → as d increases, Sin decreases (and so does ). The smallest interplanar spacing from which Bragg diffraction can be obtained is /2 → maximum value of is 90 , Sin is 1 from Bragg equation d = /2.
Order of the reflection (n) For Cu K radiation ( = 1. 54 Å) and d 110= 2. 22 Å n Sin = n /2 d 1 0. 34 20. 7º • First order reflection from (110) 110 2 0. 69 43. 92º • Second order reflection from (110) planes 110 • Also considered as first order reflection from (220) planes 220 Relation between dnh nk nl and dhkl e. g. In XRD nth order reflection from (h k l) is “considered” as 1 st order reflection from (nh nk nl). Alternate way of writing Bragg’s equation Note: the ‘n’ is “absorbed” both in the ‘d’ and the . We explicitly write nh nk nl to show that this reflection occurs at a different angle (higher angle as compared to h k l ).
Hence, (100) planes are a subset of (200) planes All these form the (200) set Important point to note: In a simple cubic crystal, 100, 200, 300… are allowed ‘reflections’. But, there are no atoms in the planes lying within the unit cell! Though, first order reflection from 200 planes is equivalent (mathematically) to the second order reflection from 100 planes; for visualization purposes of scattering, this is better thought of as the later process (i. e. second order reflection from (100) planes). Note: Technically, in Miller indices we factor out the common factors. Hence, (220) 2(110) (110). In XRD we extend the usual concept of Miller indices to include planes, which do not pass through lattice points (e. g. every alternate plane belonging to the (002) set does not pass through lattice points) and we allow the common factors to remain in the indices.
I have seen diagrams like in Fig. 1 where rays seem to be scattered from nothing! Funda Check What does this mean? q Few points are to be noted in this context. The ray ‘picture’ is only valid in the realm of geometrical optics, where the wave nature of light is not considered (& also the discrete nature of matter is ignored; i. e. matter is treated like a continuum). In diffraction we are in the domain of physical optics. q The wave impinges on the entire volume of material including the plane of atoms (the effect of which can be quantified using the atomic scattering power* and the density of atoms in the plane). Due to the ‘incoming’ wave the atomic dipoles are set into oscillation, which further act like emitter of waves q In Bragg’s viewpoint, the atomic planes are to be kept in focus and the wave (not just a ray) impinges on the entire plane (some planes have atoms in contact and most have atoms, which are not in contact along the plane see Fig. 2). Wave impinging on a crystal (parallel wave-front). (Note there are no ‘rays’. A vector drawn normal to the wavefront, in the direction of propagation can be considered as the ray) Fig. 2 Fig. 1 ve f wa no ectio Dir ? ? * To be considered later A plane in Bragg’s viewpoint can be characterized by two factors: (a) atomic density (atoms/unit area on the plane), (b) atomic scattering factor of the atoms.
More about the Bragg’s viewpoint “It is difficult to give an explanation of the nature of the semi-transparent layers or planes that is immediately convincing, as they are a concept rather than a physical reality. Crystal structures, with their regularly repeating patterns, may be referred to a 3 D grid and the repeating unit of the grid, the unit cell, can be found. The grid may be divided up into sets of planes in various orientations and it is these planes which are considered in the derivation of Bragg’s law. In some cases, with simple crystal structures, the planes also correspond to layers of atoms, but this is not generally the case. See Section 1. 5 for further information. [1] Some of the assumptions upon which Bragg’s law is based may seem to be rather dubious. For instance, it is known that diffraction occurs as a result of interaction between X-rays and atoms. Further, the atoms do not reflect X-rays but scatter or diffract them in all directions. Nevertheless, the highly simplified treatment that is used in deriving Bragg’s law gives exactly the same answers as are obtained by a rigorous mathematical treatment. We therefore happily use terms such as reflexion (often deliberately with this alternative, but incorrect, spelling!) and bear in mind that we are fortunate to have such a simple and picturesque, albeit inaccurate, way to describe what in reality is a very complicated process. ” [1] Anthony R West, Solid State Chemistry and its Applications, Second Edition, John Wiley & Sons Ltd. , Chichester, 2014.
Funda Check How is it that we are able to get information about lattice parameters of the order of Angstroms (atoms which are so closely spaced) using XRD? q Diffraction is a process in which ‘linear information’ (the d-spacing of the planes) is converted to ‘angular information’ (the angle of diffraction, Bragg). q If the detector is placed ‘far away’ from the sample (i. e. ‘R’ in the figure below is large) the distances along the arc of a circle (the detection circle) get amplified and hence we can make ‘easy’ measurements. q This also implies that in XRD we are concerned with angular resolution instead of linear resolution. Later we will see that in powder diffraction this angle of deviation (2 ) is plotted instead of . Note: angular variations lead to phase and path differences.
Forward and Back Diffraction Here a guide for quick visualization of forward and backward scattering (diffraction) is presented. Diffraction angles less than 45 correspond to forward diffraction. * Only one plane of the set is drawn in most cases.
is the angle between the incident X-rays and What is (theta) in the Bragg’s equation? the set of parallel atomic planes (which have a Funda Check spacing dhkl). Usually, in this context implies Bragg (i. e. the angle at which Bragg’s equation is satisfied). It is NOT the angle between the X-rays and the sample surface (note: specimens could be irregular & could have a rough surface). It is also not the angle between the plane ‘normal’* and the incident ‘rays’ this is the angle usually considered in geometrical optics (reflection, refraction, . . . ). Another view, where the (13) plane is shown in all the crystals * Usually, the ‘plane’ in optics is the sample surface (also, the sample is usually a glass). E. g. refraction through as prism. In the figure the sample has a irregular boundary and consists of many crystallites (or grains). Each of these crystallites have an infinite number of lattice planes. The incident rays form an angle w. r. t to the (13) planes for the chosen crystallite (which is now the Bragg’s angle). The (13) plane in other crystallites may not be favourably oriented for Bragg diffraction.
Funda Check What do the terms ‘sharp’ and ‘diffuse’ mean with regard to peaks and scattering? q Sharp peaks are obtained from crystalline materials (using parallel, monochromatic radiation), while typically a broad peak is obtained from an amorphous material. The sharp peak is referred to as a Bragg peak. q Defects (like point defects, thermal vibration, partial ordering) in the crystal can give rise to low intensity scattering between the Bragg peaks. This is termed as diffuse scattering. btained eaks are o t sharp p In contras tals from crys Note the broad peak SAD pattern (TEM ) from the amorphous sample XRD pattern showing the formation of amorphous structure in the suction cast (Cu 64 Zr 36)96 Al 4 alloy
The missing ‘reflections’ q We had mentioned that Bragg’s equation is a negative statement: i. e. just because Bragg’s equation is satisfied a ‘reflection’ may not be observed. q Let us consider the case of Cu K radiation ( = 1. 54 Å) being diffracted from (100) planes of Mo (BCC, a = 3. 15 Å = d 100). But this reflection is absent in BCC Mo The missing reflection is due to the presence of additional atoms in the unit cell (which are positions at lattice points) which we shall consider next. This ‘issue’ arises because so far we have talked about (hkl) planes and nothing about atoms on those planes or within the unit cell. The wave scattered from the middle plane is out of phase with the ones scattered from top and bottom planes. I. e. if the green rays are in phase (path difference of ) then the red ray will be exactly out of phase with the green rays (path difference of /2). The scattering power of these two planes (the green and the red) are identical, as both the planes contain the same atom and have 1 atom per a 2 area.
Continuing with the case of BCC Mo… However, the second order reflection from (100) planes (which is equivalent to the first order reflection from the (200) planes) is observed. This is because if the green rays have a path difference of 2 then the red ray will have path difference of → which will still lead to constructive interference! Funda Check Why does the 110 reflection not go missing? (Why is it present? ) Let us look at the (110) planes in projection. Note that (110)blue coloured planes existed before and after introducing an atom at unit cell centre at (½, ½ ½)grey coloured. Thus lattice centering does not lead to any waves being scattered out of phase.
Important points Presence of additional atoms/ions/molecules in the UC at lattice points (as we may chose a non-primitive unit cell) or as a part of the motif can alter the intensities of some of the reflections. Some of the reflections may even go missing. q Position of the ‘reflections’/‘peaks’ tells us about the lattice type. q The Intensities tells us about the motif. Lattice point
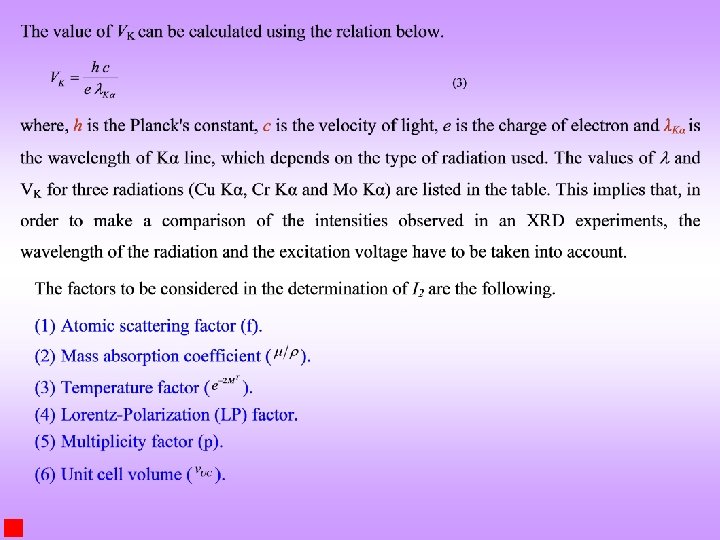
Intensity of the Scattered Waves Bragg’s equation tells us about the position of the diffraction peaks (in terms of ) but tells us nothing about the intensities. The intensities of the peaks depend on many factors as considered here. Scattering by a crystal can be understood in three steps A Electron Polarization factor To understand the scattering from a crystal leading to the ‘intensity of reflections’ (and why some reflections go missing), three levels of scattering have to be considered: 1) scattering from electrons 2) scattering from an atom 3) scattering from a unit cell Click here to know the details B Atomic scattering factor (f) Structure Factor (F): The resultant wave scattered by all atoms of the unit cell The Structure Factor is independent of the shape and size of the unit cell; but is dependent on the position of the atoms/ions etc. within the cell C Unit cell (uc) Structure factor (F) Click here to know more about Structure factor calculations & Intensity in powder patterns
The concept of a Reciprocal lattice and the Ewald Sphere construction: Reciprocal lattice and Ewald sphere constructions are important tools towards understanding diffraction. (especially diffraction in a Transmission Electron Microscope (TEM)) A lattice in which planes in the real lattice become points in the reciprocal lattice is a very useful one in understanding diffraction. Structure factor calculations give us the intensities which decorate the reciprocal lattice to give us the reciprocal crystal. click here & here to go to a detailed description of these topics. Click here to know more about Structure Factor Calculations Reciprocal Lattice & Ewald Sphere construction
Selection / Extinction Rules Click here to see the derivations of selection rules: Structure factor calculations As we have noted before even if Bragg’s equation is satisfied, ‘reflections may go missing’ this is due to the presence of additional atoms in the unit cell. These atoms may be present at ‘additional’ lattice sites or as a part of the motif. In the case of DC crystal, in addition to the restrictions/conditions imposed for the FCC lattice, further conditions/restrictions are imposed due to presence of atoms as a part of the motif. The reflections present and the missing reflections due to additional atoms in the unit cell are listed in the table below. Bravais Lattice* Reflections which may be present Reflections necessarily absent Simple All None Body centred (h + k + l) even (h + k + l) odd Face centred h, k and l unmixed (i. e. all even or all odd) h, k and l mixed End centred (C centred) h and k unmixed (centering along ‘l’ index) h and k mixed Additional atoms at lattice positions Additional atoms w. r. t FCC lattice as a part of the motif. Structure Allowed Reflections SC crystal All BCC crystal (h + k + l) even CCP crystal h, k and l unmixed DC crystal Either, h, k and l are all odd or all are even & (h + k + l) divisible by 4 * Note that the lattice has to be decorated with ‘atomic species’ for diffraction to actually occur (lattices by themselves do not give Bragg diffraction !!!!).
Allowed reflections in SC*, CCP, BCC* & DC crystals * lattice decorated with monoatomic/monoionic motif h 2 + k 2 + l 2 SC FCC/CCP 1 100 2 110 3 111 4 200 5 210 6 211 DC 110 111 200 211 7 Cannot be expressed as (h 2+k 2+l 2) BCC Note these reflections were present in CCP 8 220 9 300, 221 10 310 11 311 12 222 13 320 14 321 220 310 311 222 321 15 16 400 17 410, 322 18 411, 330 19 331 400 400 411, 330 331
Allowed reflections in HCP crystals Reflections which may be present Reflections necessarily absent l even, (h+2 k) 3 n l odd, (h+2 k) = 3 n
Q&A What happens to the reflections? (i) BCC: 111 BCC. (ii) FCC: 100, 111, 200. (iii) DC: 100, 110, 200. q BCC. 111. On introducing the atom at the body centre a new orange atomic plane/hexagon is created. This plane is exactly midway between the blue and green planes. The difficult part is to fathom out the atomic density of this plane. The green plane is made of 4 smaller and it contains ½ an atom (3 1/6). The orange plane is not space filling and coupled with the maroon triangles becomes so. Each maroon triangle is shared between 3 orange hexagons and hence the part belonging to each orange hexagon is 6 1/3 = 2. The hexagon is itself made of 6 and contains 1 atom. So the planar density is 1 atom per (6+2). Given that the atomic densities of these planes are identical, it implies that the 111 reflection will go missing. Missing. The mid plane is made of one orange hexagon and a maroon shared between 3 hexagons. Hence, the atomic density is Atoms/area Green plane has The symbol refers to one small triangle Continued…
q FCC. 100. Fig. 1. On introducing face centering lattice positions, a new orange plane is created exactly midway between the green and the blue planes. The atomic density of all these planes are 2 atoms per a 2. Missing. 110. Fig. 2. When we introduce face centring atoms (orange colour), some of these sit on the original (110) planes (grey lines in projection), while new planes (orange lines in projection) also created, which are midway between the grey planes. The atomic density of the grey planes are 2 atoms per a 2 2 area. The area of the orange planes are 1 atom per a 2 2/2 area (i. e. identical to the grey planes). Missing. 111. Fig. 3. When we introduce atoms at face centres, these lie on pre-existing planes (the blue and green planes); hence, the 111 reflection will be present in FCC crystals. Present. 200. Fig. 4. The 200 reflection is the 2 reflection from the 100 planes. This implies that the path difference between the grey planes is one and hence this will be present. Present. Fig. 1 (100) Fig. 2 (110) Fig. 3 (111) Grey plane has Orange plane has Fig. 4 (200) Continued…
q DC. For DC we can start with the selection rules for FCC and further work out the effect of an additional atom, which is part of the motif. This implies that 100 and 110 reflections will be missing. 100. Missing as per the rules of the FCC lattice. Missing. 110. Missing as per the rules of the FCC lattice. Missing. 200. This reflection is present in the FCC lattice, but now we have to consider the effect of the additional atoms, which are part of the motif. The grey planes scatter in phase (the 200 planes). On the introduction of orange atoms at (¼. ¼, ¼) and equivalent positions a new plane has to be drawn. This plane will scatter exactly out of phase ( /2) with the grey planes and hence the 200 reflection will be missing in the DC structure. Missing. Path difference accrued
Q&A How do we get the lattice parameter of a cubic crystal from a XRD experiment? q The broad process followed to ‘go from’ a cubic crystal to get lattice parameters is as below. Crystal with atoms Diffraction experiment Crystal to 2 2 information (Intensity-2 plot) Missing reflections Get lattice type (SC, BCC, FCC, . . . ) 2 to ‘d’ Bragg’s equation Get ‘d’ spacing Equation connecting ‘d’ to ‘a’ (lattice parameter) ‘d’ to ‘a’ Get ‘a’ (lattice parameter) Note: The ‘line’ (peak) intensities will be required to determine the motif. The intensities are determined by structure factor calculations and by including other factors which are specific to the experimental setup
Crystal structure determination q As diffraction occurs only at specific Bragg angles, the chance that a reflection is observed when a crystal is irradiated with monochromatic X-rays at a particular angle is small (added to this the diffracted intensity is a small fraction of the beam used for irradiation). q The probability to get a diffracted beam (with sufficient intensity) is increased by either varying the wavelength ( ) or having many orientations (rotating the crystal or having multiple crystallites in many orientations). q The three methods used to achieve high probability of diffraction are shown below. Monochromatic X-rays Many s (orientations) Powder specimen Powder Method Panchromatic X-rays Single Laue Technique Monochromatic X-rays Varied by rotation Rotating Crystal Method Only the powder method (which is commonly used in materials science) will be considered in this text.
THE POWDER METHOD q In the powder method the specimen has crystallites (or grains) in many orientations (usually random). q Monochromatic* X-rays are irradiated on the specimen and the intensity of the diffracted beams is measured as a function of the diffracted angle. q The powder method can be used for the following basic purposes: (i) determine the lattice type (BCC, FCC. . . ), (ii) determine the lattice parameter, (iii) compare with standard listing** to determine the phase(s) present. Other uses include the determination of crystallite sizes, micro-strain, phase fractions, etc. (1) Cubic crystal (2) in (1) * In reality this is true only to an extent In this elementary text we shall consider cubic crystals.
The ratio of (h 2 + k 2 + l 2) derived from extinction rules (earlier page). As we shall see soon the ratios of (h 2 + k 2 + l 2) is proportional to Sin 2 which can be used in the determination of the lattice type. SC ratio 1 100 02 + 02 12 + 2 110 12 + 02 12 + 3 111 12 + 02 12 + 4 200 02 + 02 22 + 5 210 12 + 02 22 + 6 211 12 + 12 22 + 8 220 22 + 02 22 + BCC 2 4 6 8 10 12 14 ratio 1 2 3 4 5 6 7 110 200 211 220 310 222 321 3 4 8 11 12 … 111 200 220 311 222 3 8 11 16 … 111 220 311 400 FCC ratio DC … … Note that we have to consider the ratio of only two lines to distinguish FCC and DC. I. e. if the ratios are 3: 4 then the lattice is FCC. But, to distinguish between SC and BCC we have to go to 7 lines!
POWDER METHOD In the powder sample there are crystallites in different ‘random’ orientations (a polycrystalline sample too has grains in different orientations) The coherent x-ray beam is diffracted by these crystallites at various angles to the incident direction All the diffracted beams (called ‘reflections’) from a single plane, but from different crystallites lie on a cone. Depending on the angle there are forward and back reflection cones. A diffractometer can record the angle of these reflections along with the intensities of the reflection The X-ray source and diffractometer move in arcs of a circle- maintaining the Bragg ‘reflection’ geometry as in the figure (right) Usually the source is Different cones for different reflections Also called Debye ring fixed and the detector and sample are rotated
How to visualize the occurrence of peaks at various angles It is ‘somewhat difficult’ to actually visualize a random assembly of crystallites giving peaks at various angels in a XRD scan. The figures below are expected to give a ‘visual feel’ for the same. [Hypothetical crystal with a = 4Å is assumed with =1. 54Å. Only planes of the type xx 0 (like (100, 110)are considered]. T rota he sa ting mpl e and o det nly th is not arc ector e sou s of m r a ci ove i ce rcle n Random assemblage of crystallites in a material As the scan takes place at increasing angles, planes with suitable ‘d’, which diffract are ‘picked out’ from favourably oriented crystallites h 2 hkl d Sin( ) 1 100 4. 00 0. 19 11. 10 2 110 2. 83 0. 27 15. 80 3 111 2. 31 0. 33 19. 48 4 200 2. 00 0. 39 22. 64 5 210 1. 79 0. 43 25. 50 6 211 1. 63 0. 47 28. 13 8 220 1. 41 0. 54 32. 99 9 300 1. 33 0. 58 35. 27 10 310 1. 26 0. 61 37. 50 For convenience the source may be stationary (and the sample and detector may rotate– but the effect is equivalent)
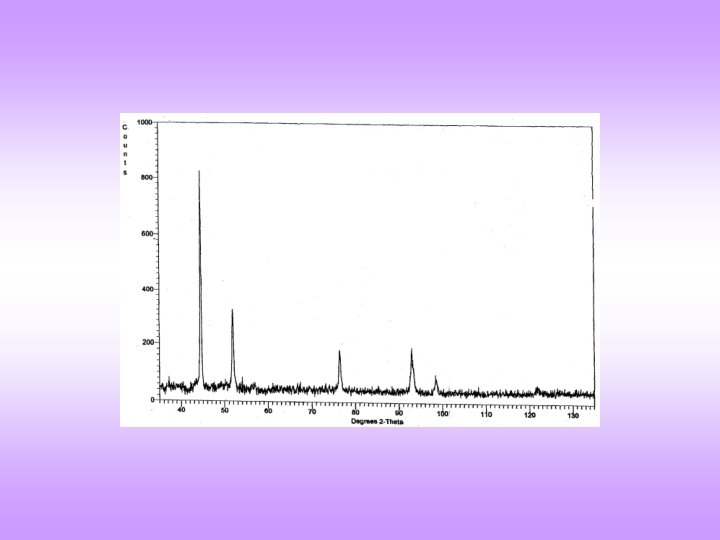
Determination of Crystal Structure from 2 versus Intensity Data in Powder Method q In the power diffraction method a 2 versus intensity (I) plot is obtained from the diffractometer (and associated instrumentation). q The ‘intensity’ is the area under the peak in such a plot (NOT the height of the peak). The information of importance obtained from such a pattern is the ‘relative intensities*’ and the absolute value of the intensities is of little importance (the longer we irradiate the sample the more will be the intensity under the peak) (for now). I is really diffracted energy (as Intensity is Energy/area/time). * Relative intensity: Intensity of any peak divided by the intensity of the ‘strongest’ peak. Intensity (I) has units of [Energy/area/time] → but here it is plotted as arbitrary units. The dwell time at each angle should be sufficient to get a high “peak to background” ratio. Powder diffraction pattern from Al Radiation: Cu K , = 1. 54 Å This diffraction pattern resides in reciprocal/Fourier space & hence, increasing ‘d’ is to the left Increasing ‘d’ This is peak (sometimes called a line- a hangover from Debye Scherrer camera usage) In a powder XRD pattern the relative intensities of the peaks are important. 2 is the angle of deviation of X-rays. Usually in degrees ( ) Noisy background. Increasing
Note (again) that the x-axis is 2 , which is the angle of deviation of the X-rays q A table is prepared as below to tabulate the data and make calculations to find the crystal structure (restricting ourselves to cubic crystals for the present). Determination of Crystal Structure (lattice type) from 2 versus Intensity Data The following table is made from the 2 versus Intensity data (obtained from a XRD experiment on a powder sample (empty starting table of columns is shown below- completed table shown later). n 2 → Intensity Sin 2 ratio
Powder diffraction pattern from Al (ideal picture) Radiation: Cu K , = 1. 54 Å These are Miller indices in reciprocal space (these are not planes they correspond to panes in real space) Note: This is a schematic pattern In real patterns peaks or not idealized peaks broadened Increasing splitting of peaks with g ( 1 & 2 peaks get resolved in the high angle peaks) Peaks are all not of same intensity No brackets are used around the indexed numbers (the peaks correspond to planes in the real space) Note that there are no brackets around the indices!
Radiation: Cu K , = 1. 54 Å Powder diffraction pattern from Al In low angle peaks K 1 & K 2 peaks merged 400 222 311 220 200 111 Note: Peaks or not idealized peaks broadened. Increasing splitting of peaks with g . Peaks are all not of same intensity. There is a ‘noisy’ background. Here the background is subtracted (else we may have a varying background). K 1 & K 2 peaks resolved in high angle peaks (in 222 and 400 peaks this can be seen)
Funda Check How are real diffraction patterns different from the ‘ideal’ computed ones? q We have seen real and ideal diffraction patterns. In ideal patterns the peaks are ‘ ’ functions. q Real diffraction patterns are different from ideal ones in the following ways: Peaks are broadened Could be due to instrumental, residual ‘non-uniform’ strain (microstrain), grain size etc. broadening. Peaks could be shifted from their ideal positions Note peak splitting has not been included here as this comes from ‘symmetry lowering’ (i. e. crystal with lower symmetry) Could be due to uniform strain→ macrostrain. Relative intensities of the peaks could be altered Could be due to texture in the sample. Presence of diffuse intensity* between the Bragg peaks Diffuse intensity can arise due to atomic disorder and thermal vibrations. * Diffuse intensity. In the powder diffraction pattern, usually there exists low intensity ‘noise’ between the Bragg peaks. This has origins which do not relate to the sample. In addition to this ‘experimental noise’, diffuse intensity (typically much lower in magnitude) can arise due to defects in the sample like atomic disorder and thermal vibrations. Instrumental broadening Peak Broadening Small crystallite size Crystal defects (‘bent’ planes), etc. Macro-strain will lead to peak shift, while micro-strain (e. g. due to dislocations will lead to peak broadening) Including those coming from strain fields associated with these defects Click here to know more
Funda Check What is the maximum value of possible (experimentally)? At = 90 the ‘reflected ray’ is opposite in direction to the incident ray. Beyond this angle, it is as if the source and detector positions are switched. 2 max is 180. Ans: 90
Funda Check Which crystal defects give rise to Bragg peak broadening and which ones result in diffuse scattering? q The intensity in a diffraction pattern resides under the Bragg peaks and between the Bragg peaks. The intensity between the Bragg peaks is called diffuse scattering and is of much lower magnitude than the Bragg peaks. As we have noted, the Bragg peak is typically not a ‘ ’ function, but is broadened due to various reasons. q Some crystal defects give rise to only broadening and other lead to diffuse scattering in addition to broadening. q Thermal vibration of atoms give rise to the following effects: (i) decrease in peak intensity, (ii) increase in diffuse scattering between the peaks, (iii) no peak broadening & (iv) peak displacement due to thermal expansion (increase in lattice parameter). q Point defects will lead to increased diffuse scattering. Point defects include the formation of dilute alloys and the presence of vacancies. Vacancies will lead to slight peak shift due to a decrease in the lattice parameter. q Defects like dislocations (& stacking faults) has the following effects: (i) peak broadening, (ii) no decrease in the intensity, (iii) increase in diffuse scattering. q Decrease in crystallite size leads to: (i) peak broadening, (ii) decrease in the intensity. q Formation of a concentrated disordered solid solution leads to: (i) peak broadening, (ii) increase in diffuse scattering. The intensity of the peaks will depend on the average atomic scattering factor. The peak position will depend on the average lattice parameter.
Funda Check What will determine how many peaks I will get? q 1) smaller the wavelength of the X-rays, more will be the number of peaks possible. From Bragg’s equation: [ =2 d. Sin ], (Sin )max will correspond to dmin. (Sin )max=1. Hence, dmin= /2. Hence, if is small then planes with smaller d spacing (i. e. those which occur at higher 2 values) will also show up in a XRD patter (powder pattern). Given that experimentally cannot be greater than 90. q 2) Lattice type in SC we will get more peaks as compared to (say) FCC/DC. Other things being equal. q 3) Lower the symmetry of the crystal, more the number of peaks (e. g. , in tetragonal crystal the 100 peak will lie at a different 2 as compared to the 001 peak).
Determination of Crystal Structure (lattice type) from 2 versus Intensity Data Solved example 1 Let us assume that we have the 2 versus intensity plot from a diffractometer. To know the lattice type we need only the position of the peaks (as tabulated below). # 2 Sin 2 ratio Index d 1 38. 52 19. 26 0. 33 0. 11 3 111 2. 34 2 44. 76 22. 38 0. 14 4 200 2. 03 3 65. 14 32. 57 0. 54 0. 29 8 220 1. 43 4 78. 26 39. 13 0. 63 0. 40 11 311 1. 22 5 82. 47 41. 235 0. 66 0. 43 12 222 1. 17 6 99. 11 49. 555 0. 76 0. 58 16 400 1. 01 7 112. 03 56. 015 0. 83 0. 69 19 331 0. 93 8 116. 60 58. 3 0. 85 0. 72 20 420 0. 91 9 137. 47 68. 735 0. 93 0. 87 24 422 0. 83 10 163. 78 81. 89 0. 98 27 333 0. 78 From the ratios in column 6 we conclude that FCC Note that Sin cannot be > 1 Note Using We can get the lattice parameter which correspond to that for Al Note: Error in d spacing decreases with → so we should use high angle lines for lattice parameter calculation Click here to know more XRD_lattice_parameter_calculation. ppt
Solved example 2 Another example Given the positions of the Bragg peaks we find the lattice type Dividing Sin 2 by 0. 134/3 = 0. 044667 Whole number ratios Index 3 111 2 → Sin 2 Ratios of Sin 2 1 21. 5 0. 366 0. 134 1 2 25 0. 422 0. 178 1. 33 3. 99 4 200 3 37 0. 60 0. 362 2. 70 8. 10 8 220 4 45 0. 707 0. 500 3. 73 11. 19 11 311 5 47 0. 731 0. 535 4 11. 98 12 222 6 58 0. 848 0. 719 5. 37 16. 10 16 400 7 68 0. 927 0. 859 6. 41 19. 23 19 331 FCC lattice
Comparison of diffraction patterns of SC, BCC & B 2 structures Click here More Solved Examples on XRD Click here
Funda Check What happens when we increase or decrease ? We had pointed out that ~ a is preferred for diffraction. Let us see what happens if we ‘drastically’ increase or decrease . (This is only a thought experiment as obtaining monochormatic x-rays with any arbitrary wavelength and good intensity is ‘difficult’!!) With Cu. K = 1. 54 Å If we ~double → we get too few peaks If we make small→ all the peaks get crowded to small angles And the detector may not be able to resolve these peaks if they come too close!
Determination of the phases present using the powder diffraction data q Most often materials scientists use powder patterns to determine the phases present in a sample. In this ‘finger printing’ technique, the data obtained (I versus 2 ) is compared with standard tables (e. g. the ICPD or the JCPDS data listing) to know the phases present. q When only a single phase is present, the task is reasonably simple. However, in the presence of multiple phases, the process can be tricky. q For a perfect match with the data tables, both the relative intensity and the peak positions (2 ) have to match ‘perfectly’. However, w. r. t data from real samples, the relative intensity will be typically different from that in the tables. This is usually due to crystallographic texture (i. e. the lack of random orientations of crystallites and the presence of ‘preferred orientation’). Crystallographic texture typically arises from metal deformation processes like rolling, extrusion, etc. The lack of sufficient number of crystallites (in random orientations) can also lead to a ‘mismatch’ between the observed relative intensity and that in the ICDD tables. q The shift of Bragg peaks from that in the tables (ICDD) can arise due to presence of impurities in the sample, which form a solid solution (this is assuming that there is no ‘offset error’ in the instrumentation). q The typical process of matching the data obtained with the database (finger printing) starts with knowing the elements present in the sample (say an alloy) and having the list of phases that can form in the system (the list of phases can be obtained from a phase diagram or a crystallography database (like the Pearson’s crystallographic database)). The number of phases to be dealt with can be reduced by knowing the processing conditions and its implication on the kind of phases which are expected to form.
q It should be noted that, even if a perfect match for all the peaks cannot be made, the 2 position of ‘most’ of the high intensity peaks should match. q A definitive identification cannot be made by just matching a few peaks. q The process (of identification of phases) gets very complicated when: (i) multiple phases are present and/or (ii) there exist one or more similar phases (in terms of their XRD pattern) and one (or more) of them is (are) present in your sample. q In any case XRD cannot be used to rule the presence of phases, as the sensitivity of the technique for phases present in less than 1% (say by vol. %) is not good. Powder XRD data is best used in conjunction with other characterization techniques like SEM and TEM. q Typically, powder data is not used for the identification of previously unknown phases. This is best done with single crystal data. Techniques like Rietveld refinement can be used for the determination of unknown crystal structures using powder data (especially if the option of single crystal experiment is ruled out). q Rietveld refinement can also be used to obtain the phase fractions (i. e. the fractions of various phases present in the sample). Software like ‘Fullprof’ can be used for this purpose.
Other uses of XRD q XRD is a versatile tool, which can be used to obtain many kinds of information about the sample. A few are listed in the figure below. q Often there are competing tools which can give a better result. E. g. TEM is a better tool to obtain the strain distribution around a coherent precipitate as compared to XRD. However, often the advantage of XRD is the ‘spatially averaged’ data and the ‘large scale sampling’ (i. e. sampling can be from a large volume as compared to TEM). Applications of XRD Bravais lattice determination Lattice parameter determination We have already seen these applications Determination of solvus line in phase diagrams Long range order Crystallite size and Strain Click here to know more Determine if the material is amorphous or crystalline Next slide And More….
Schematics Determine if the material is amorphous or crystalline Intensity → Crystal Schematic of difference between the diffraction patterns of various phases Sharp peaks 0 90 Diffraction angle (2 ) → 180 Intensity → Monoatomic gas Intensity → No peak Liquid / Amorphous solid Diffraction angle (2 ) → 90 0 180 Diffuse Peak Diffraction angle (2 ) → 0 90 180 Continued…
Amorphous solid Actual diffraction pattern from an amorphous solid XRD pattern showing the formation of amorphous structure in the suction cast (Cu 64 Zr 36)96 Al 4 alloy. A amorphous solid, which shows glass transition in a Differential Scanning Calorimetry (DSC) plot is also called a glass. In ‘general usage’ a glass may be considered equivalent to a amorphous solid (at least loosely in the structural sense). In the XRD pattern obtained from a glass, the sharp peaks (which are present in the XRD pattern from crystals) are missing. Only a broad diffuse peak survives→ the peak corresponds to the average spacing between atoms which the diffraction experiment ‘picks out’
Funda Check What is the minimum spacing between planes possible in a crystal? How many diffraction peaks can we get from a powder pattern? Let us consider a cubic crystal (without loss in generality) As h, k, l increases, ‘d’ decreases we could have planes with infinitesimal spacing With increasing indices the interplanar spacing decreases The number of peaks we obtain in a powder diffraction pattern depends on the wavelength of x-ray we are using. Planes with ‘d’ < /2 are not captured in the diffraction pattern. These peaks with small ‘d’ occur at high angles in diffraction pattern.
Q&A How to increase the number of peaks in a XRD pattern? q We have noted that (e. g. for DC crystal) the number of available peaks in the 2 regime could be insufficient for a given analysis. q The number of peaks can be increased in two ways: 1) using Mo Kα instead of Cu Kα, 2) first obtain pattern with β filter and then remove the filter to get more lines. Scan rate: 2 /min Step size: 0. 02 111 311 220 200 Cu K , = 1. 54 Å Material: Co 400 222 Note increase in the background with angle. 111 200 few only d serve b o s k pea Cr K , = 2. 29 Å Target Metal Of K radiation (Å) Mo 0. 71 Cu 1. 54 Co 1. 79 Fe 1. 94 Cr 2. 29
Q&A In early parts of the chapter, we had noted that we have many sources of nearly monochromatic X-rays are available. Why are so many radiation sources needed? There are two main reasons why we need some options at our disposal. 1) Some sources ‘fluoresce’ with in conjunction with some elements in the material (e. g. Co fluoresces with Cu K ). This inelastic process gives rise to an increased background and hence a lower signal to background ratio. In the case of Co in the sample, Cr K radiation can be used. 2) Smaller wavelengths of radiation give rise to more peaks in a powder XRD pattern. Cu K gives more peaks as compared to Cr K radiation. (The point we saw previously). Scan rate: 2 /min Step size: 0. 02 111 220 200 Cu K , = 1. 54 Å Also note: low peak to background ratio. Cr K , = 2. 29 Å Material: Co 311 222 400 Note increase in the background with angle due to fluorescence (Co with Cu K radiation) 111 200 No fluorescence (Co with Cr K )
Funda Check What is the natural variable for plotting powder diffraction data? q The usual plot is between Intensity and 2. It is not but 2 ; as this is the angle of deviation of the incident beam. Could it have not been ? q Usually, the variation of atomic scattering factor (f) is plotted with Sin /. Hence, Sin / can also serve as a ‘natural variable’ for the abscissa [Units: /Å 1]. Braggs’ equation can be rewritten as: 111 Target Metal Of K radiation (Å) Cu K 1. 54 Cr K 2. 29 200 Coinciding peaks XRD powder pattern taken from a Cu sample with two sources of radiation: Cu. K and Cr. K . As expected the peaks coincide if plotted with Sin / as the abscissa (as now this is a measure of dhkl.
Q&A What are the ways can we represent dimensions and vectors in a diffraction pattern? The diffraction pattern resides in the reciprocal space or Fourier space. Reciprocal lattice points are decorated by intensities to create a reciprocal crystal. We would like to measure ‘distances’ and draw vectors in reciprocal space. Here we consider ways of doing this. The units in reciprocal space is [m 1]. Usually, expressed as Å 1 or nm 1. The reciprocal space vectors are vectors in reciprocal space (more details in the link below); usually marked with a star (*). There are other ways of representing dimensions/vectors in reciprocal space (as below).
Solved Example During a powder diffraction experiment, at what does the first peak from BCC Fe and FCC Fe occur? Assume that the radius of the Fe atom is the same in both the structures. First a point regarding the assumption. The ‘radius of the atom’ (Fe in the current case) depends on the crystal structure and the local electronic environment and hence. Also, the answer to the question: “What is the radius of an atom? ” is a tricky one (even for a free atom, let alone in a metallic alloy). The first peak for BCC is from the (110) planes, while for FCC it is from the (110) planes. BCC FCC This implies that the position of the first Bragg peak at the same location (though in reality it will shift a little due to the change in the value of ‘r’ between the FCC and BCC structures).
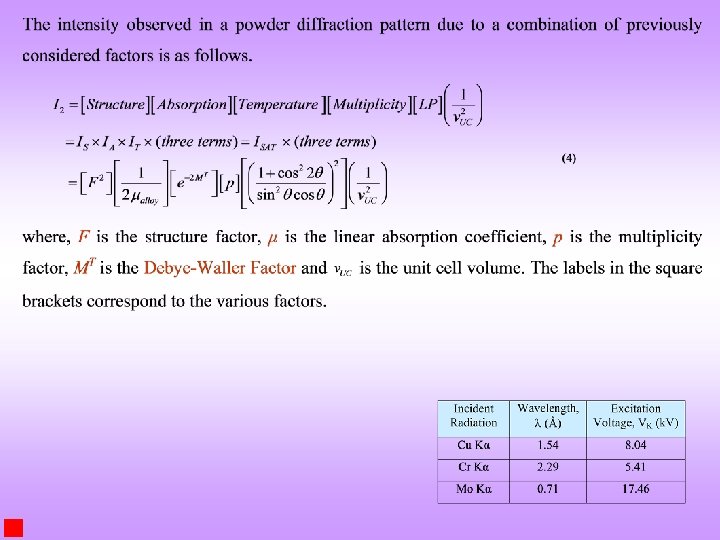
Relative Intensity of diffraction lines in a powder pattern Structure Factor (F) Scattering from UC (Atomic Scattering Factor is included in this term) structure_factor_calculations. ppt Multiplicity factor (p) Polarization factor Lorentz factor Number of equivalent scattering planes Effect of wave polarization Combination of 3 geometric factors Absorption factor Specimen absorption Temperature factor Thermal diffuse scattering The Lorentz and polarization factors both depend on (geometry) and are usually combined into the Lorentzpolarization factor Details are in the next few slides a beginner may skip these
Detailed calculation of the intensity of a Bragg peak in a powder pattern
End
Diffuse peak from Cu-Zr-Ni-Al-Si Metallic glass (XRD patterns) courtesy: Dr. Kallol Mondal, MSE, IITK